NEON Observational Sampling at SRER
NEON’s observational sampling produces open data which are freely available.
Download the latest versions of NEON’s terrestrial protocols here.
NEON infrastructure can also be considered a platform for Principal Investigators to propose adding additional research through NEON’s Assignable Assets Program. Because NEON does not own any of the land on which NEON infrastructure operates, research teams are responsible for obtaining any required research permits and site access permission prior to any work being conducted. Learn more about NEON’s Assignable Asset Program and how NEON can support additional research activities.
NEON plot descriptions and protocols carried out within each plot type at SRER are listed below.
Tower Base Plots: 40 x 40 m ecosystem productivity plots (n = 18) located within the Tower Airshed (the critical area near the Terrestrial Instrument System tower in which flux measurements are obtained—i.e., CO2, water, and energy flux). Associated protocols include: Soil Biogeochemical and Microbial Sampling, Canopy Foliar Sampling, Litterfall, and Fine Woody Debris, Plant Diversity Sampling, Measurement of Herbaceous Biomass, Plant Below Ground Biomass Sampling, Measurement of Leaf Area Index, and Measurement of Vegetation Structure.
Tower Phenology Plots: 200m x 200m plant phenology plots (n = 2) located inside the Tower Airshed. The northern-most plant phenology plot (of which only the southern boundary is established) is associated with the tower phenocam. The southern-most phenology plot is an 800 m long ‘transect’ loop. Associated protocols include: Plant Phenology.
Distributed Base Plots: 40 x 40 m plots (n = 30) located outside the Tower Airshed and proportionally distributed in areas representative of the vegetation community at SRER. Associated protocols include: Canopy Foliar Sampling, Soil Biogeochemical and Microbial Sampling, Plant Diversity Sampling, Measurement of Herbaceous Biomass, Ground Beetle Sampling, Measurement of Vegetation Structure, and Measurement of Leaf Area Index.
Distributed Mammal Grids: 90 x 90 m plots (n = 9) co-located with Distributed Base Plots. Associated protocols include: Small Mammal Sampling
Distributed Tick Plots: 40 x 40 m plots (n = 6) co-located with Distributed Base Plots. Associated protocols include: Tick and Tick-Borne Pathogen Sampling.
Distributed Mosquito Points: Single points (n = 10) located outside the Tower Airshed in areas representative of the vegetation community at SRER. Associated protocols include: Mosquito Sampling.
Distributed Bird Grids: 500 x 500 m plots (n = 12) located outside the Tower Airshed in areas representative of the vegetation community at SRER. Associated protocols include: Breeding Landbird Abundance and Diversity.
Breeding landbird sampling provides robust estimates of species diversity, abundance, and density. Point counts of breeding landbirds takes place during the active breeding season (spring at SRER) for resident birds. Sampling occurs in Distributed Bird Grids (n = 12) located in areas representative of overall vegetation cover characteristic of SRER. Nine observation points are located at each. Each point count lasts for six minutes plus an additional two-minute settling-in period. Sampling occurs in the early morning when birds are most active and ambient noise is at a minimum. Technicians record the species, sex, and distance from point for every landbird seen or heard during the six minutes.
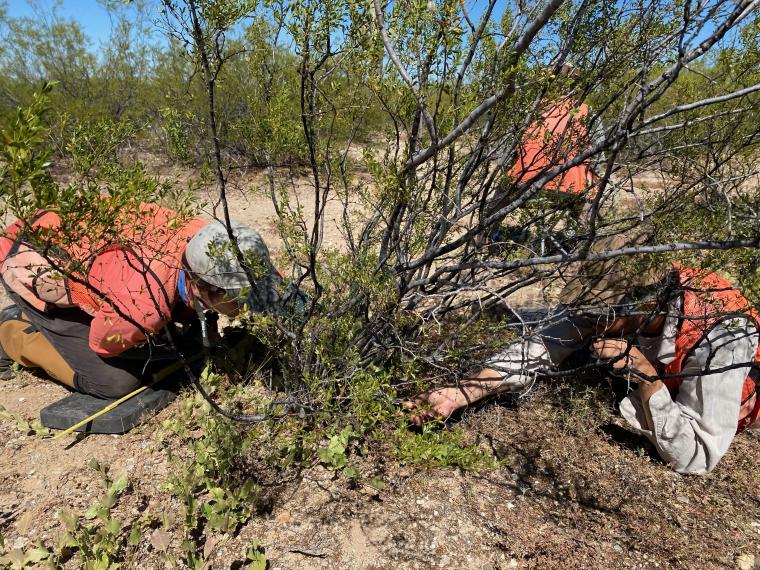
The Canopy Foliage Sampling protocol is designed to track changes in chemical and physical properties of sun-lit foliage across NEON sites over time. This includes leaf mass per area, chlorophyll, carbon and nitrogen concentrations and stable isotopes, lignin, and major and minor elements. Multiple sun-lit foliage samples, either from woody individuals (trees and shrubs) or herbaceous clip strips, will be collected across NEON sites. Canopy foliar samples are collected at SRER in Tower Base and Distributed Base plots (n = variable) once every five years, and sampling will be timed to coincide with NEON’s airborne observation system overflights. With this approach, foliar data can help researchers develop models linking canopy traits to remotely sensed data, which can then be used to measure and map vegetation at larger scales.
NEON_SRER CFC.jpg
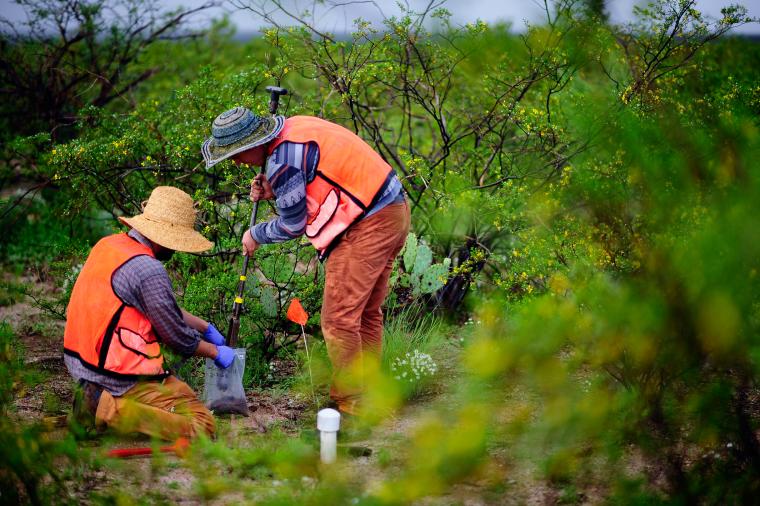
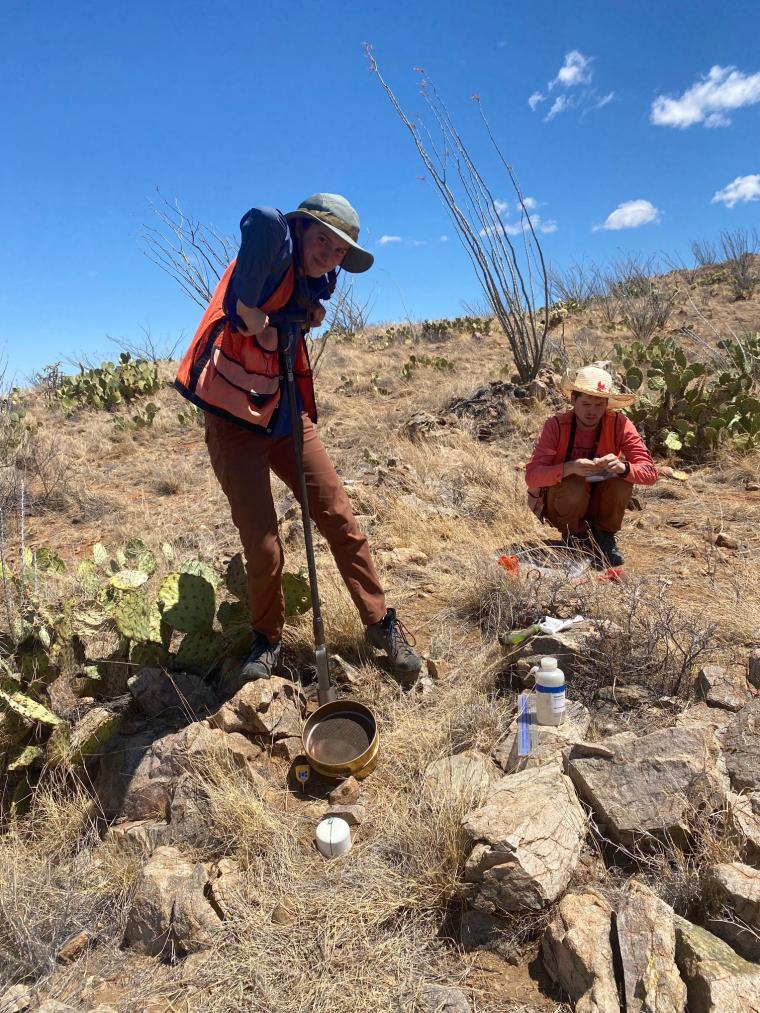
Below-ground biomass represents a substantial component of the total plant biomass and plant carbon in terrestrial ecosystems, yet belowground biomass stocks and turnover remain very poorly understood both in space and in time. Developing a better understanding of belowground plant biomass, as well as how much of that biomass is produced and decomposed within a given year, is therefore crucial to improving our understanding of how terrestrial ecosystems respond to environmental changes. Below-ground biomass samples are collected every five years at SRER and provide insight into how fast biomass is produced and decomposed. Two below ground biomass cores (7.6 cm diameter x 30 cm deep) are collected at previously determined random locations within each of the Tower Base Plots (n = 18). Core samples within each plot are combined for a total of 18 samples per bout. Samples are sieved to remove soil, picked to separate roots from other organic material, and roots are then sorted into diameter size classes. NEON will perform a one-time assessment of this biomass pool per site during the first 5 years of Operations, and standard root sampling events will adopt a 1 cm length cutoff.
Carabid (ground beetle) diversity sampling will be used to help us understand how the distribution of ground beetles changes in different habitats and ecosystems over time. Ground beetle species are found in each of the NEON domains, are easy to sample and identify, and changes in their population can indicate significant changes in the local ecological community due to their environmental sensitivity and diverse niche. NEON will conduct biweekly sampling at sites over the course of the growing season (roughly March – November at SRER). NEON will collect ground beetle specimens using 3 pitfall traps at each of 10 distributed base plots per site (30 total traps). The pitfall cups will be flush in the ground and shaded by flat covers to keep out sun, rain and vertebrates. Each sampling bout will occur for 14 consecutive days and require a pair of field technicians to access plots on foot once during each bout.
Herbaceous vegetation (operationally defined in this protocol as non-woody plants as well as woody-stemmed plants with a diameter at decimeter height < 1 cm at the time of sampling) can respond relatively rapidly to various global change drivers. Understanding long-term trends in herbaceous community structure and biomass is very important in grazed ecosystems where these plants constitute a critical food source for wildlife and livestock. Herbaceous biomass clip-harvests at SRER occurs annually at peak green in randomly assigned clip-harvest strips (0.1 m x 2 m) located within all Tower Base Plots (n = 18) and once every five years in a subset of Distributed Base Plots (n = 20). Clip harvest data can be used to estimate the amount of herbaceous biomass produced within the delineated clip strip area. The material collected is sorted into functional groups and weighed to determine Net Primary Production.
Leaf area index (LAI) is a dimensionless quantity that characterizes plant canopies. LAI is a useful proxy variable for numerous other variables of ecological interest including plant biomass, plant productivity, forage quality, carbon balance, ecosystem energy flux, plant density, and the heterogeneity of plant cover. LAI is also used widely as a key input variable to models that seek to predict ecological processes such as carbon cycling. Regional to continental scale estimates of LAI are typically derived from satellite data, but validation of satellite data with aircraft and ground-collected data is relatively uncommon. By leveraging NEON’s aircraft and ground-collected estimates of LAI, it will be possible to develop ground-validated estimates of LAI at the continental scale. NEON uses the Digital Hemispherical Photo (DHP) system (aka fisheye photos) to estimate LAI, since it is rapid and non-destructive. DHP are collected across SRER through time: 1) data are collected on the ground every five years from Distributed Base Plots (n = 20) and those data are used in conjunction with NEON’s Arial Observation Platform (AOP) LAI data products to estimate LAI at the site scale; and 2) data are collected every two weeks during the growing season at a subset of Tower Base Plots (n = 3) that will be used to construct a time-series dataset that will complement the spatial extensive snapshot of LAI generated from AOP data.
Quantifying production of litterfall and fine woody debris is required to estimate annual above-ground net primary productivity at plot, site, and continental scales, and provides essential data for understanding vegetative carbon fluxes over time. Litter traps are deployed in pairs, one elevated (70 cm x 70 cm x 80 cm, 0.8 m tall) and one ground trap (3 m x 0.5 m) per pair. Litterfall and fine woody debris production at SRER are estimated using one set of paired traps in two randomly selected locations in each Tower Base Plots (n = 18). Elevated litter traps are designed to be large enough that the average size of abundant foliage and fine woody debris elements are easily intercepted by the trap. Ground traps are intended to intercept particularly large foliage elements that will not fit in elevated traps, and fine woody debris pieces that are too long to be sampled in elevated traps including small diameter branches. Elevated litter trap samples are collected year-round on a monthly basis, while ground trap samples are collected annually. Plant litter is sorted into functional groups, which are dried and weighed to determine net primary production. Dried litterfall samples are ground and submitted for biogeochemistry analyses and archive at SRER every five years.
Mosquito sampling focuses on how the diversity of mosquito communities, and the demography and phenology of associated populations, will change in different habitats and ecosystems over time. Mosquitoes are easy to sample, sensitive to environmental change, and present at each of the NEON domains. Field technicians erect a single hanging CO2 trap in each of 10 Mosquito Points located in areas representative of the vegetation community at SRER. Traps are deployed every two weeks year-round for two consecutive nights and the intervening day. Pathogen testing involves a variety of mosquito species, especially those in the genera Culex and Aedes. General pathogen screening takes place to detect alphaviruses, bunyaviruses, and flaviviruses, with follow-up tests on virus-positive pools to identify pathogens. A subset of all the mosquitoes collected at SRER is submitted for DNA barcoding each year. DNA barcoding is a taxonomic method that uses a short genetic marker (mitochondrial gene, COI) to identify species. NEON is using DNA barcoding to establish a library of mosquitoes at our sites to aid in specimen identification. Along with expert morphological identifications, this will ensure consistency of identifications across many technicians at different sites for 30 years of data collection.
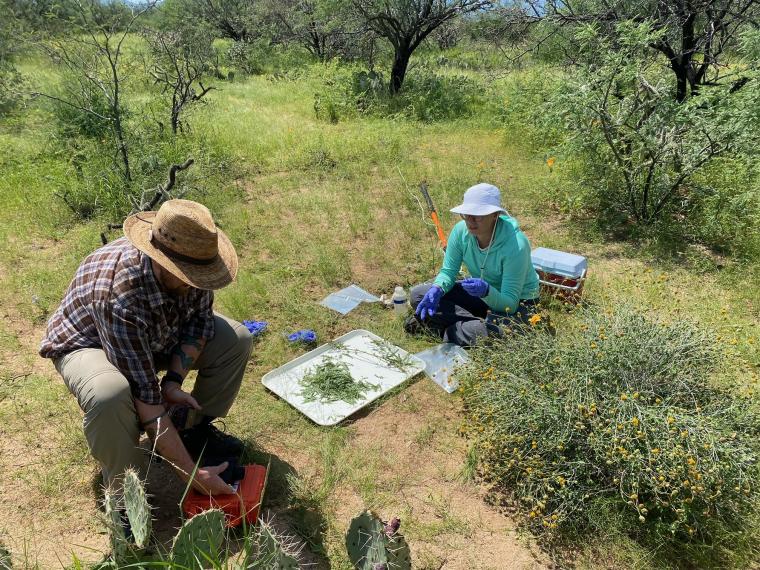
Plant diversity sampling is used to describe the annual variation of the presence and abundance of plant species at NEON sites. Plant diversity sampling at SRER is measured twice annually around peak flowering. Plant species composition, presence and abundance data, and estimates of cover are collected within a subset of Tower Base Plots (n = 3) and Distributed Base Plots (n=30). The plot-based method yields plant species data at multiple scales that provides an understanding of changes in composition, distribution, and abundance, of native and non-native plant species. Plant diversity data are comparable within and across NEON sites and to other continental vegetation efforts to allow for a comprehensive understanding of the impacts of the drivers of change on the diversity of plant species and the functional role they play in ecological systems. Voucher specimens of twenty to forty of the common species found in the plots will be collected, pressed, mounted, and stored. Voucher specimens provide a permanent record of the NEON naming convention, use of authorities, validation, and a means to track taxonomic naming conventions through time. Specimens will be collected during peak phenology, and will be pressed, dried, and mounted according to herbaria standards such that species identity can be evaluated in the future.
NEON_SRER DIV.jpg
NEON plant phenology measurements record the seasonal progression of critical biological processes and the timing of ecological events. Phenology measurements track sensitive and easily observed indicators of biotic responses to climate variability by recording and monitoring the timing and duration of phenological stages in plant communities. NEON employs a status based monitoring strategy; occurrence and intensity of selected phenophases are recorded in order to track rates of phenological transitions and trends in the annual timing of those transitions. Data are collected in a manner consistent with, and therefore comparable to, existing national citizen science campaigns (i.e. National Phenology Network, Project Budburst) thereby leveraging existing and ongoing efforts throughout the United States to increase the potential for continental-scale analysis and forecasting. Phenological observations at SRER occur weekly within the tower airshed (20 species, up to 100 individual plants) along an 800m fixed ‘loop’ transect, and along the southern boundary of the tower phenocam plot (3 species, 9 individuals).
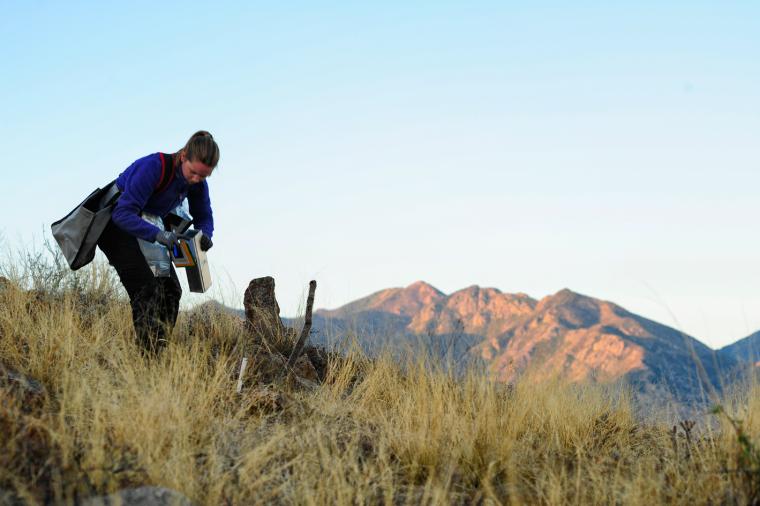
NEON uses a mark-recapture approach to study small mammals and mammal-borne disease. Small mammals include any mammal that is (1) nonvolant; (2) nocturnally active; (3) forages predominantly aboveground; and (4) is greater than 5 grams but less than approximately 500 g. In North America, this includes cricetids, heteromyids, small sciurids, and introduced murids. It does not include shrews, large squirrels, rabbits, or weasels, despite the fact that individuals of these species may be incidentally captured. Sampling occurs six times per year at 6 Small Mammal Grids located throughout SRER. Due to consistently high capture rates at SRER, a subset of Sherman live traps (n = 49) is utilized, rather than the 100 traps used at most other NEON sites. The onset of any given trapping cycle begins within ą 10 days of the start of a new moon and lasts for a one-three day period at any given plot. Traps are set and baited at or near sunset and then checked each morning. Capture data include species ID, reproductive condition, morphometric measurements, and body mass. Additionally, a blood sample may be collected for laboratory disease testing, ear tissue sample for species ID verification, and hair and fecal samples for archiving. Individuals are promptly marked and released at the site of capture. Traps are either closed for the remainder of the day and then reset the evening before sunset or removed at the end of a trapping cycle.
NEON_SRER MAM.jpg
Soil samples are collected at NEON sites to determine microbial biodiversity and function, total carbon and nitrogen data, and nitrogen (N) transformation rates. The measurements can be used to quantify stocks of soil organic matter, understand the nutrient status of the ecosystem, elucidate rates of microbially-mediated processes, and examine how microbial biomass and community composition vary in space and time and relate to soil biogeochemical dynamics. Additionally, NEON characterizes soil pH and gravimetric water content, which are some of the environmental controls on microbes and biogeochemical processes. Three soil cores (to maximum 30 cm depth) are collected at pre-determined locations within select Distributed Base Plots (n = 6) and Tower Base Plots (n = 4) at SRER. Soil microbes, pH, and moisture are measured during all soil sampling bouts, while biogeochemical measurements, microbial biomass, and N-transformation rates are measured once every 5 years Soil samples at SRER are collected during the transition from dry season to wet season, during summer peak biomass, and during the transition from wet season to dry season.
NEON_SRER Ntrans.jpeg
NEON_SRER T1 soil microbes_rotate.jpg
Tick sampling is used to quantify spatio-temporal changes in the abundance of ticks at NEON sites and to look at the prevalence of infection by associated tick-borne pathogens. Sampling focuses on the hard ticks (family Ixodidae), specifically the black-legged tick (Ixodes scapularis), western blacklegged tick (I. pacificus), lone star tick (Amblyomma americanum), gulf coast tick (A. maculatum), Rocky Mountain wood tick (Dermacentor andersoni), and American dog tick (D. variabilis). Tick and tick-borne pathogen sampling at NEON sites involves the collection of ticks using drag sampling. A team of two technicians slowly pull a weighted drag cloth over ground vegetation located along the perimeter of Distributed Tick Plots (n = 6) at SRER. Bouts occur every three to six weeks annually between March and December. Adult, nymphal, and larval stages are collected and sent out to external lab facilities for pathogen testing. Analyses test for pathogens such as Borrelia, Anaplasma, Francisella, Ehrlichia, and Rickettsia.
Woody Vegetation Structure will measure key aspects of vegetation structure that are directly comparable to airborne LiDAR observations, as well as additional structural metrics that enable estimation of per stem and per plot plant biomass and productivity. These measurements include: stem diameter(s), canopy diameter(s), stem height, stem location (for stems that meet certain criteria), stem species identification, canopy position, and stem status (i.e. healthy, dead, or damaged). Woody Vegetation Structure data at SRER are collected every 5 years in all Tower Base Plots (n = 18) and every 5 years in a subset of Distributed Base Plots (n = 20). Within each plot sampling occurs within two randomly selected subplots (quadrants of the entire plot). Specific growth forms will be measured at a limited nested subplot size based on the abundance of the specific growth form but within sixteen total nested subplots.
NEON_SRER vegetation structure.jpeg