Monsoon Basics & Climatology
What causes the monsoon?
The North American Monsoon (NAM) is driven by a seasonal shift in the region’s atmospheric circulation, not a single storm system. As summer heating builds over the interior Southwest and northern Mexico, a subtropical ridge of high pressure develops aloft and migrates north, typically settling over the Four Corners/southern Rockies by July. That ridge reshapes the flow around it, opening a corridor for moist air to move north into Arizona and New Mexico instead of the dry westerly flow that dominates the rest of the year.
Where that moisture comes from is genuinely a mix of sources — the Gulf of California, the tropical/eastern Pacific, and the Gulf of Mexico all contribute at different times and levels of the atmosphere, and their relative importance shifts through the season. This site’s TCWV and Q700 diagnostics track the net result of that mixing — how much moisture has actually arrived and how deep it extends — rather than trying to attribute it to one source or another.
One well-documented piece of the moisture pathway is the Gulf surge (Hales 1972): a pulse of cool, humid air that moves north up the Gulf of California and into Arizona, sometimes in a matter of hours. Surges range from minor, thunderstorm-outflow-driven pulses to major events tied to tropical disturbances that can raise moisture for a day or more. Importantly, a surge is a moisture event, not a rain guarantee — roughly half of Gulf surges arrive without a corresponding jump in rainfall. That’s part of why this site tracks atmospheric moisture (TCWV, Q700) and precipitation as separate, complementary diagnostics rather than treating one as a stand-in for the other.
Why it matters
The monsoon delivers 40% or more of Arizona and New Mexico’s annual precipitation, and over half of the annual total across parts of western Mexico (Adams and Comrie 1997). It’s the primary summer water source for the region’s ecosystems, recharges soil moisture heading into fall and winter, and typically marks the transition out of the peak wildfire season. It also brings its own hazards — flash flooding, lightning, and dust storms (haboobs) are all monsoon-season features that this kind of daily moisture and precipitation tracking helps put in context.
A short research history
The NAM has been studied as a distinct circulation system since at least the 1970s, with Hales’ (1972) work on Gulf surges among the earliest detailed accounts of the moisture pathway into Arizona. The Southwest Area Monsoon Project (SWAMP) field campaign followed around 1990, producing observational data on the mesoscale convective systems that drive monsoon rainfall over the Southwest and northwest Mexico (Farfán and Zehnder 1994). That SWAMP-era observational base fed into Adams and Comrie’s (1997) synthesis later in the decade, which helped establish “North American Monsoon” as the standard name and framework for the system. The North American Monsoon Experiment (NAME, early-to-mid 2000s) followed as a larger, multi-agency field and modeling effort, further filling out the observational basis for how the monsoon’s moisture sources, timing, and variability are understood today.
Two of the diagnostics on this site have direct precedent in that literature: subtropical ridge tracking via 500 hPa heights is standard practice going back to the earliest NAM composite studies, and total column water vapor has its own dedicated line of research as a monsoon diagnostic (Means and Alexander 2013). The 700 hPa moisture threshold is our own choice of cutoff, applied in the same spirit as those studies’ use of 700 hPa humidity composites, rather than a number drawn from a specific paper.
Key studies
- Adams, D. K., and A. C. Comrie, 1997: The North American Monsoon. Bulletin of the American Meteorological Society, 78, 2197–2213.
- Douglas, M. W., R. A. Maddox, K. Howard, and S. Reyes, 1993: The Mexican Monsoon. Journal of Climate, 6, 1665–1677.
- Farfán, L. M., and J. A. Zehnder, 1994: Moving and Stationary Mesoscale Convective Systems over Northwest Mexico during the Southwest Area Monsoon Project. Weather and Forecasting, 9, 630–639.
- Hales, J. E., 1972: Surges of maritime tropical air northward over the Gulf of California. Monthly Weather Review, 100, 298–306.
- Higgins, R. W., and Coauthors, 2006: The NAME 2004 Field Campaign and Modeling Study. Journal of Climate, 19, 1665–1683.
- Jana, S., B. Rajagopalan, M. A. Alexander, and A. J. Ray, 2018: Understanding the Dominant Sources and Tracks of Moisture for Summer Rainfall in the Southwest United States. Journal of Geophysical Research: Atmospheres, 123, 4850–4870.
- Means, J. D., and M. A. Alexander, 2013: GPS Precipitable Water as a Diagnostic of the North American Monsoon in California and Nevada. Journal of Climate, 26.
What this site tracks
This site tracks the NAM’s daily evolution from June 1 through October 31, using four core diagnostics:
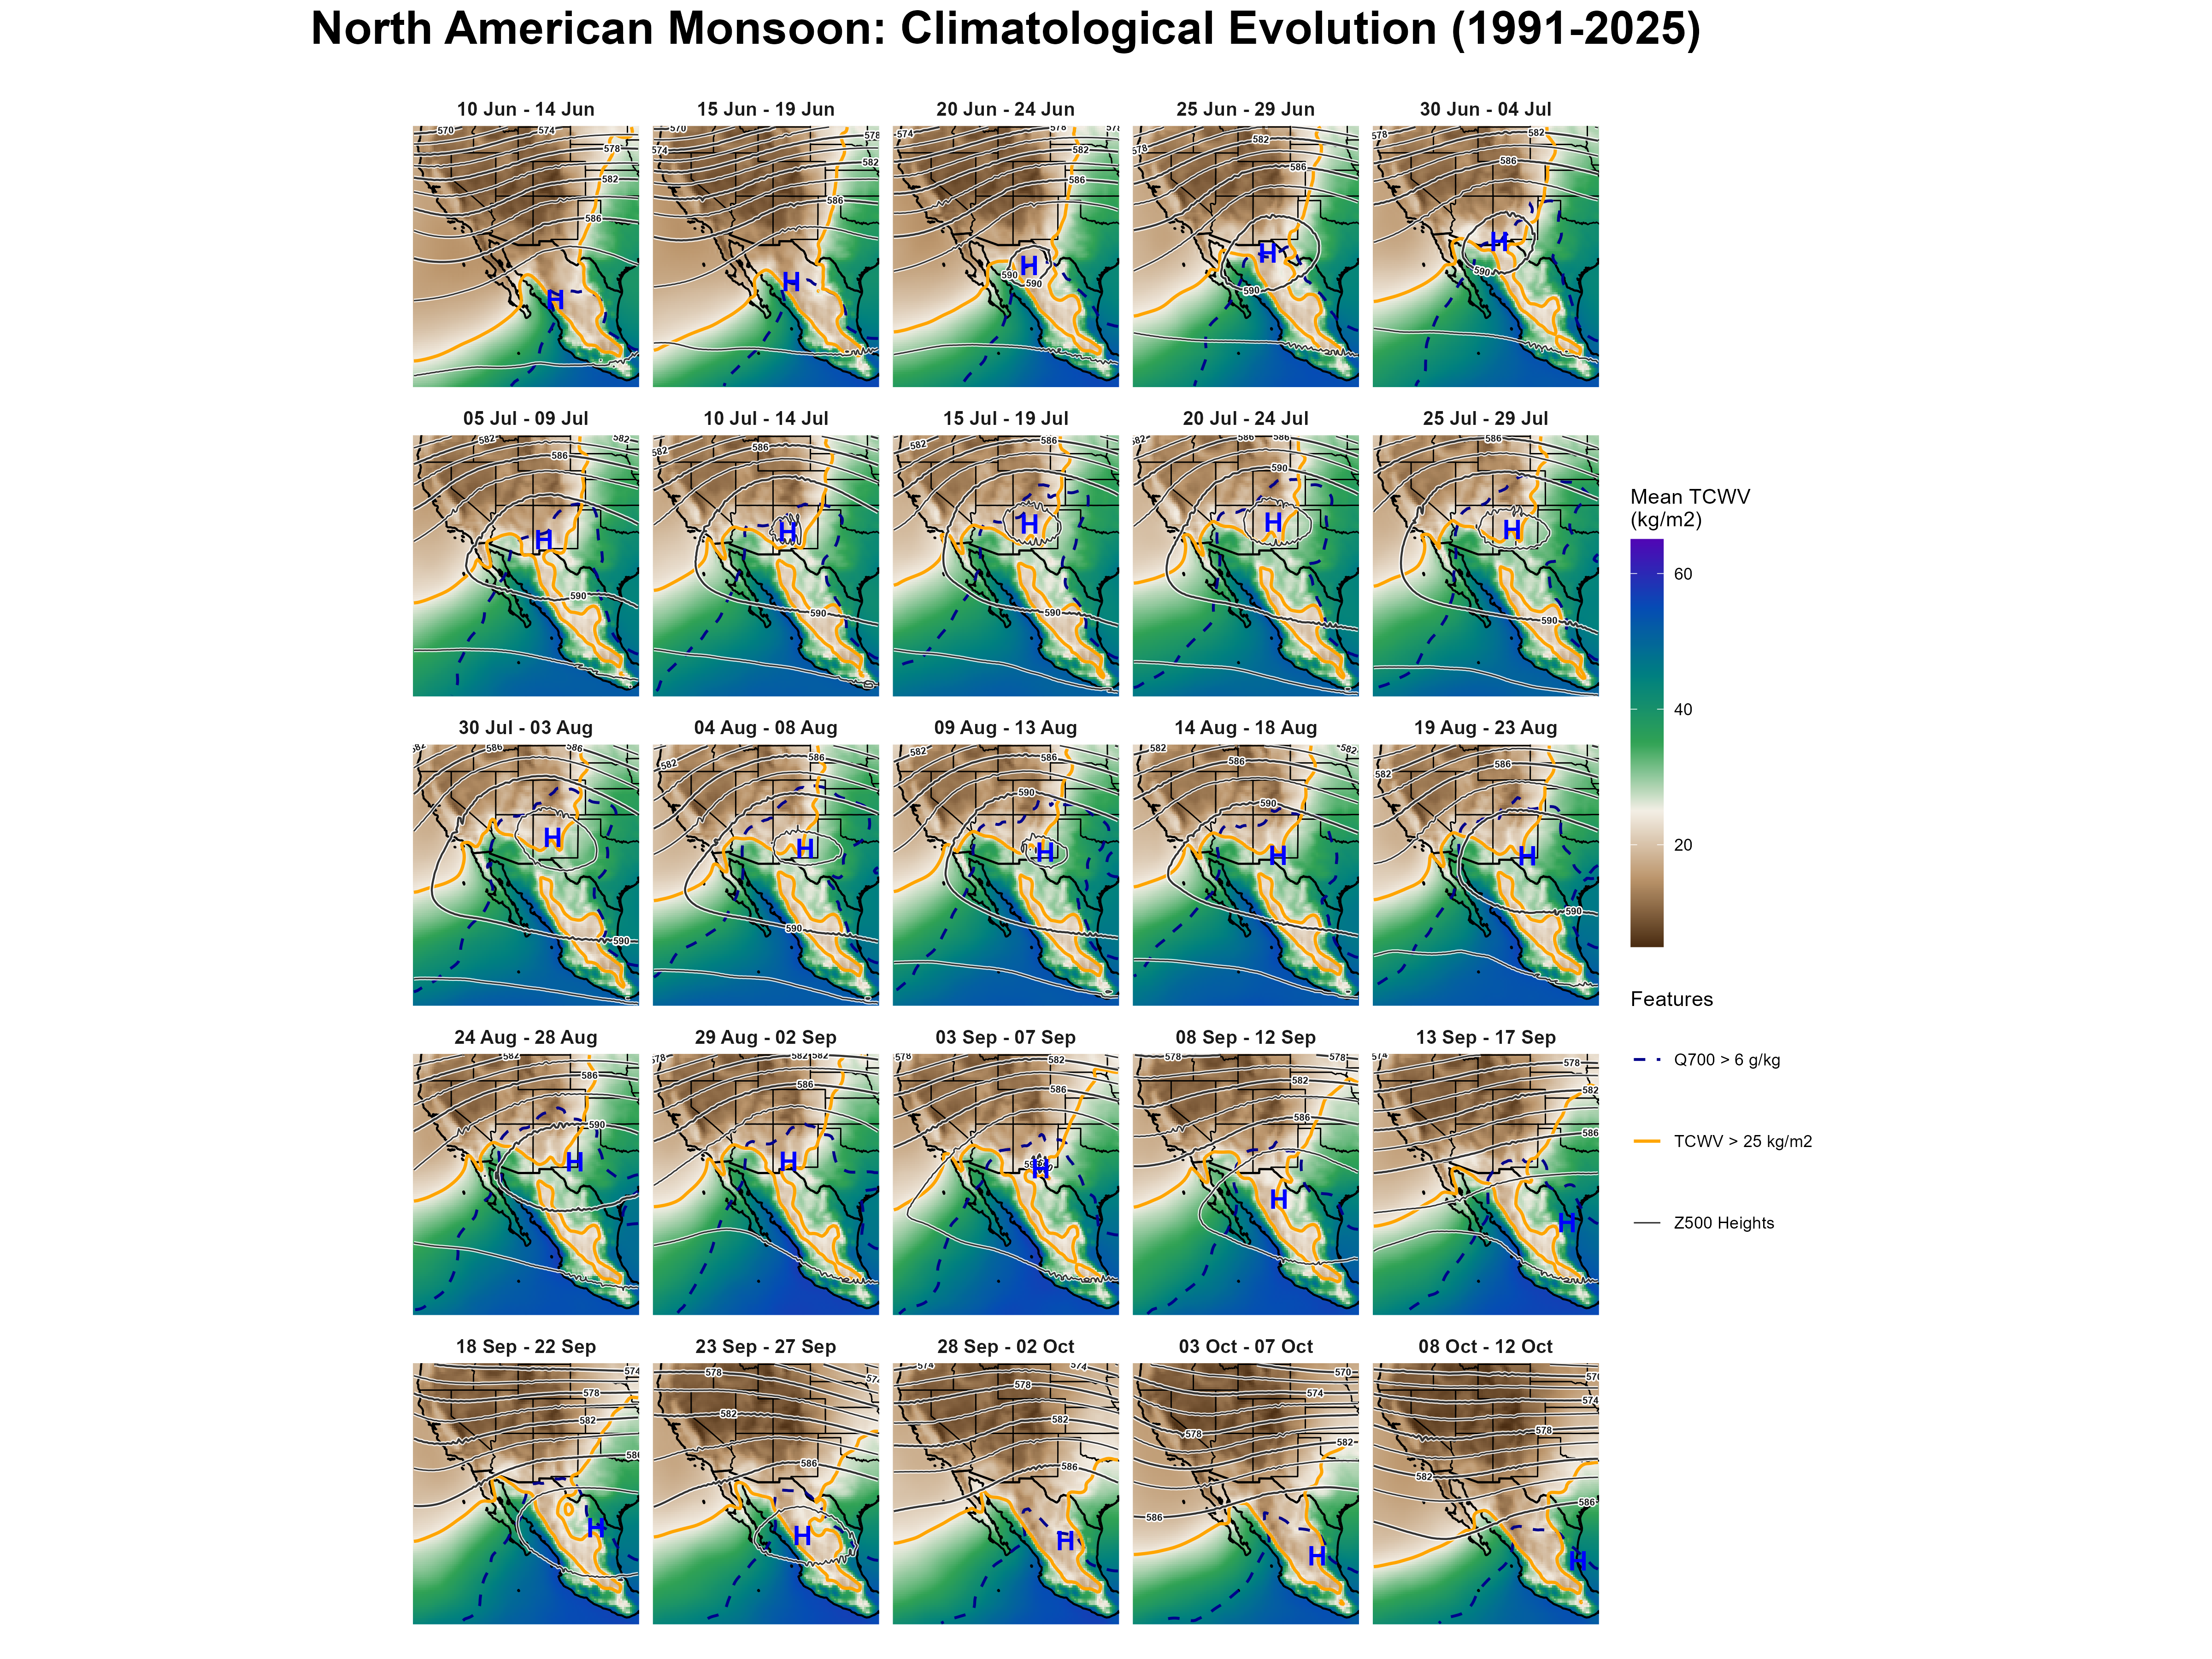
- TCWV (total column water vapor) — a measure of how much moisture is sitting in the atmospheric column above a location. This is the main “is it monsoon-y here” signal used throughout the site.
- Z500 (500 hPa geopotential height) — the mid-level pressure pattern. Its local maximum is the monsoon ridge, marked on every map as H.
- Q700 (700 hPa specific humidity) — whether moisture has reached mid-levels, not just the surface. TCWV can be elevated by moisture that’s shallow and capped near the surface; Q700 crossing its threshold means the moisture is deep enough to fuel thunderstorm development, particularly over higher terrain.
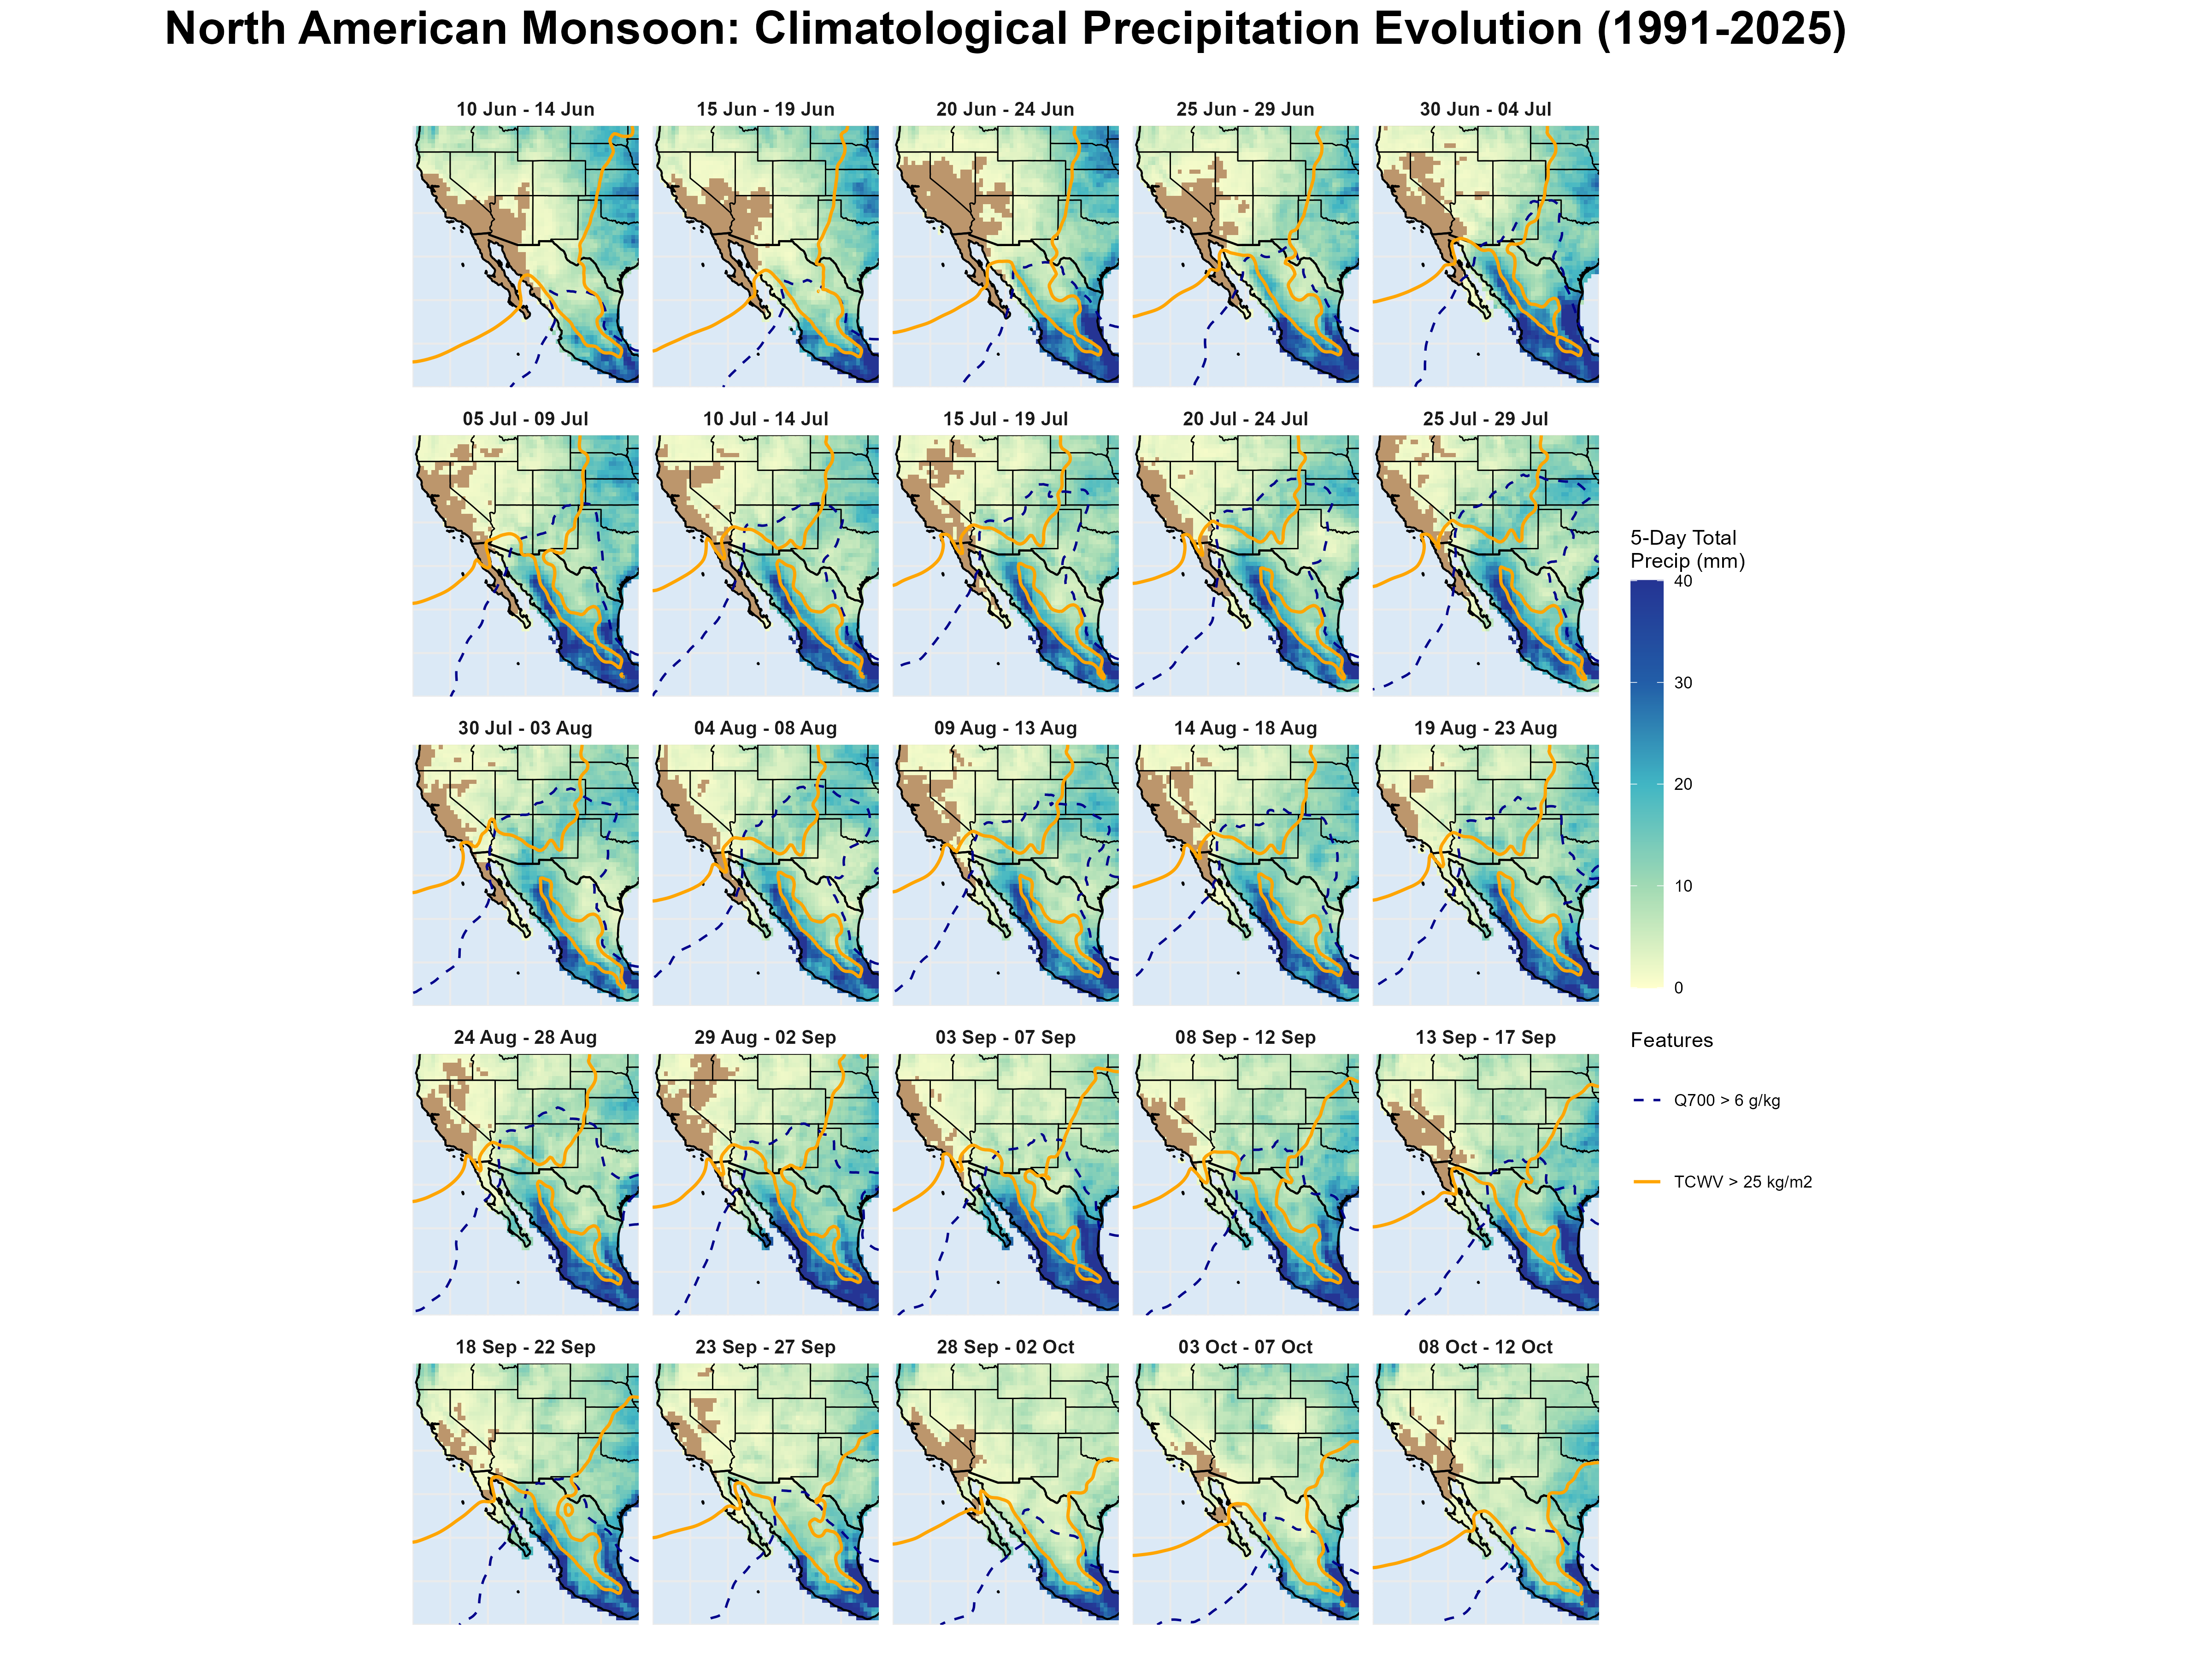
- Precipitation — what actually fell as rain, from a separate gauge-based data source (not derived from the atmospheric fields above). Moisture and rainfall are related but distinct signals — elevated TCWV or Q700 doesn’t guarantee rain, and this site tracks both so that setup and outcome can be compared directly rather than assumed.
Every map on this site pairs a fill (usually TCWV, sometimes precipitation) with contour lines (usually Z500, sometimes Q700) and, where relevant, the tracked position of the ridge.
The 1991–2025 baseline
“Normal” on this site means the 1991–2025 average for that exact calendar day (or 5-day block), built from ERA5 reanalysis and lightly smoothed across a 5-day window to reduce day-to-day noise. Every anomaly map or chart you see elsewhere on the site — daily, Hovmöller, or 5-day — is computed against this same pixel-by-pixel baseline. Full processing details are on the Methods page.
A normal season, start to finish
The grid below collapses 35 years of data into 25 five-day blocks running June 10 through October 12, showing the climatological mean TCWV, Z500 ridge position, and moisture contours at each stage of the season. This is the reference pattern every individual year on the Historical Seasons page gets compared against.
The same 25 blocks, now showing what actually fell as rain rather than atmospheric moisture, with the TCWV and Q700 moisture isolines from the map above overlaid so setup and outcome can be read on the same panel. Comparing the two grids side by side is a reminder that they’re related but distinct signals — moisture setup versus realized rainfall.
The season at a glance
The same baseline collapsed further, into one mean state per calendar month, gives the coarsest possible view of how the ridge and moisture field migrate north through the summer and retreat in the fall.

And the same collapse applied to precipitation — each month’s mean total rainfall, June through October, with the same TCWV and Q700 isolines overlaid.

For how any of this is actually computed — data source, baseline construction, ridge tracking, corridor and block definitions — see Data & Methods.
The maps above show the ridge as it appears in an averaged field — one H per 5-day block or per month, detected on the mean pattern. This one works the other way around: it detects the 500 hPa height maximum on each individual day of the 1991–2025 record, then asks where those daily positions actually fall.

The seasonal signal is in latitude. The ridge migrates north through July (median 35.3°N) and retreats through October (25.8°N), and in July and August the daily positions cluster tightly enough that the monthly marker means something. That north–south march is the climatological backbone of the monsoon season, and it is what this figure is for.
Longitude should be read much more loosely. Only days whose detected centre sits more than 5° from the edge of the analysis domain are used — closer than that, the detector cannot see enough of the ridge’s shoulder to trust the position. That restriction leaves 47.8% of the record, and only 29.5% of October. It also confines the surviving days to a fixed longitude window, and within that window each month’s spread is close to what a uniform scatter would produce. The horizontal bars are best read as a reminder that the ridge is a broad feature, not as a measurement of where it prefers to sit.
The individual daily points are shown deliberately, and they are the honest part of the figure. On any given day the algorithm returns the largest height maximum in the domain, which is not always the monsoon anticyclone — it can be the Bermuda ridge to the east or a Pacific ridge to the west, and the method has no way to tell them apart. A monthly marker averages across whatever mixture the month contained. Showing the underlying scatter, and drawing it over the mean height contours, lets that mixture stay visible rather than disappearing into a single dot.
Per-season versions of this map, showing one year of daily positions at a time, appear on the Seasonal Summary tab of each year’s page under Historical Seasons.
Further resources
- CLIMAS: Monsoon — regional climate outlooks and monsoon-season context from the University of Arizona’s CLIMAS program.
- NOAA Climate.gov: The North American Monsoon — an ENSO Blog primer covering monsoon basics, regional impacts, research history, and its (modest) relationship to El Niño/La Niña.
- National Weather Service Tucson: Monsoon — local monsoon tracking, safety information, and season summaries.
- Southwest US Summer Monsoon Precipitation Mapping — season precipitation mapping for the Southwest.
- AZ Monsoon Season Precipitation Maps — daily-updated (June 15–Sept 30) Arizona precipitation maps (totals, rain-day frequency, heavy-rain days, wet/dry spells, and more), from the same UA Climate Science Applications Program.
- NM Monsoon Season Precipitation Maps — the New Mexico counterpart to the AZ monsoon maps above.
- Southwest U.S. Station Climate Summaries — station-level climate summary plots for 100+ GHCN stations across Arizona and New Mexico, including dedicated monsoon-season views.