2026 Monsoon Season
Explore the 2026 monsoon season through four complementary views: a day-by-day map viewer, a season-long Hovmöller diagram, 5-day evolution snapshots, and a full-season summary. See Methods for how each is built.
This page updates as the pipeline is re-run through the season. The atmospheric fields use ERA5T, ECMWF’s preliminary near-real-time release, and the precipitation totals use NOAA CPC’s early release - both can be revised for a few months after the fact before the final, archival version replaces them. See Methods for details.
Step through the season day by day: the observed TCWV and 500 hPa ridge position (top-left) and its anomaly vs. the 1991–2025 baseline (bottom-left), alongside the precipitation that setup produced (top-right) and its anomaly (bottom-right). Precipitation is offset one calendar day from the atmospheric fields to align with NOAA CPC’s rain-gauge accumulation window — see Methods for why. Use the slider, the ◀/▶ buttons, or your keyboard’s Left/Right arrow keys to step through days; Play animates (adjust speed with the dropdown); click any frame to open it full-size.
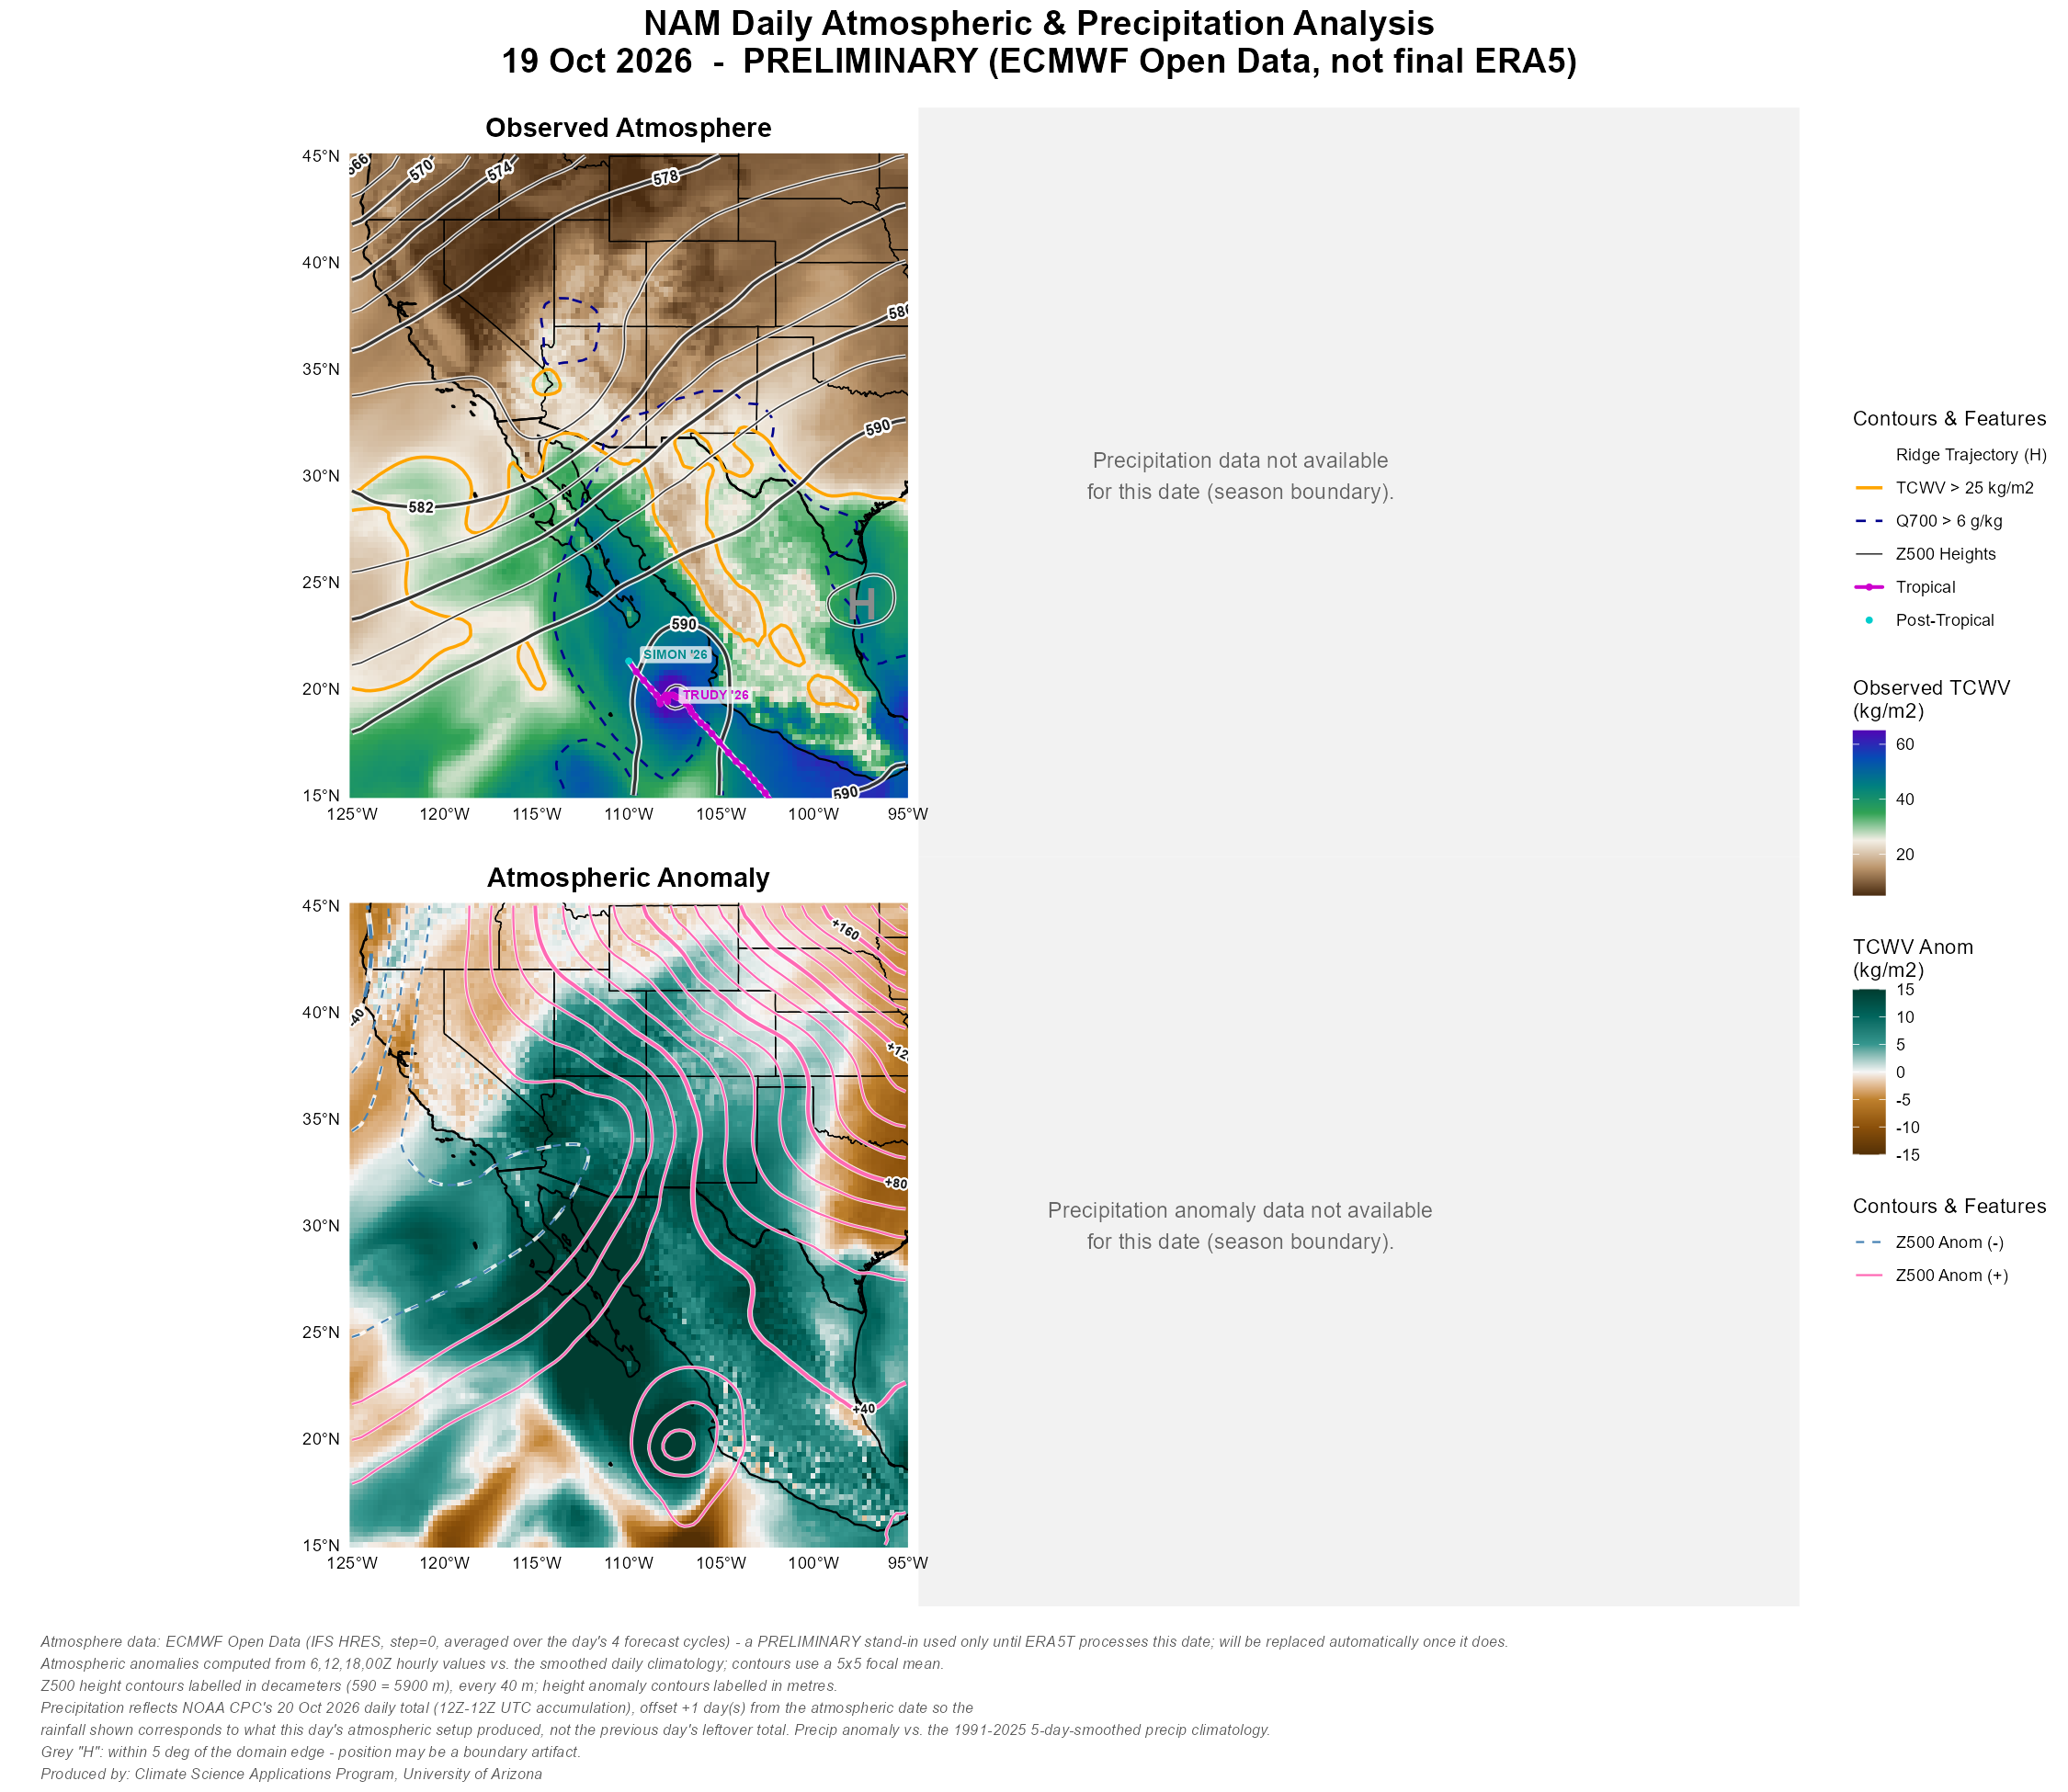
Each frame shows two views of the same day: total column water vapor (TCWV) on the left, and that day’s departure from normal on the right. TCWV is how much water is present in a vertical slice of the atmosphere, integrated from the surface to the top of the column — it’s the same quantity meteorologists usually call precipitable water. It’s expressed in kg/m², which is numerically equivalent to millimeters of rainfall if every drop of that vapor condensed and fell out at once. It’s the single best number for asking “how much monsoon moisture is actually here today.”
Three contour lines mark specific thresholds:
- Orange solid line — TCWV > 25 kg/m². The boundary of monsoon-relevant deep moisture, and the line most commonly used to mark whether a location has been “reached” by the monsoon airmass on a given day.
- Navy dashed line — 700 hPa specific humidity (Q700) > 6 g/kg. Marks whether moisture has reached mid-levels, not just the surface. TCWV can be elevated by a shallow, capped moisture layer that won’t readily support thunderstorm development — Q700 crossing this threshold indicates the moisture is deep enough to fuel convection, particularly over higher terrain.
- Gray lines — 500 hPa geopotential height (Z500), contoured every 20 m. The mid-tropospheric pressure pattern. Its local maximum, marked H, is the subtropical ridge — its strength and position are what steer moisture into the Southwest or keep it locked south of the border.
The right-hand panel repeats all of this as a departure from the 1991–2025 average for that calendar day: teal/green means wetter than normal, brown means drier, and the hotpink/steelblue contours mark where the 500 hPa ridge sat anomalously higher or lower than usual.
This diagram compresses the entire season into a single image. Each vertical slice is one day; color shows how much moisture (TCWV) was present at each latitude within the Gulf of California corridor (115–105°W) that day. The black contour traces this year’s edge of monsoon-relevant moisture — the 25 kg/m² threshold — while the dashed line shows where that edge sits in a typical year. Where the observed line pushes north of the dashed line, moisture arrived earlier or reached farther than normal; where it lags behind, onset was late or retreat was early. The lower panel shows the same thing as a direct departure from normal, in kg/m², so wet and dry stretches of the season stand out at a glance. See Methods for how the corridor and threshold lines are defined.

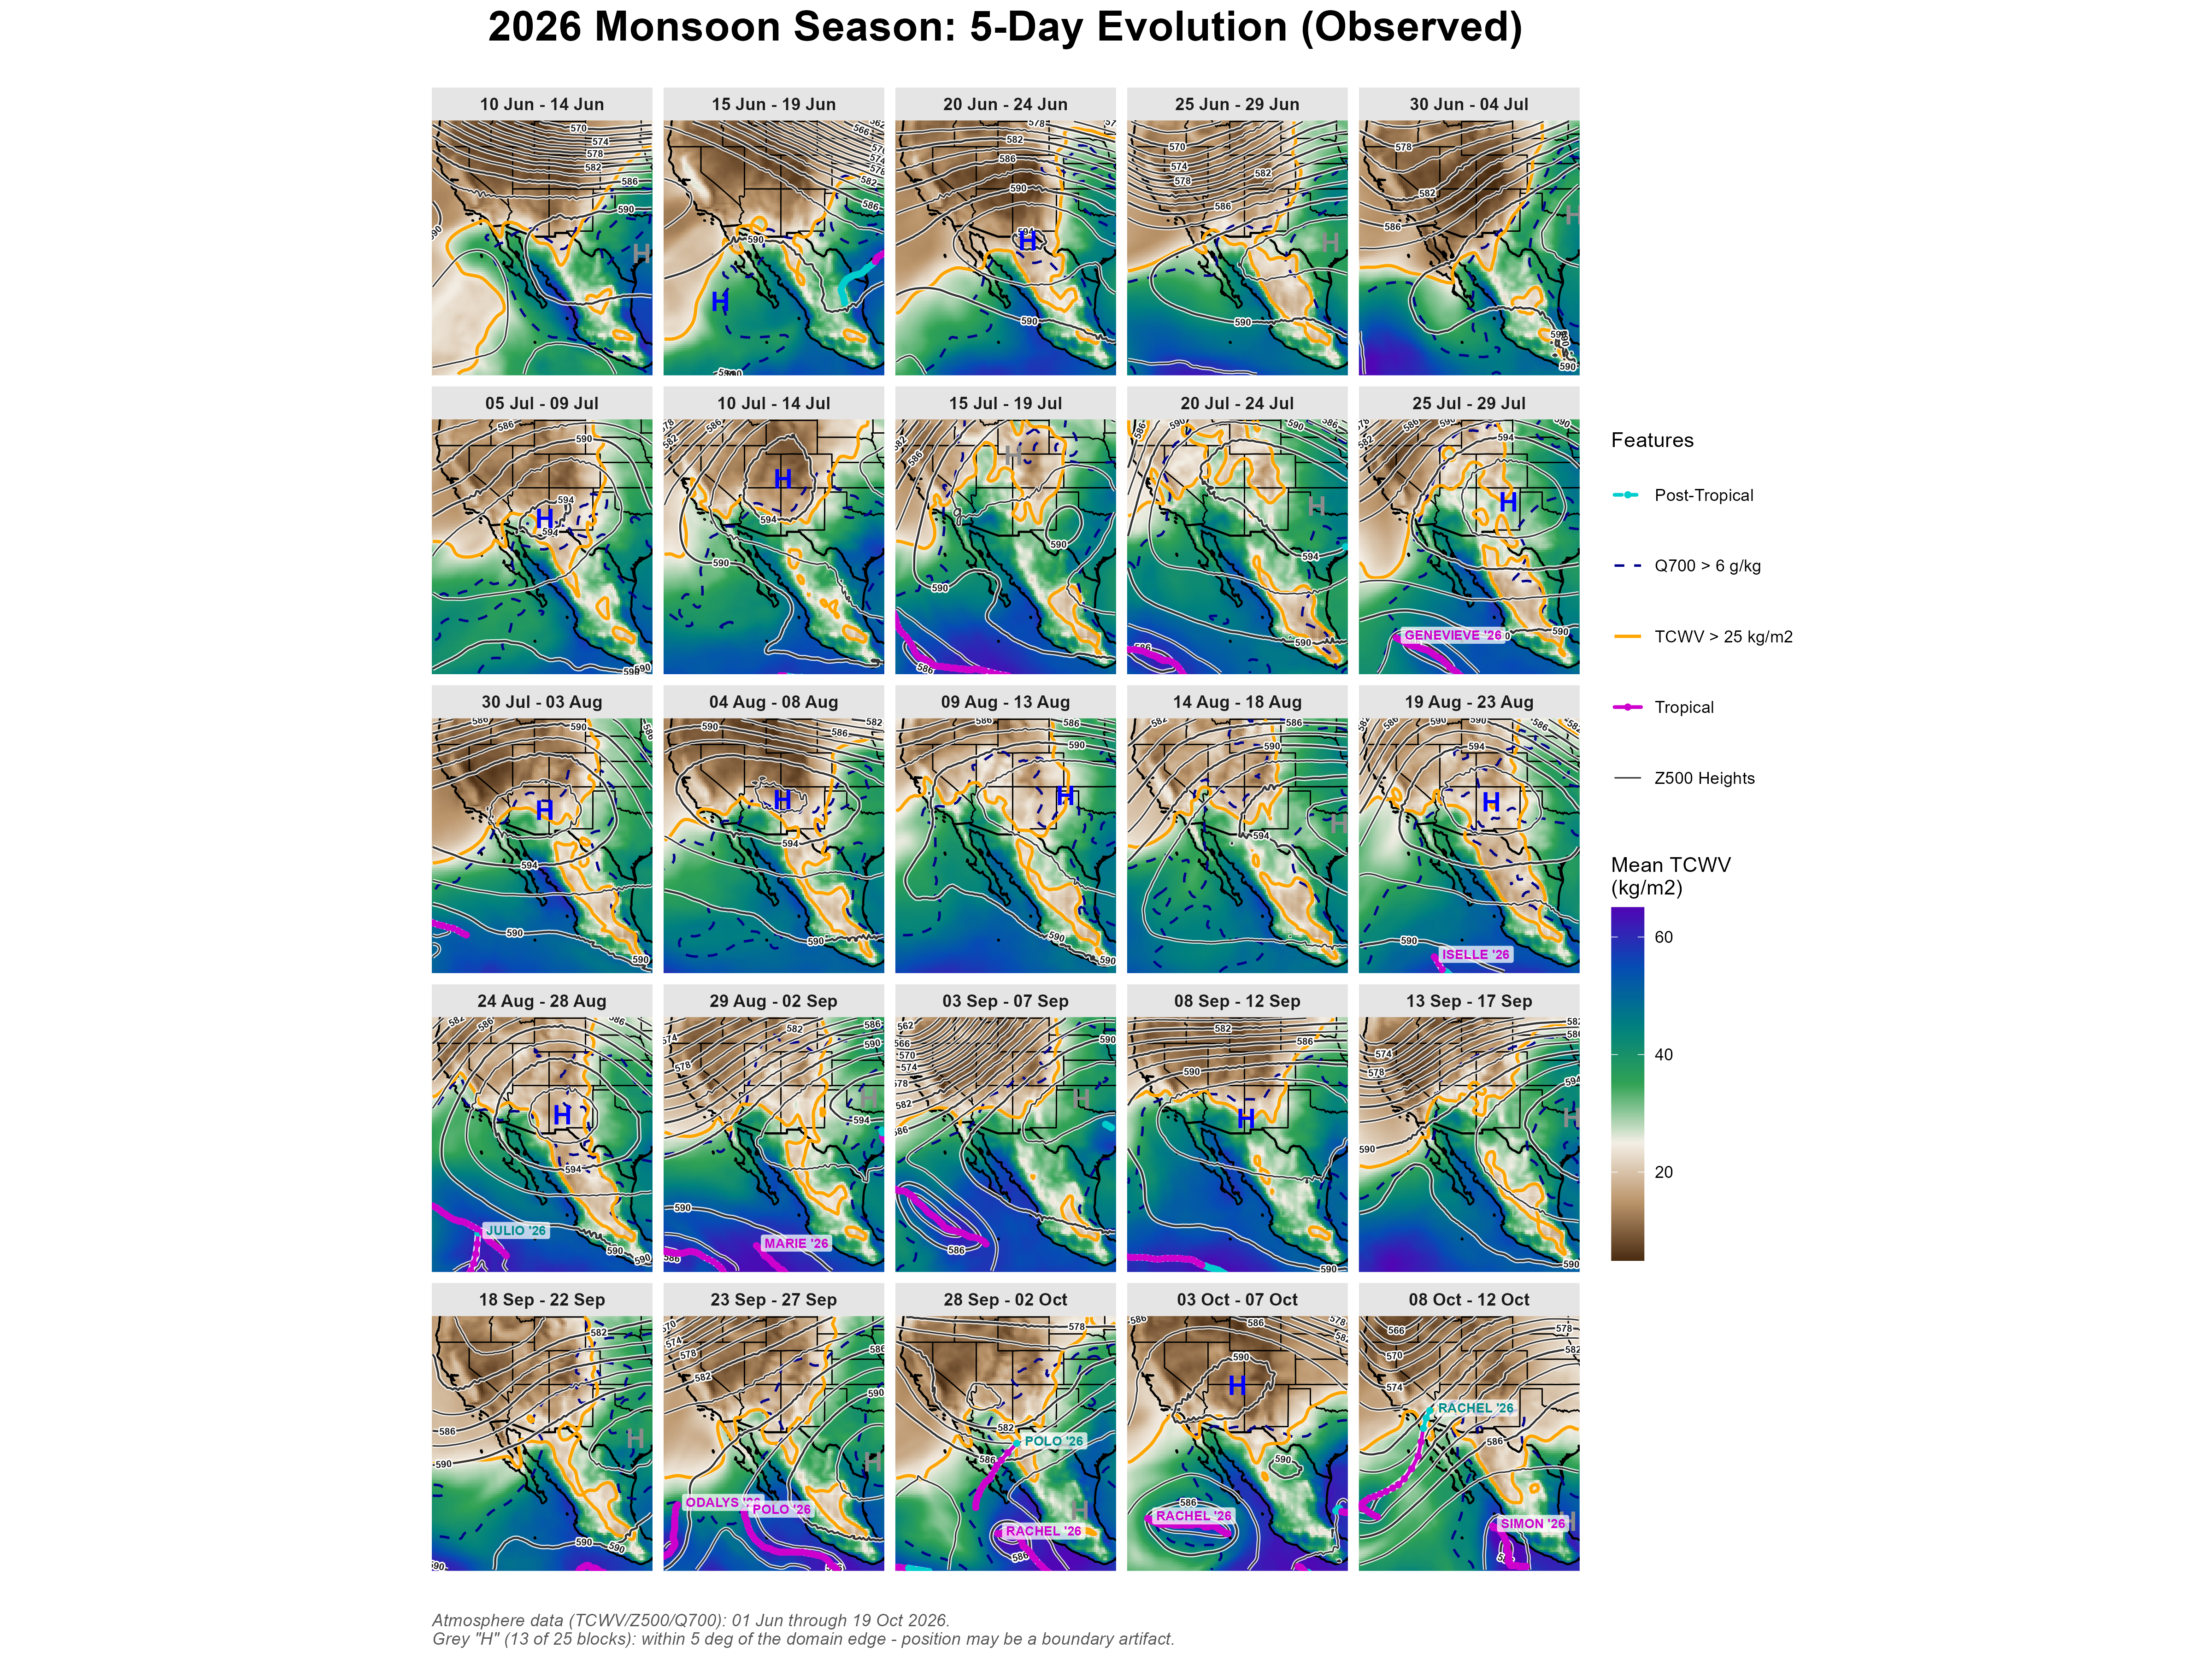
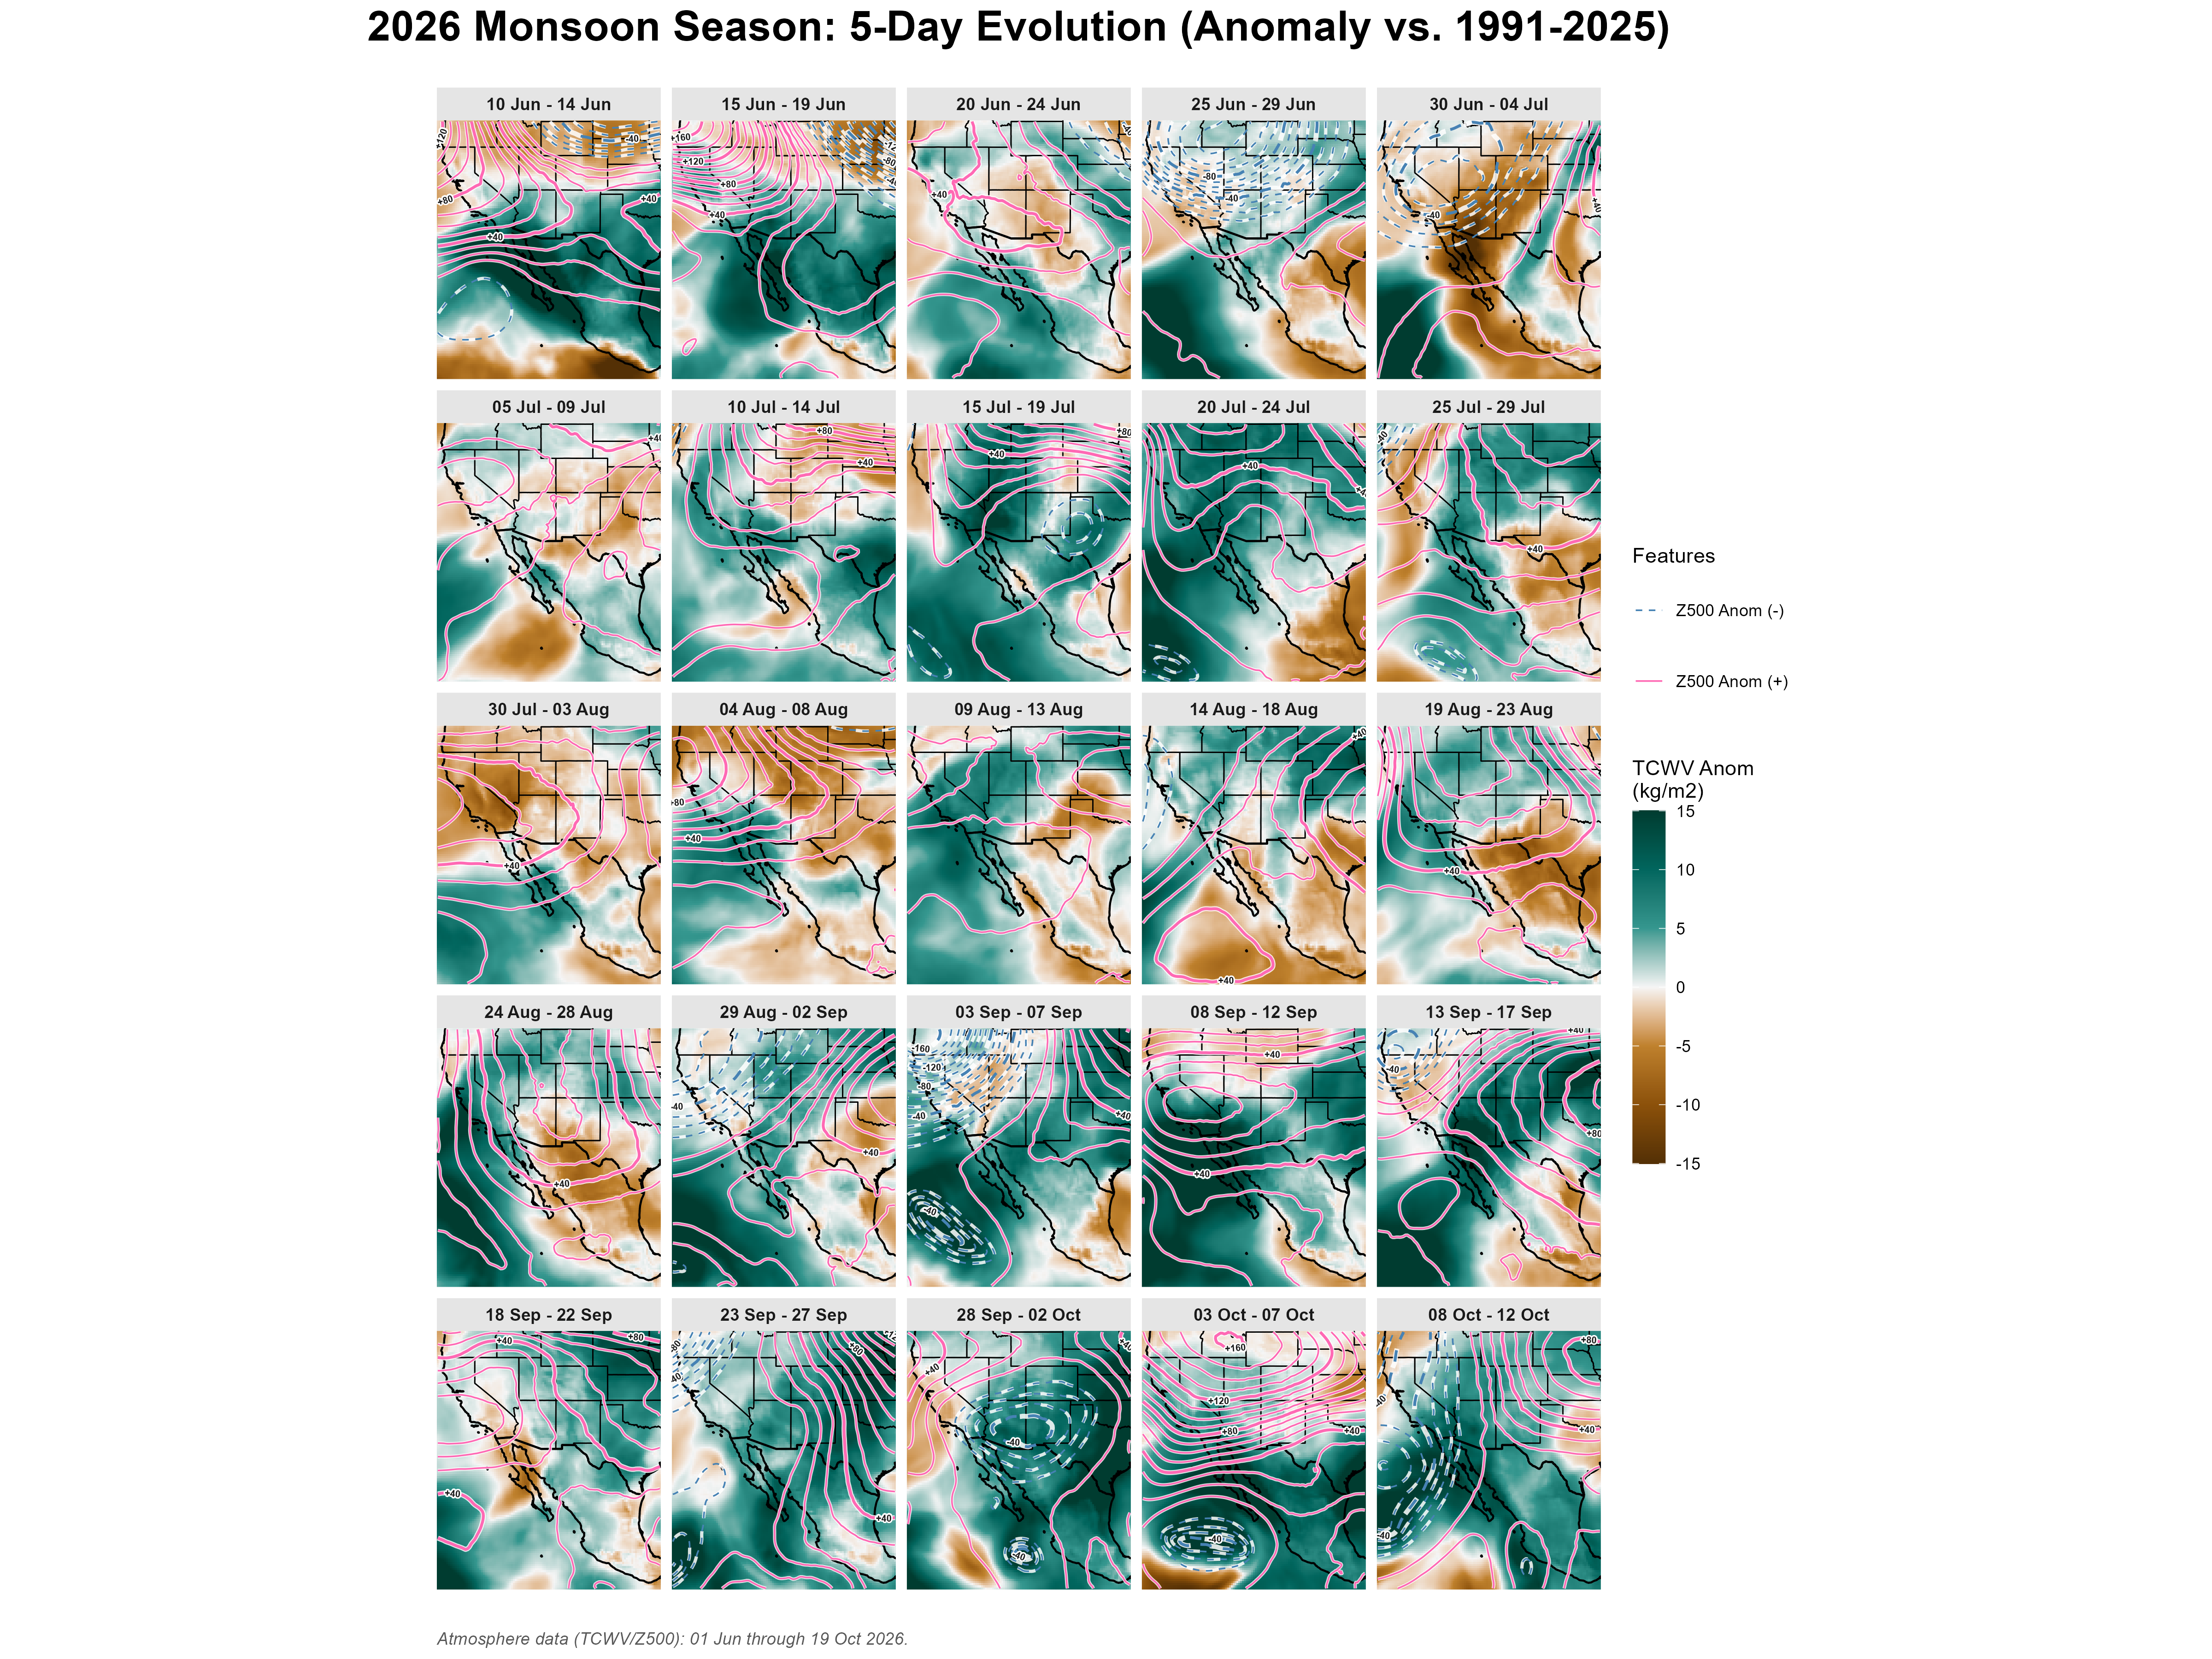
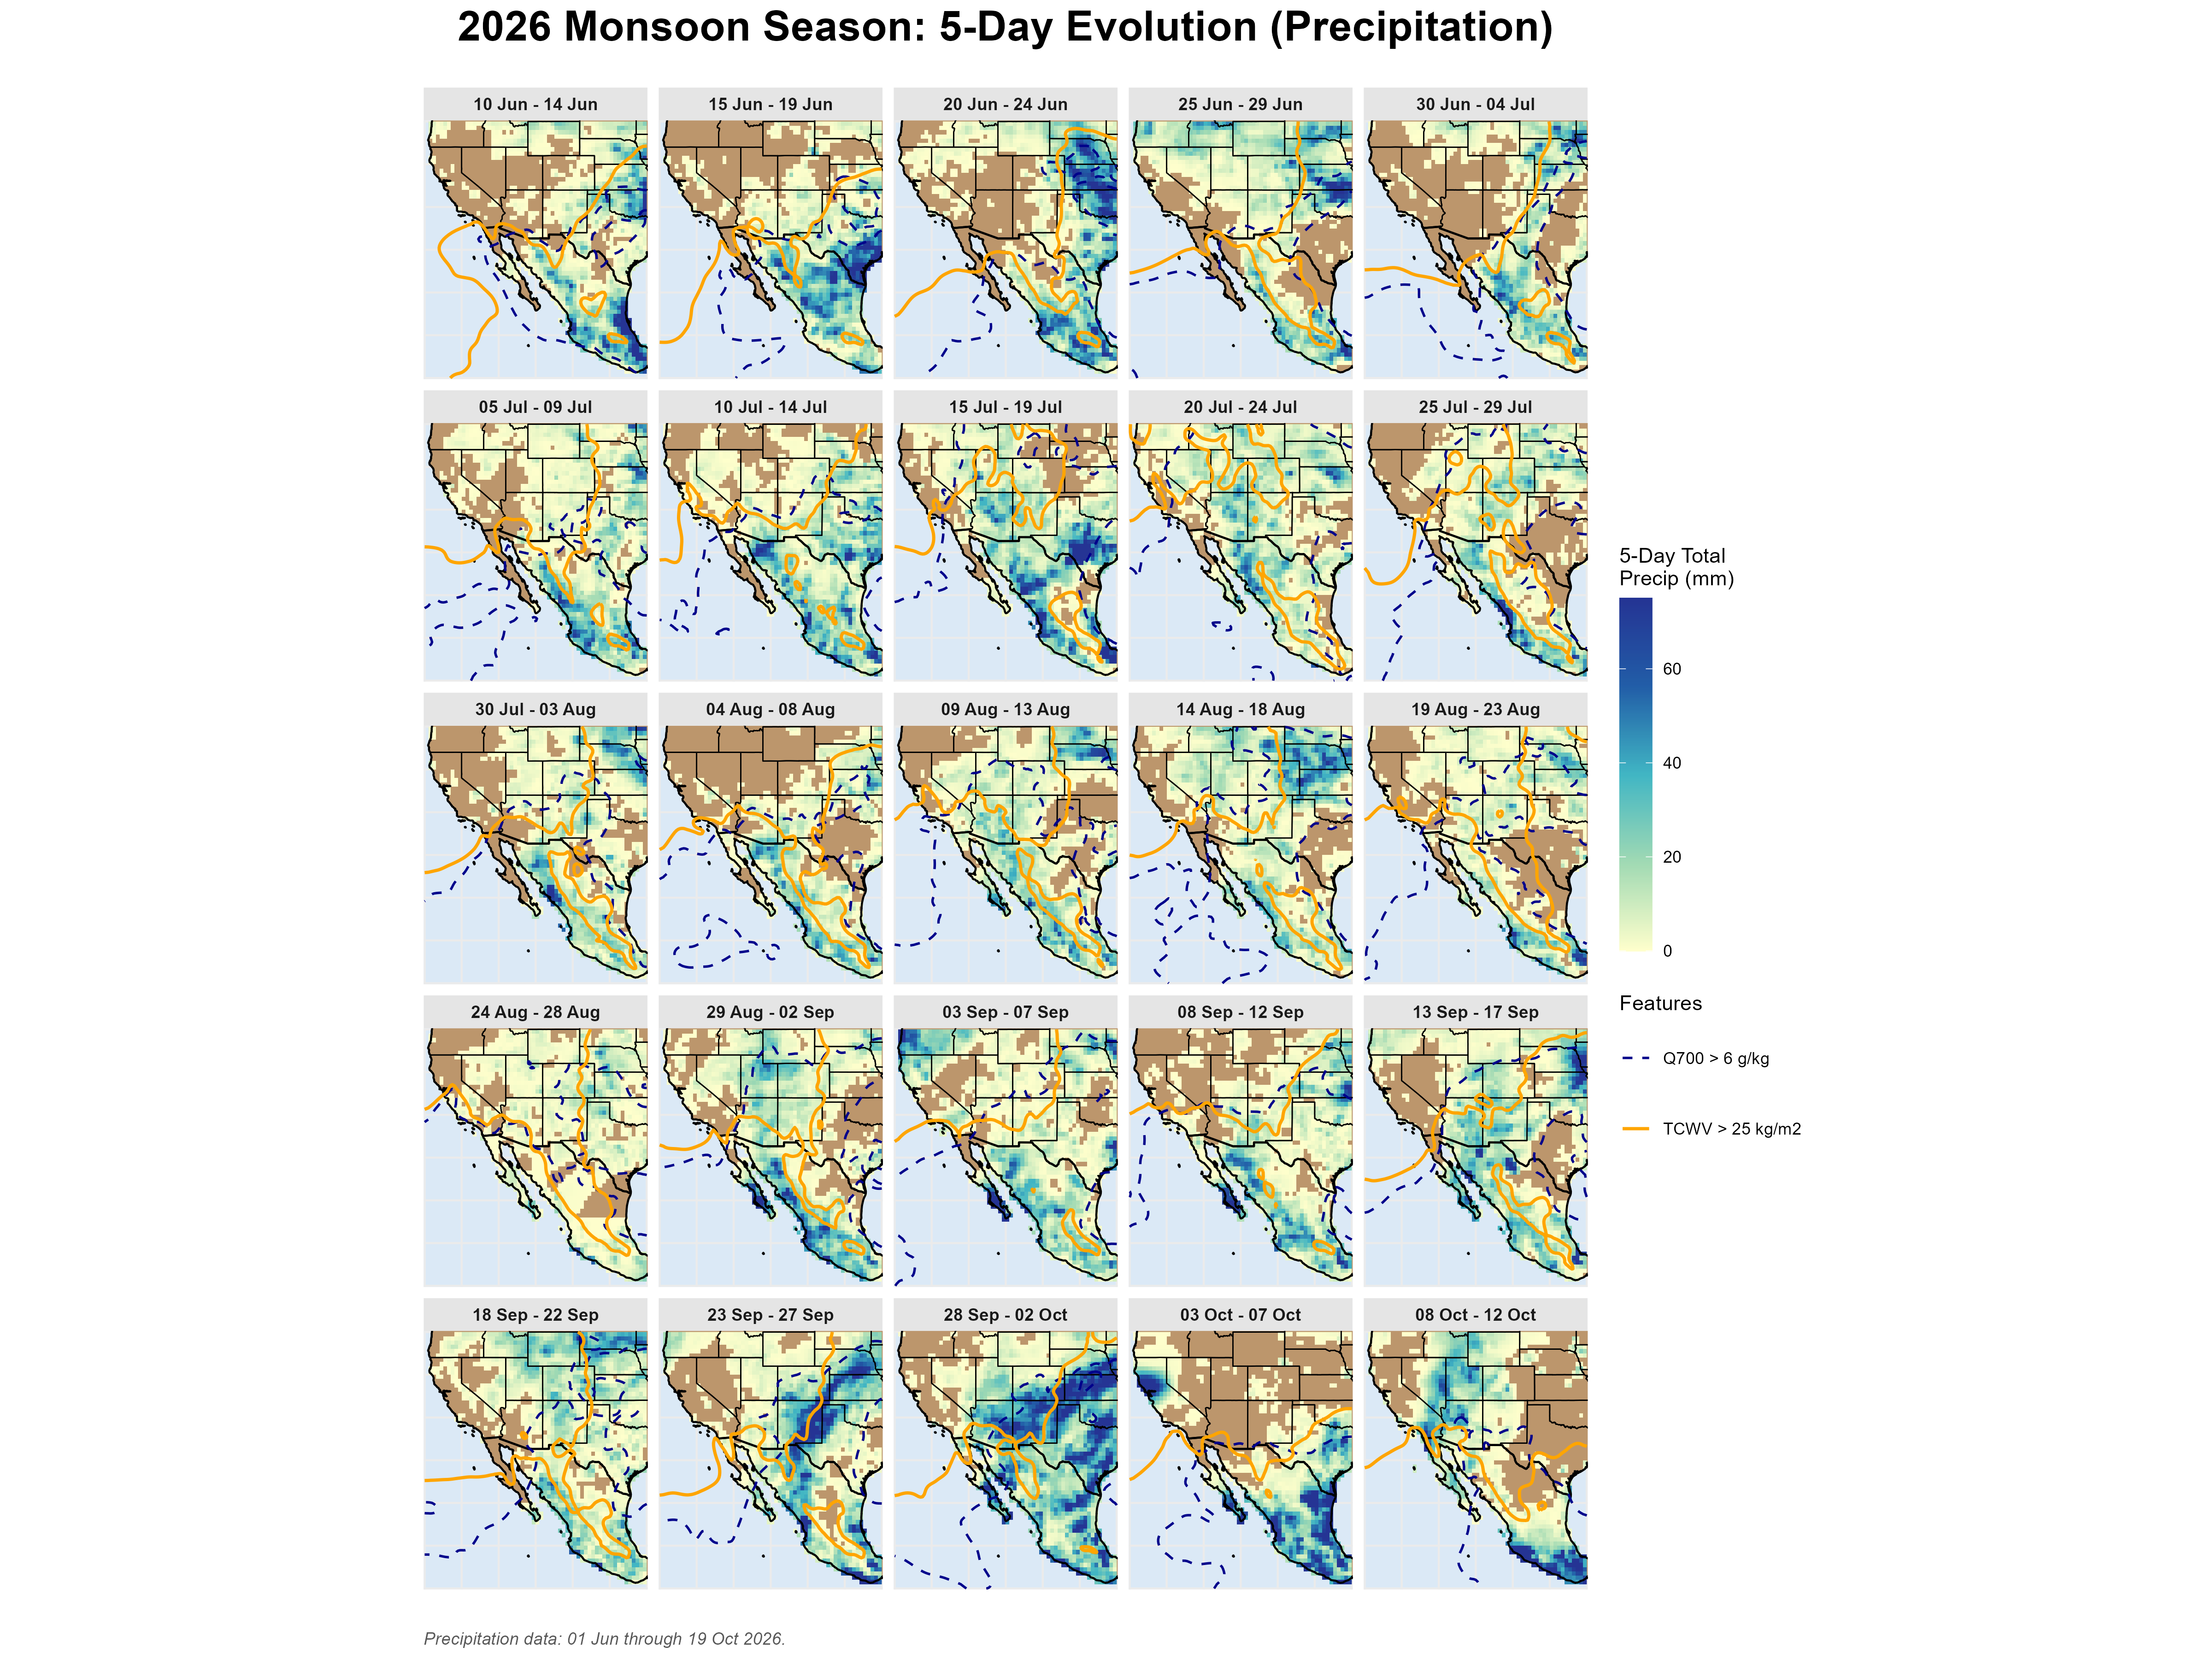
The season compressed into 25 five-day blocks running June 10–October 12 — the same blocking used in the 1991–2025 climatology grid, so this year can be compared panel-for-panel against normal. Each panel shows that block’s mean TCWV, 500 hPa height contours, and the tracked ridge position (“H”). See Methods for how the blocks are built.
Absolute
The actual 5-day mean state at each stage of the season — moisture, ridge position, and height contours as observed.
Anomaly
The same 5-day blocks shown as a true pixel-level departure from the 1991–2025 baseline — wet (teal) and dry (brown) stretches, and whether the ridge sat higher (hotpink) or lower (steelblue) than normal, block by block.
Precipitation
Actual 5-day rainfall totals from NOAA CPC’s gauge-based daily precipitation analysis, with the same TCWV and Q700 moisture isolines from the Absolute grid overlaid — so you can see how much of each block’s atmospheric moisture actually came down as rain, and where.
Precipitation Anomaly
The same 5-day blocks shown as each block’s total rainfall minus the 1991–2025 precipitation climatology — teal for wetter than normal, brown for drier — independent of how much rain fell in absolute terms.

The 2026 season compressed into one report card: the mean atmospheric state and total precipitation, alongside each field’s anomaly vs. the 1991–2025 baseline. The precipitation panels use NOAA CPC’s gauge-based daily precipitation analysis, so realized rainfall can be compared directly against the atmospheric moisture and ridge position above. See Methods for how each panel is built.

Ridge Position
Where the ridge sat, day by day. Every daily detected 500 hPa height maximum of the 2026 season, colored by month and drawn over the season-mean height field — the same detection that places the “H” on the daily dashboard and the 5-day grids, but shown for the whole season at once, so the month-to-month migration is visible in one view.

Hollow markers sit within 5° of the edge of the analysis domain, where the detector cannot see far enough around a center to confirm it is closed. Those positions may be set by where the archive stops rather than by the atmosphere — in some seasons they are most of the days.
The monthly means (diamonds) are a rough guide only. The largest height maximum in the domain is not always the same weather system, so a monthly average can blend the monsoon ridge with the subtropical ridge over Texas or the eastern Pacific high, and land between them at a spot where no ridge actually sat.
The label is deliberate: these are detected height maxima, which is what the algorithm returns. On most days that is the monsoon ridge. Not on all of them.