Arizona Summer Monsoon Season Precipitation Mapping
Updated: 06-28-2026
The maps below are focused on capturing unique elements of the summer monsoon season across Arizona including total precipitation, intensity, frequency, persistence, and concentration of precipitation events. Maps are updated once a day from June 15 - September 30th using gridded precipitation data (nominally 4km by 4km) provided by the NOAA National Water Prediction Service. The gridded data provide a spatial estimate of true precipitation amounts across the region and should be interpreted with caution at very fine scales. Note that radar coverage is limited across the Four Corners and precipitation amounts will be underestimated across this region. More information on how the gridded data are produced can be found here.
Companion SW Monsoon climate monitoring products:
- Southwest U.S. Monsoon Season Technical Summaries
- Southwest Summer Monsoon Season Precipitation Mapping (PRISM data)
- New Mexico Summer Monsoon Season Precipitation Mapping (NOAA-AHPS data)
Email Mike Crimmins with questions and/or suggestions on how to improve these plots or ideas for additional variables
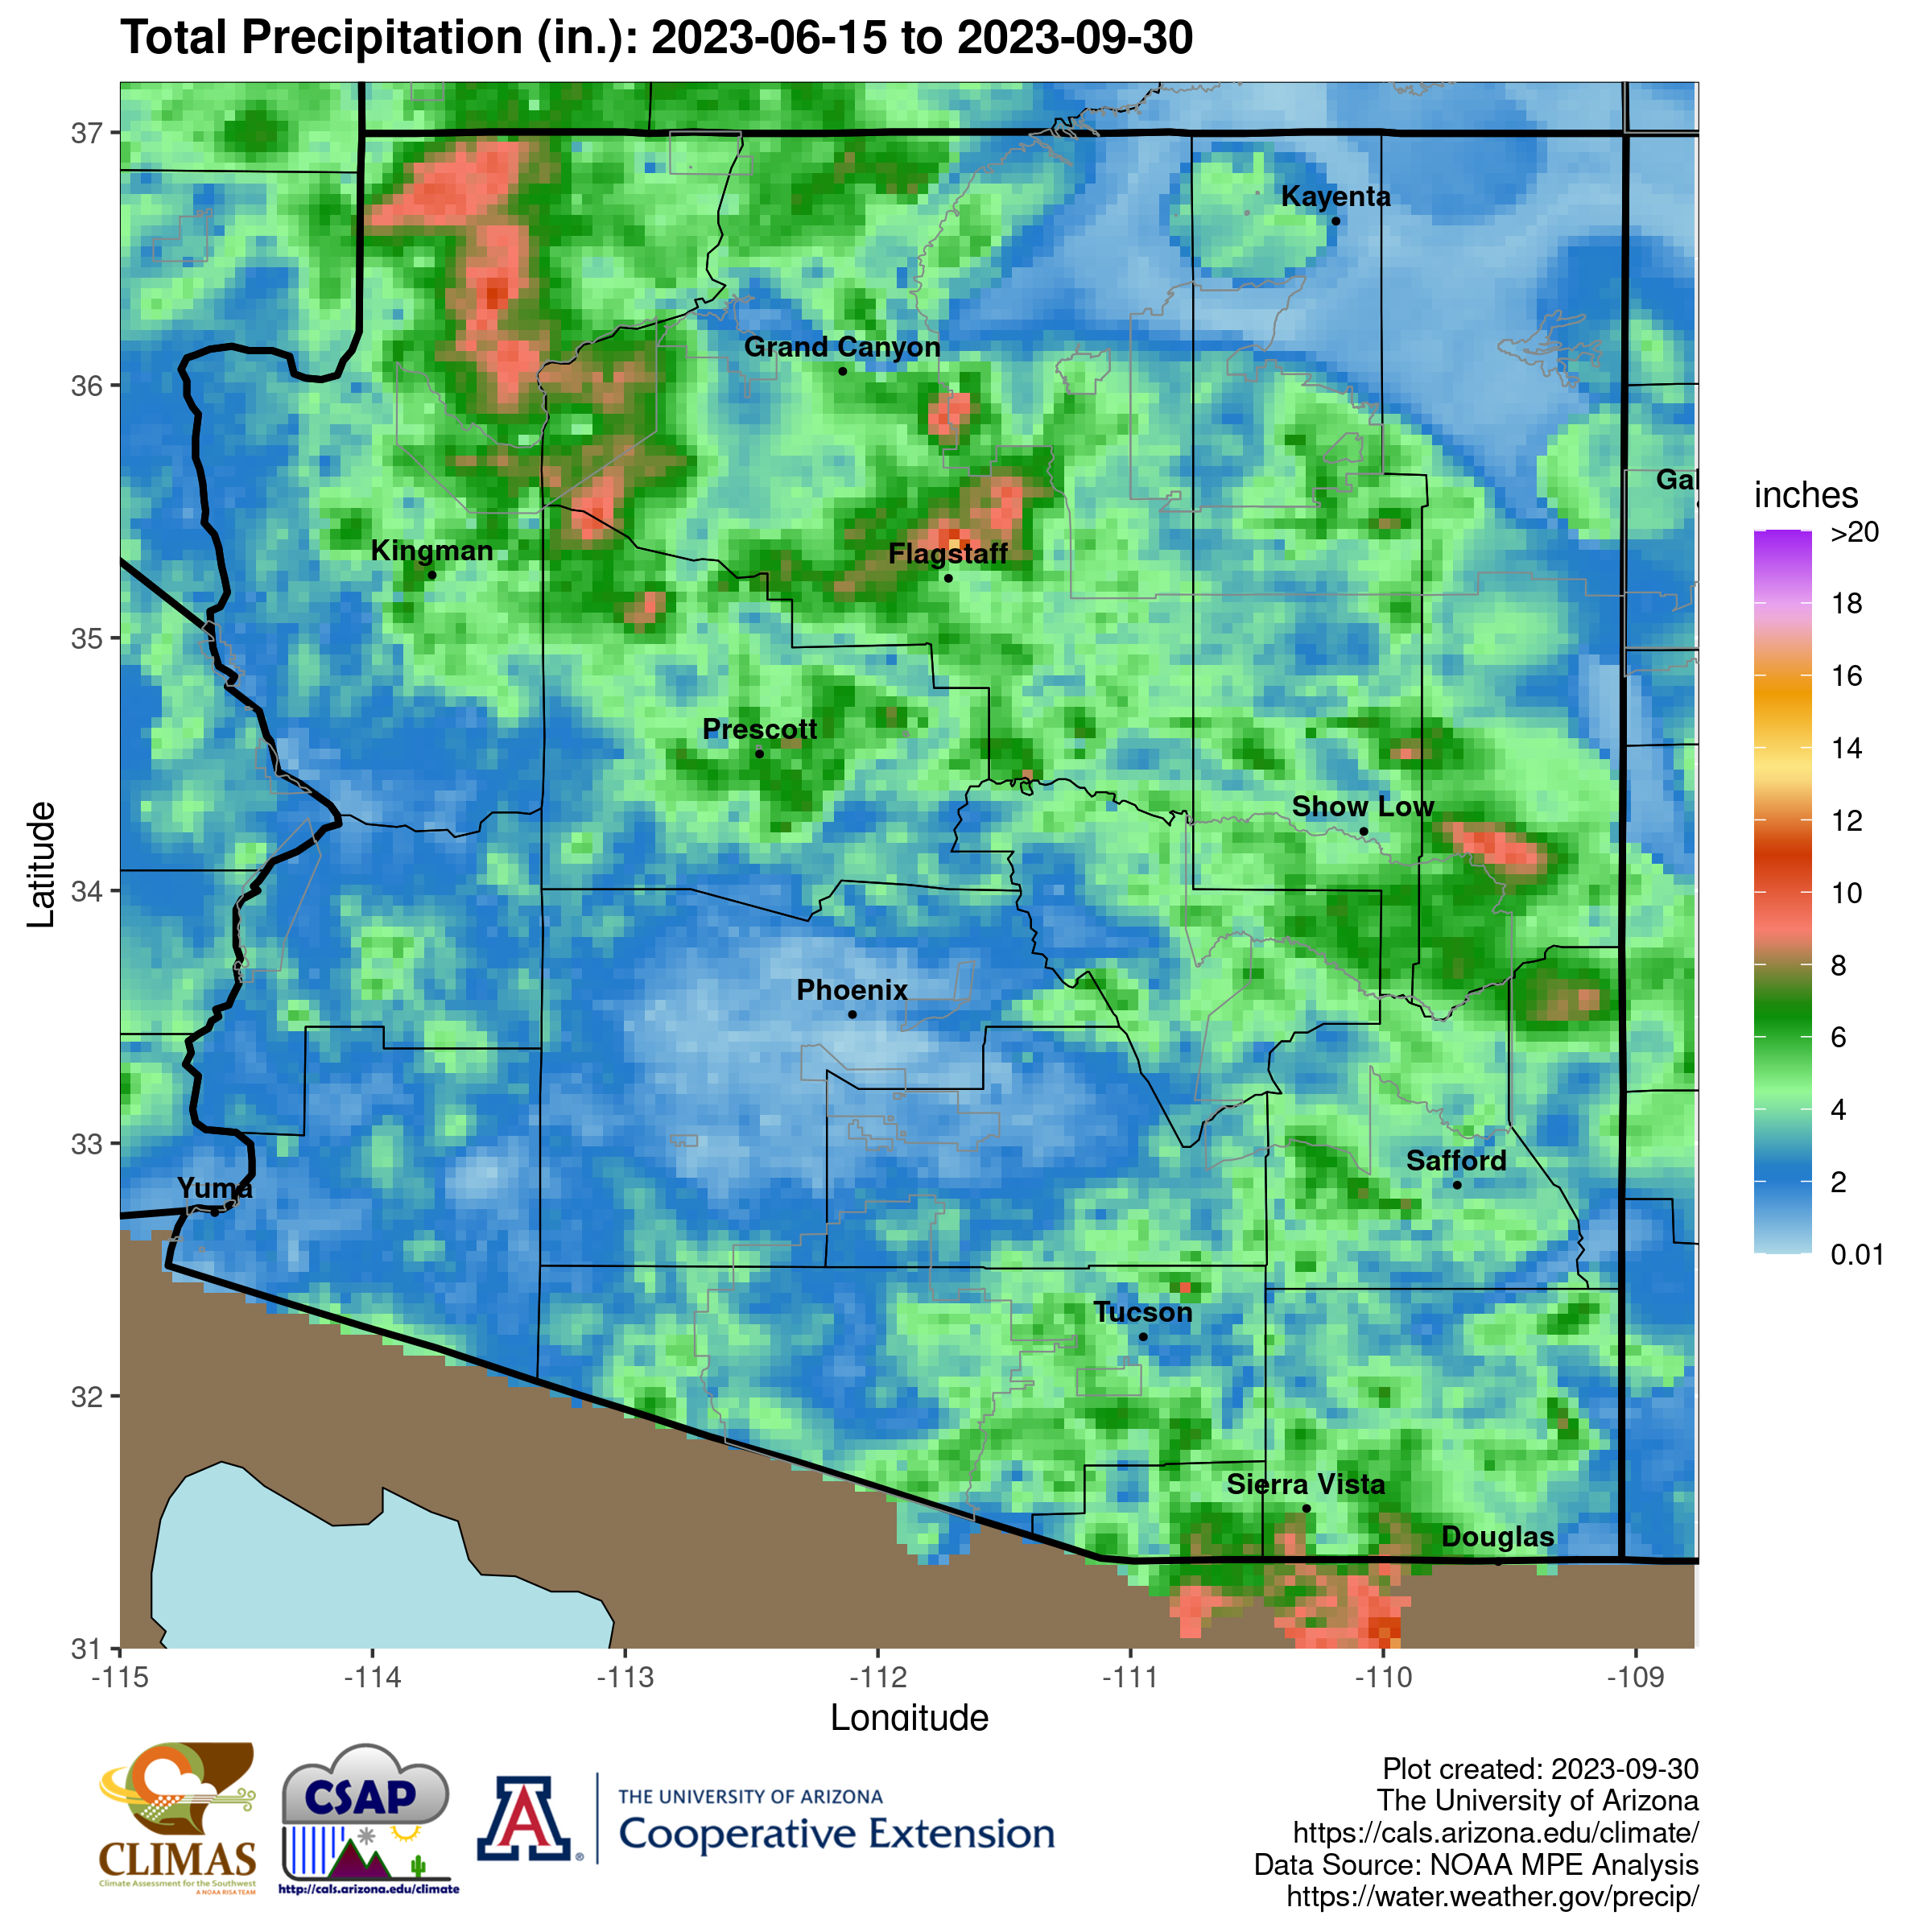
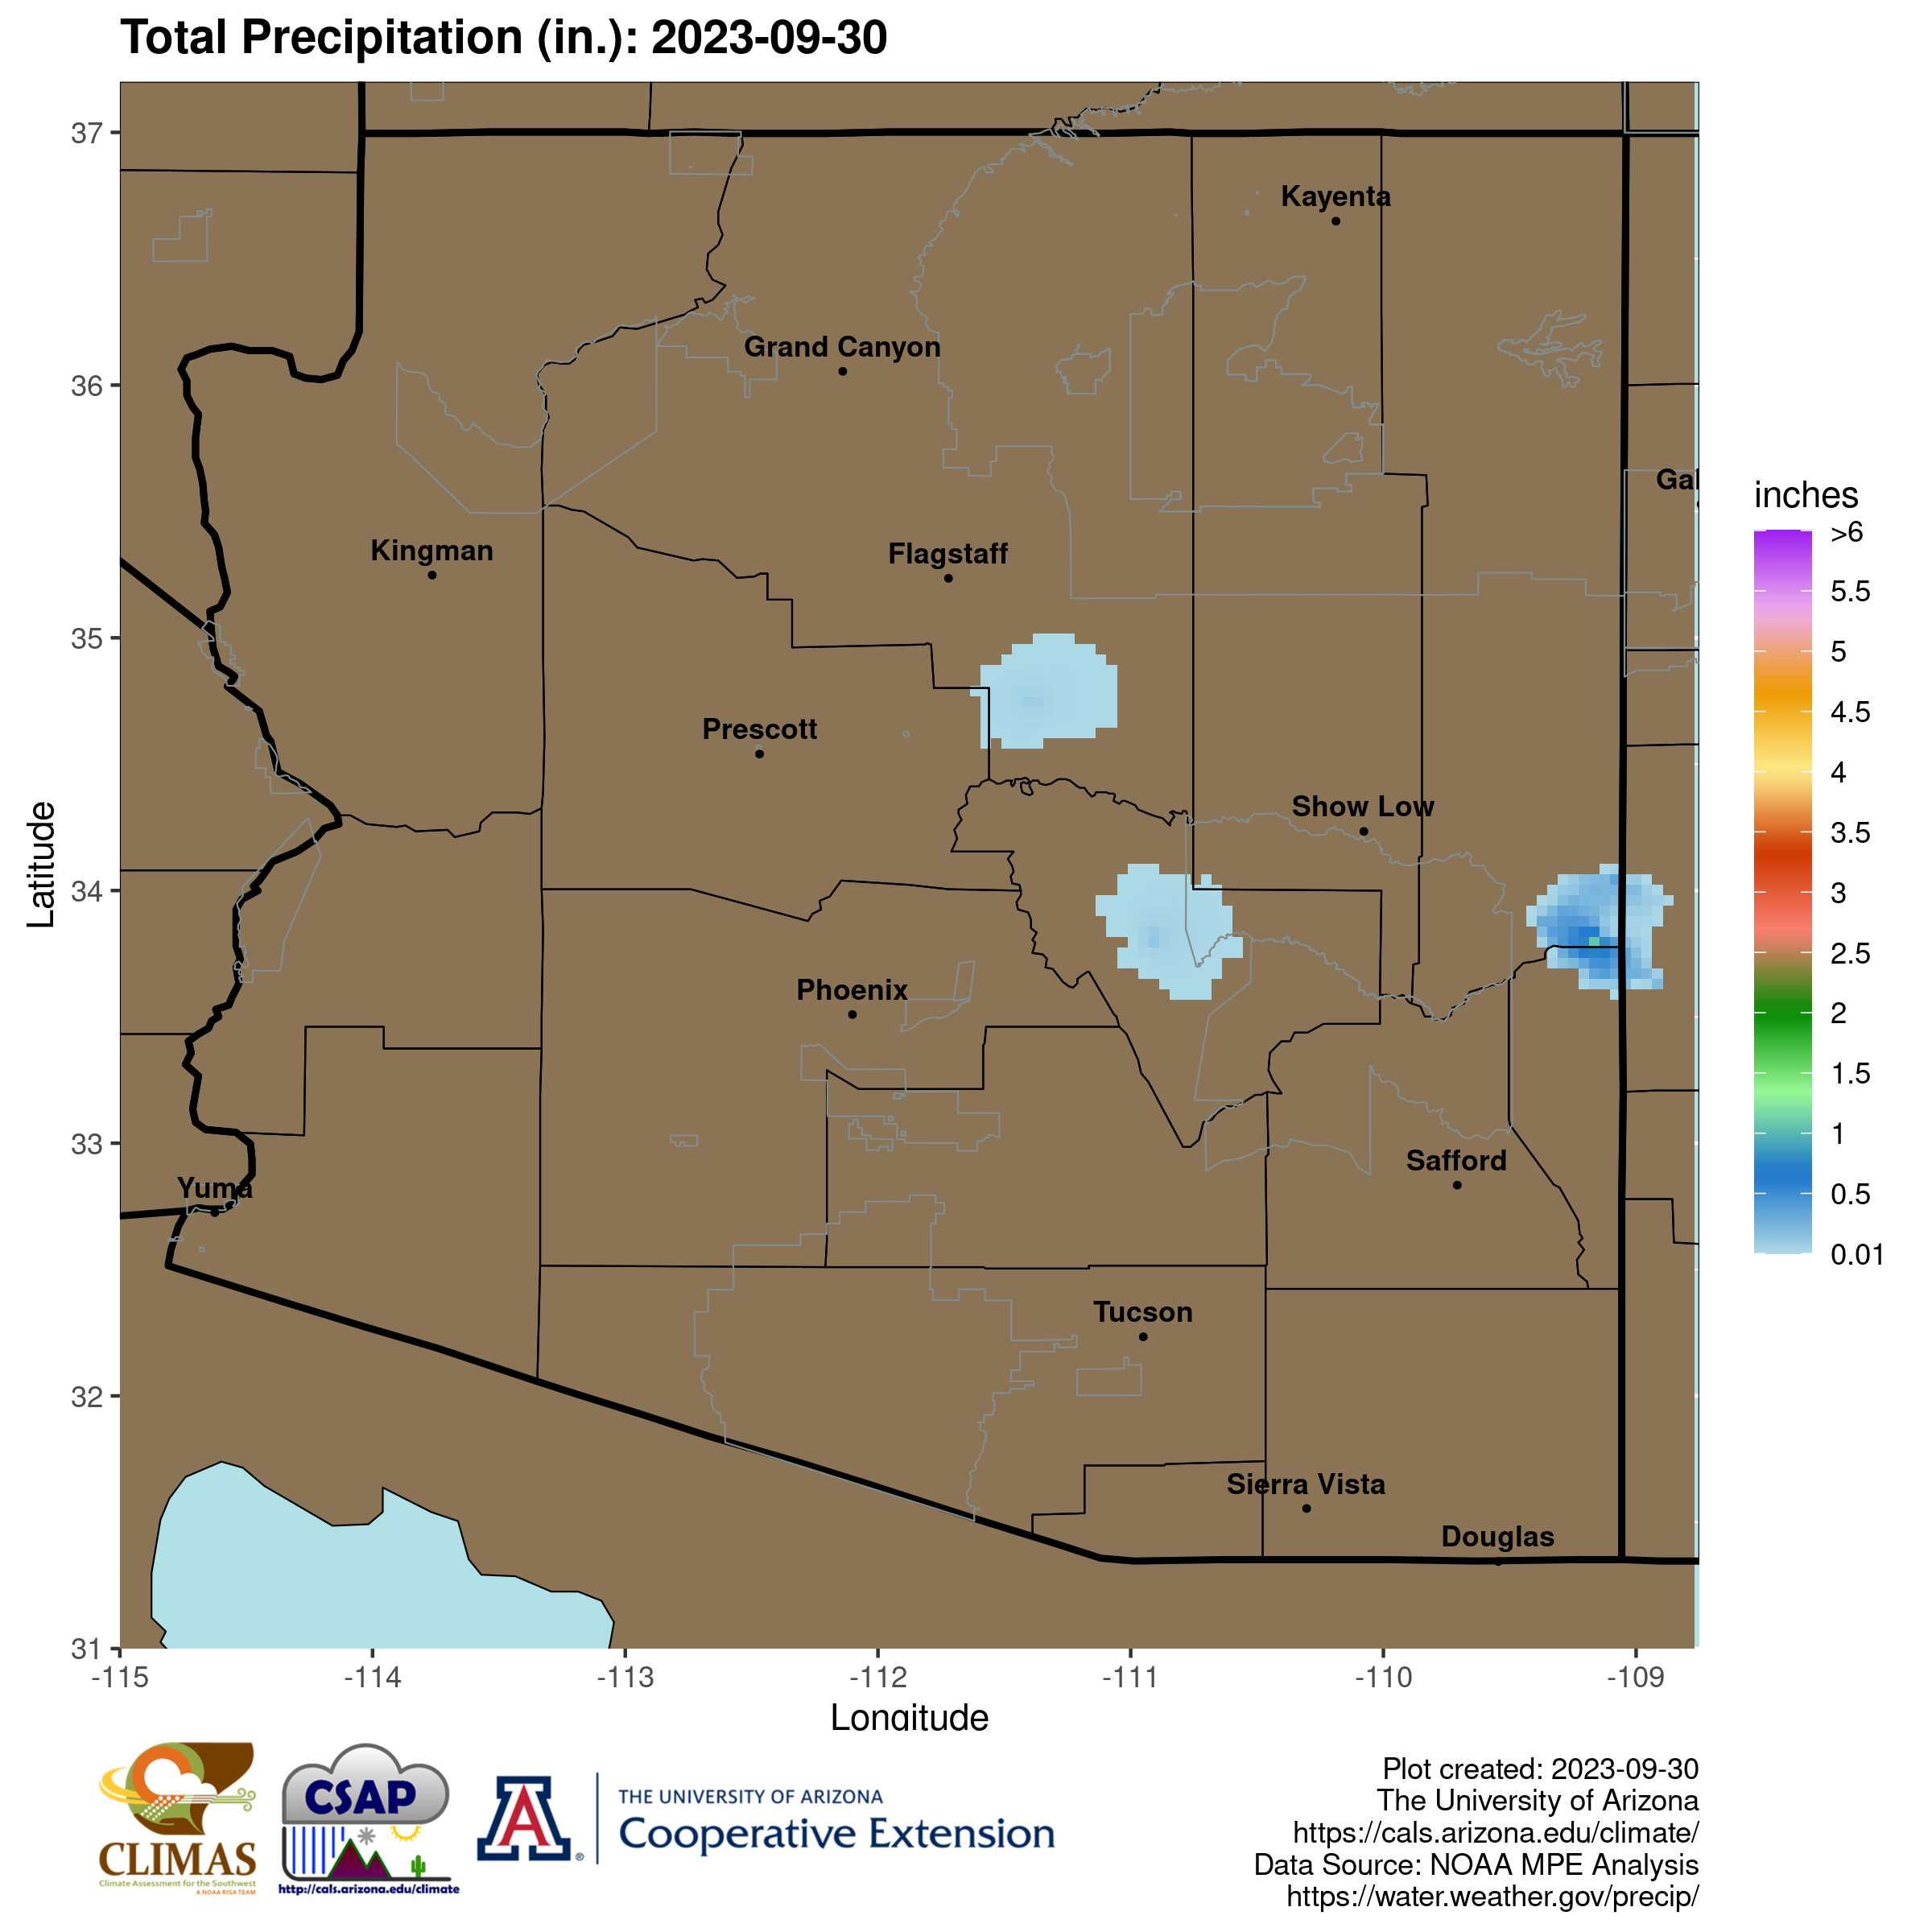
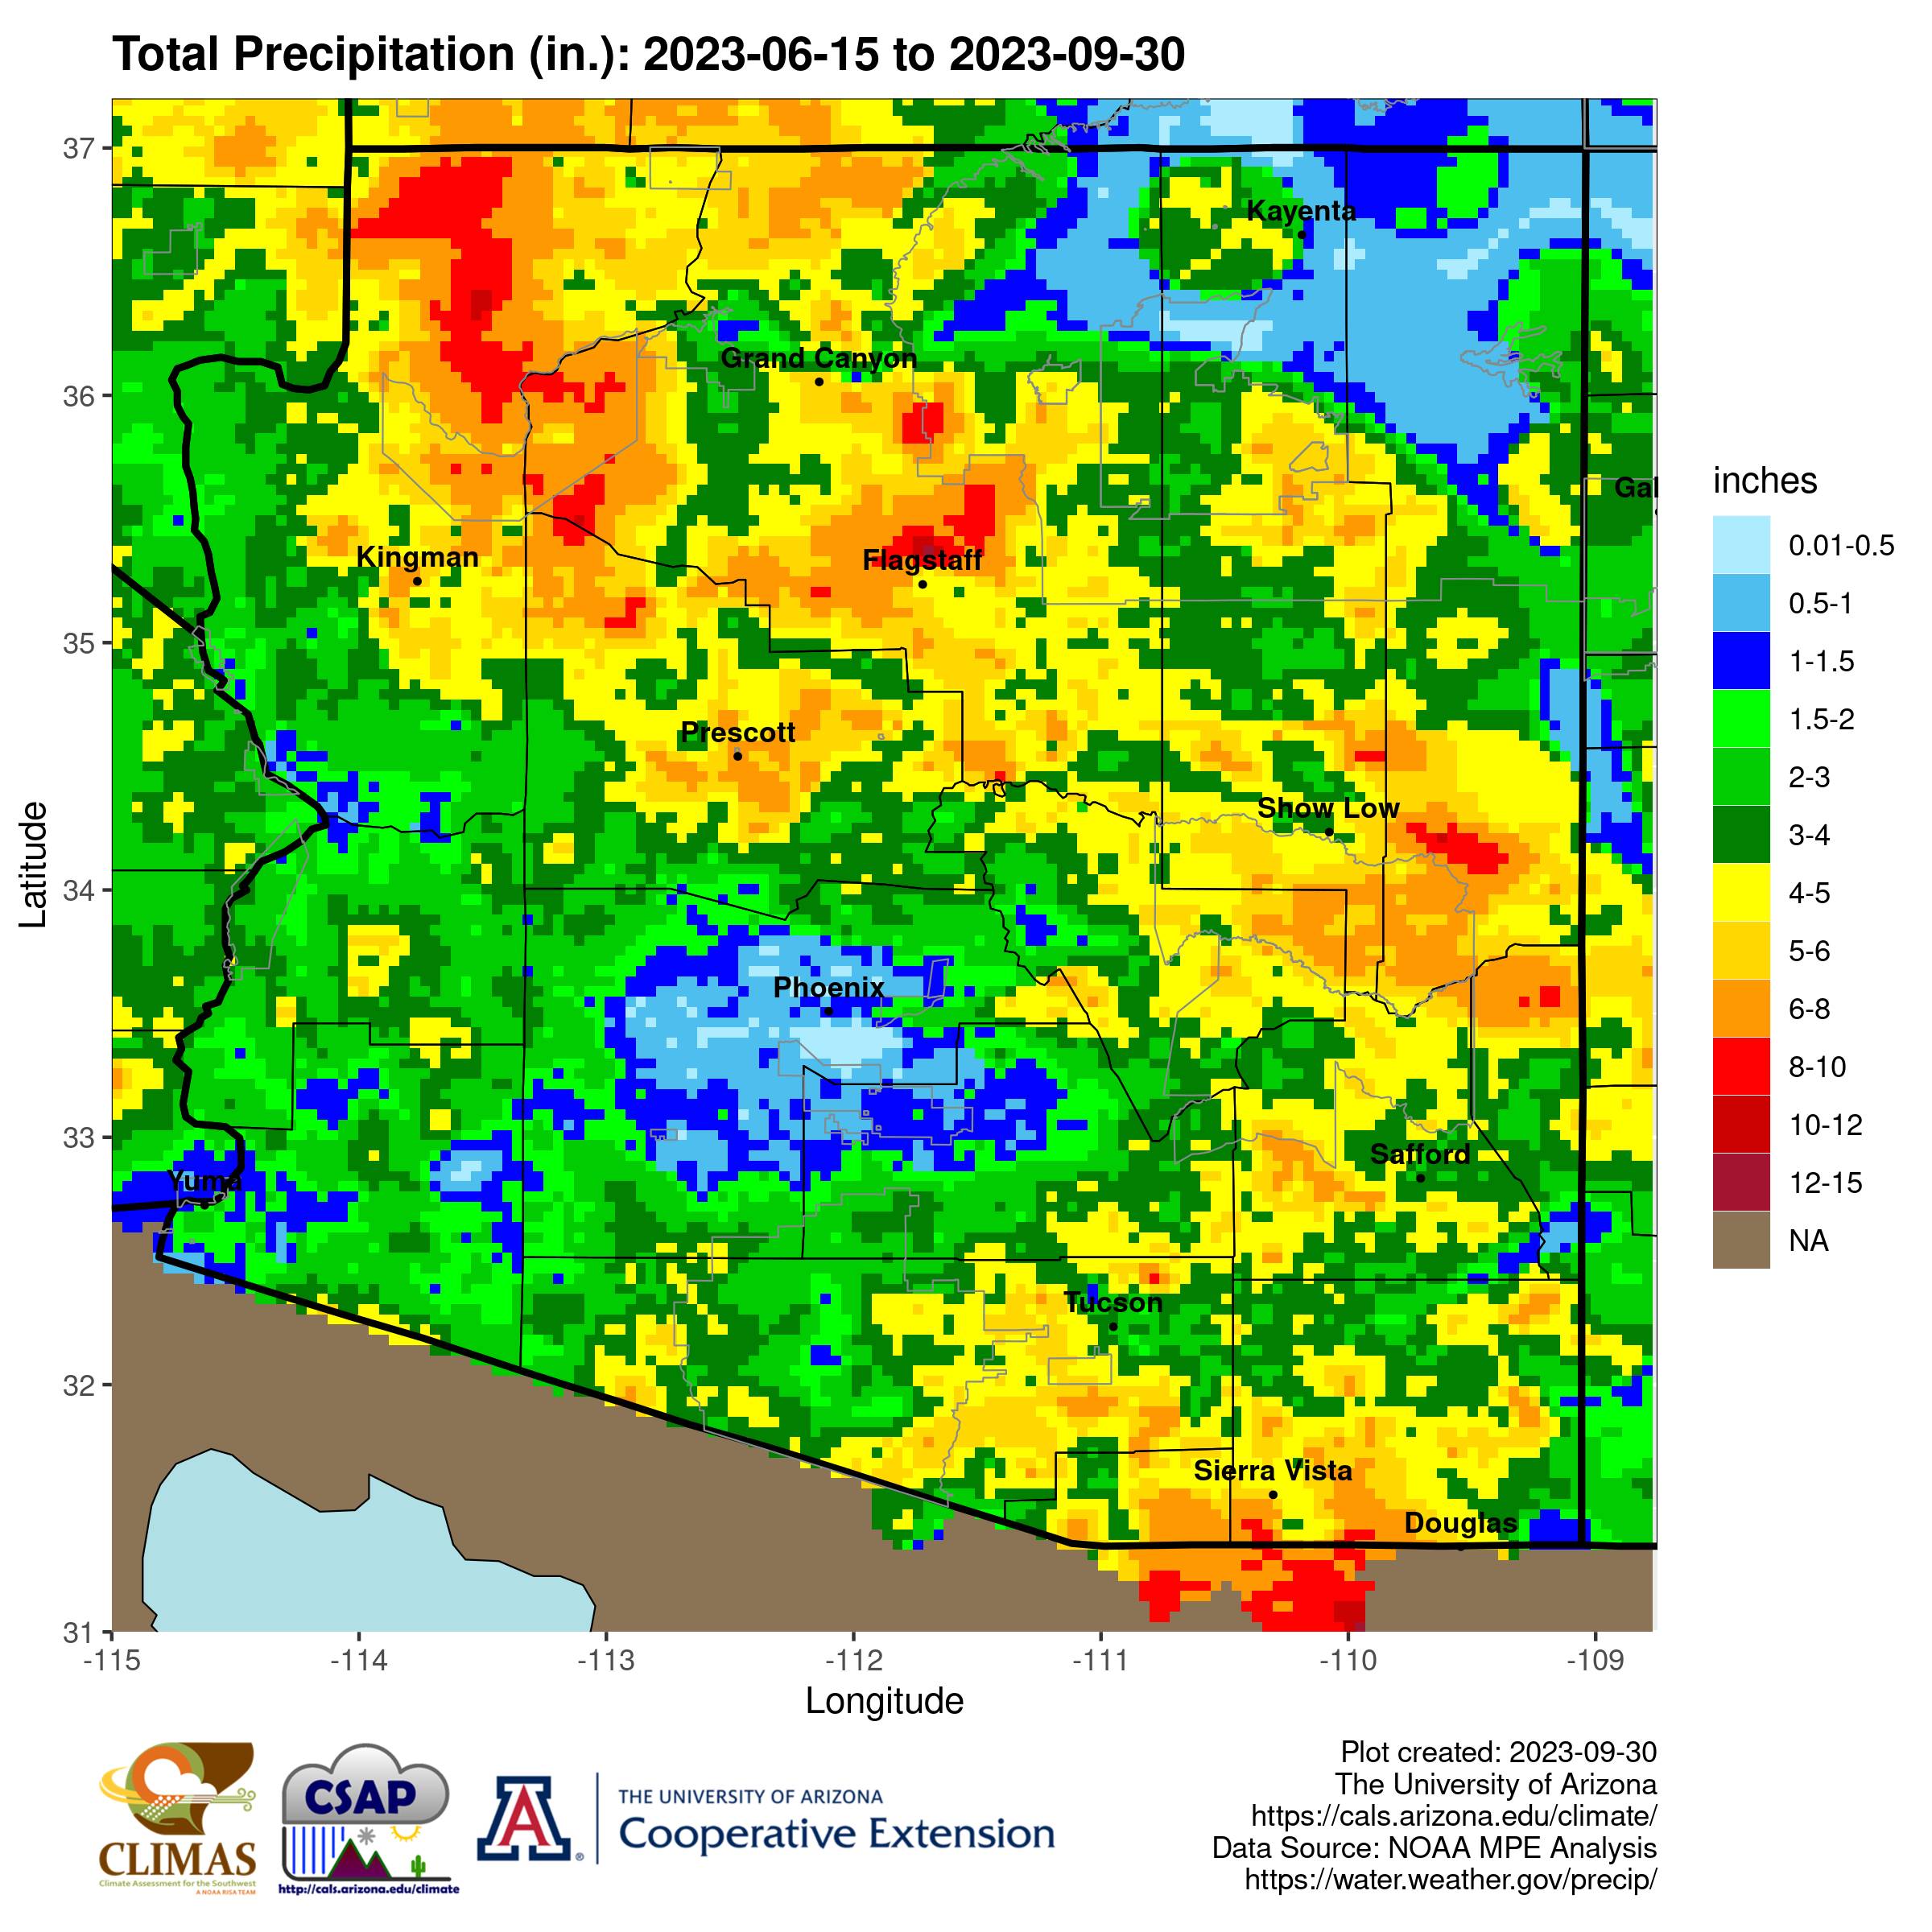
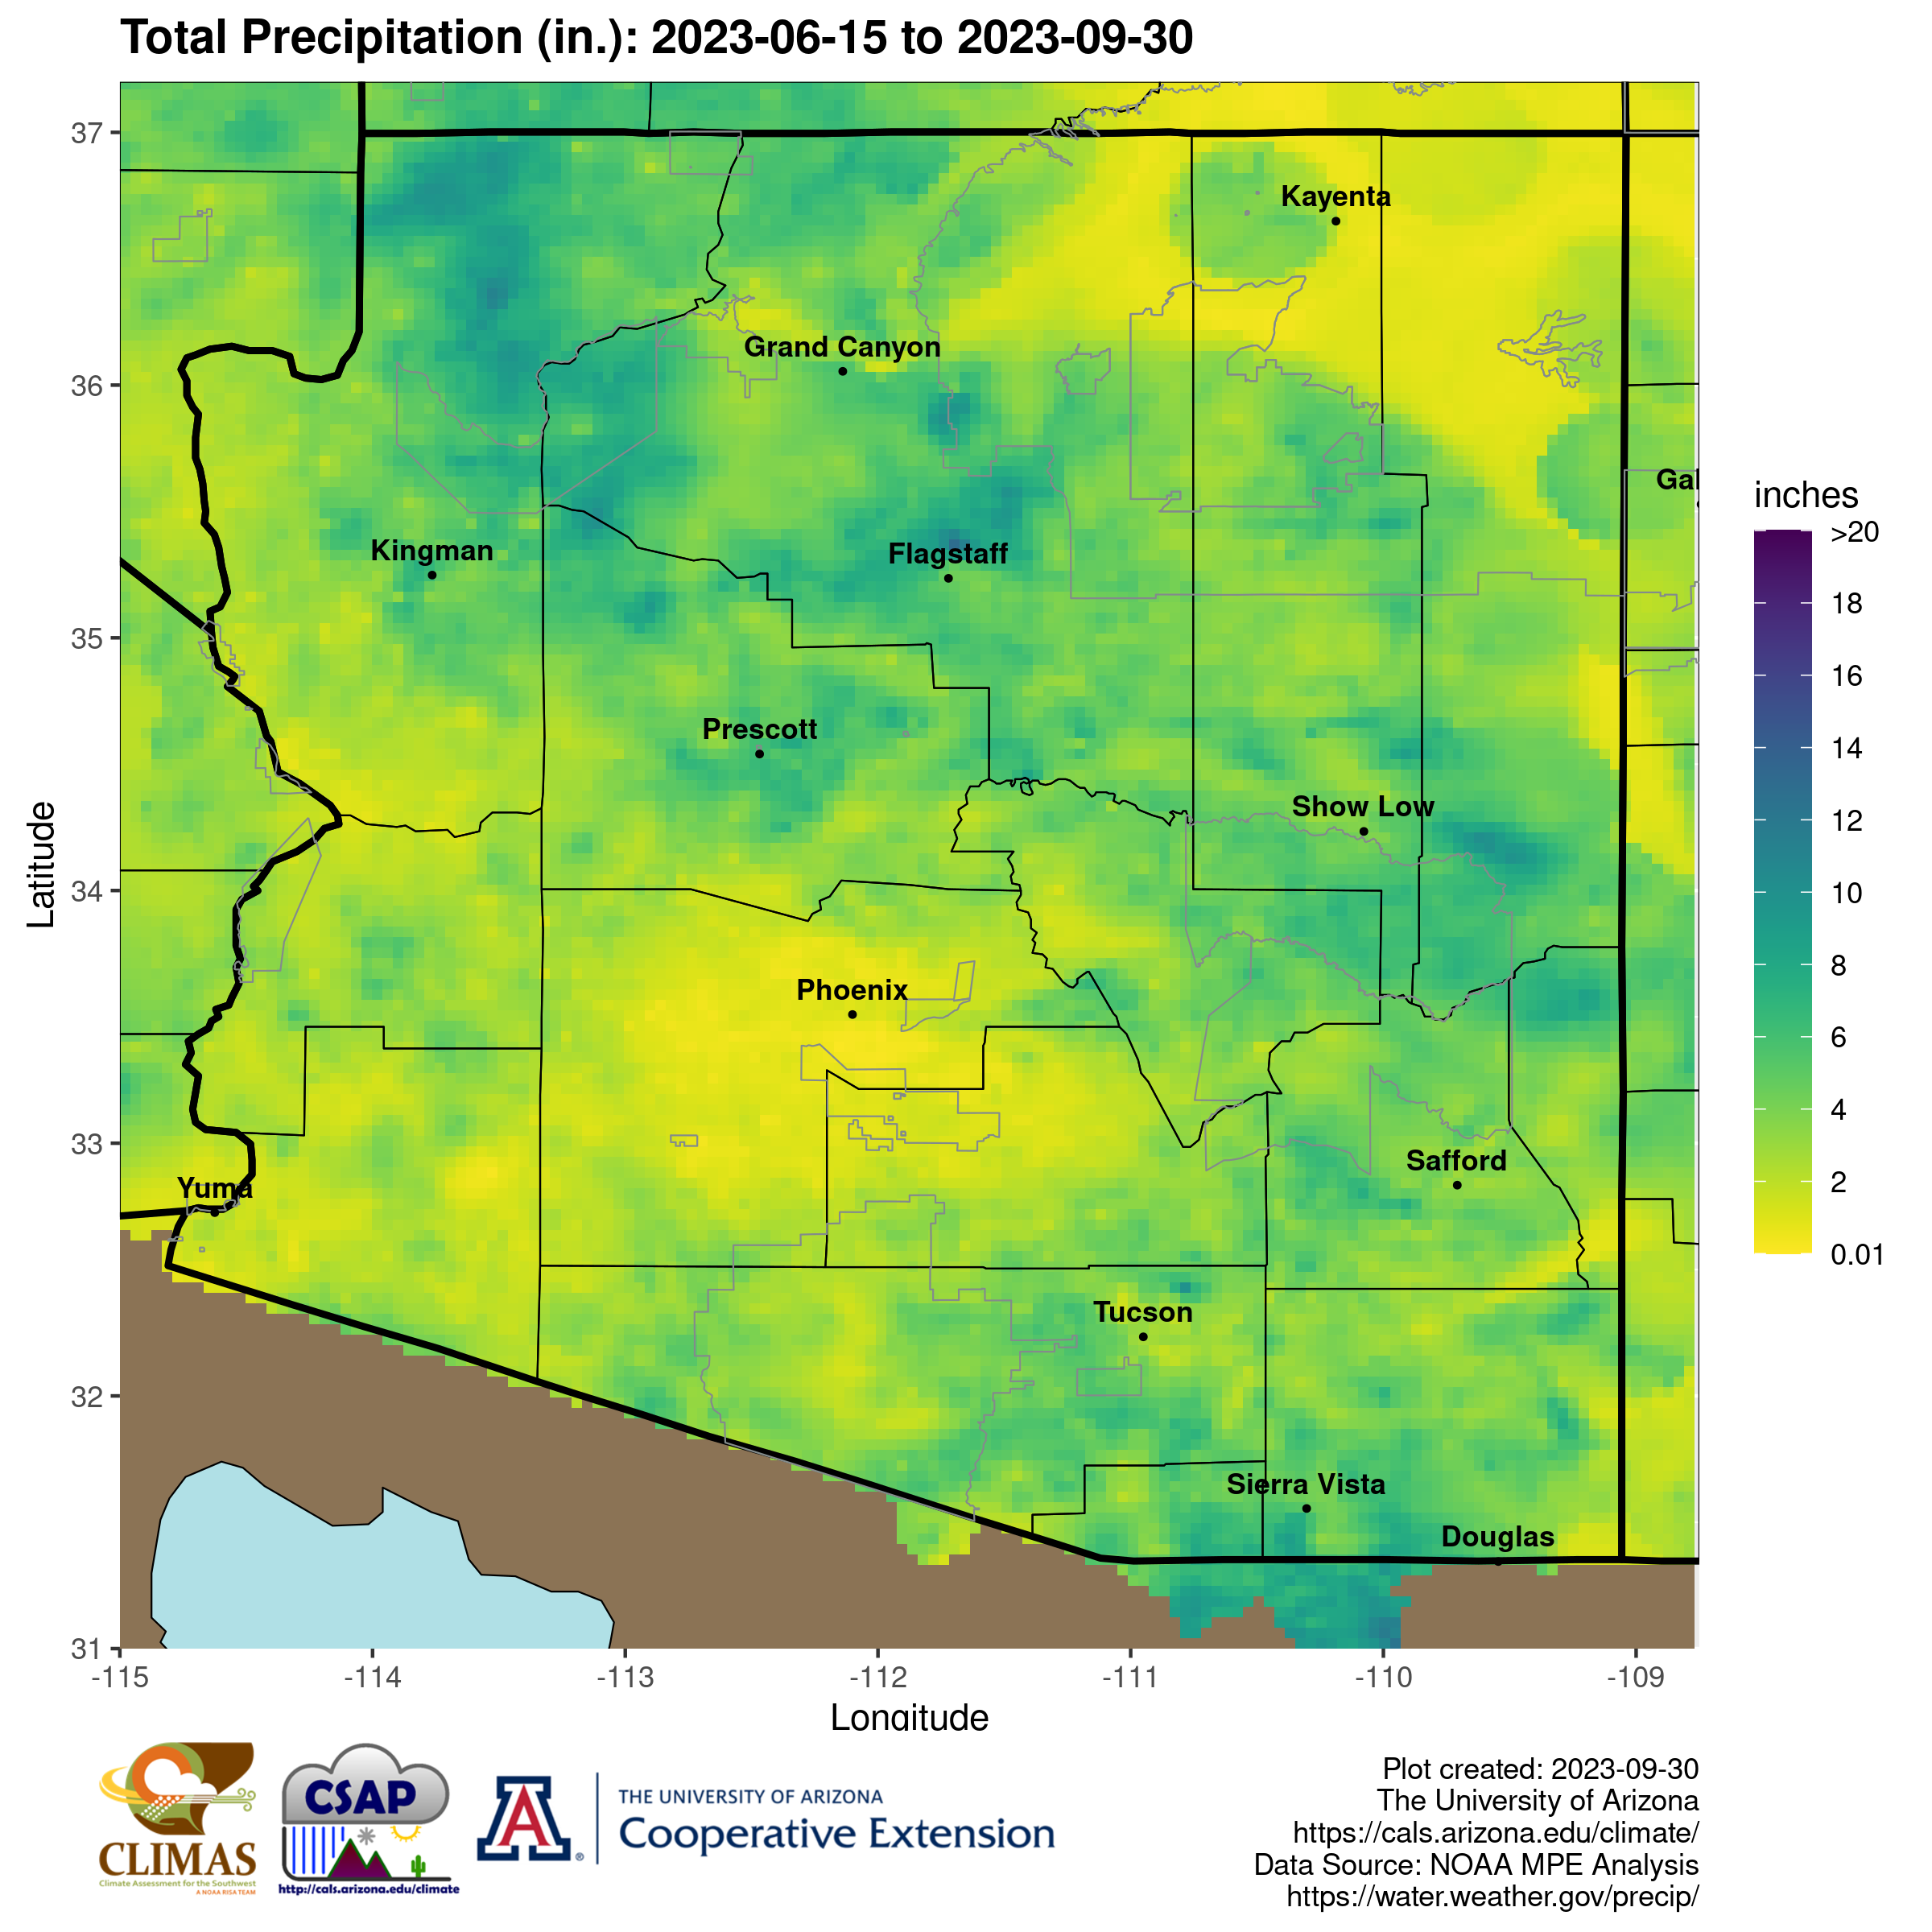
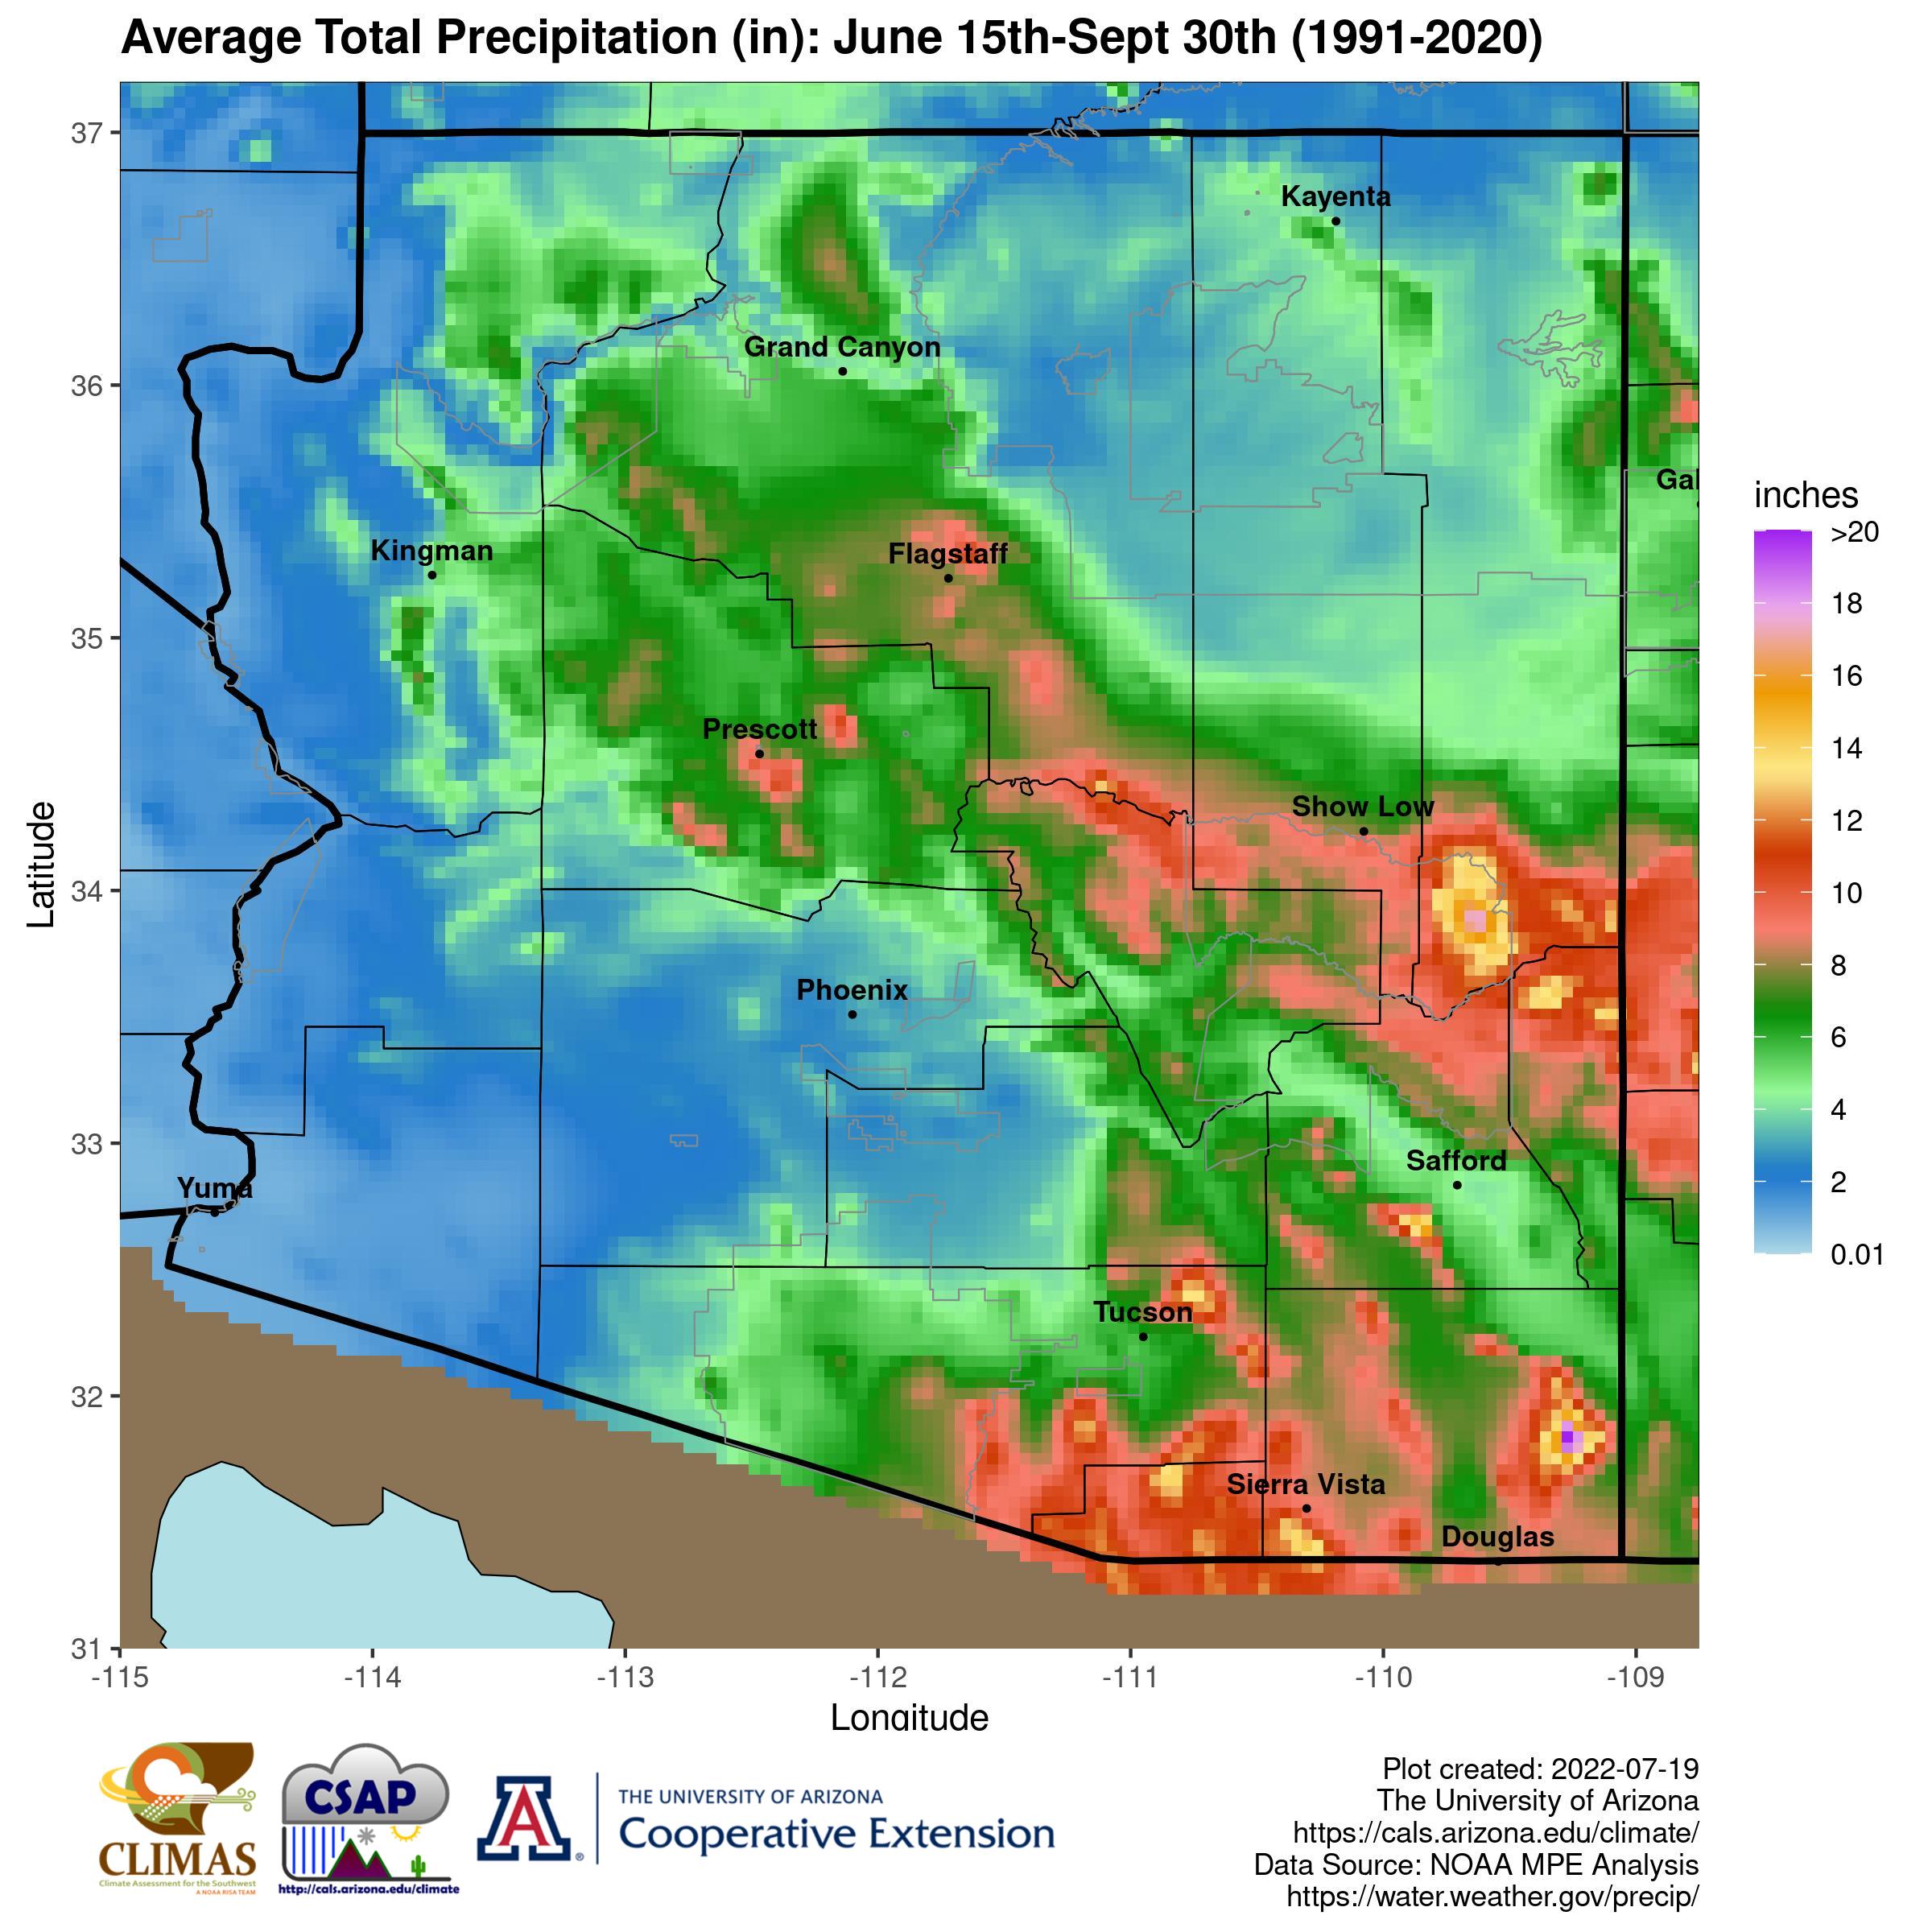
Total precipitation: Daily precipitation data summed
from 6/15 to present. (Categorical color scale, Colorblind-friendly)
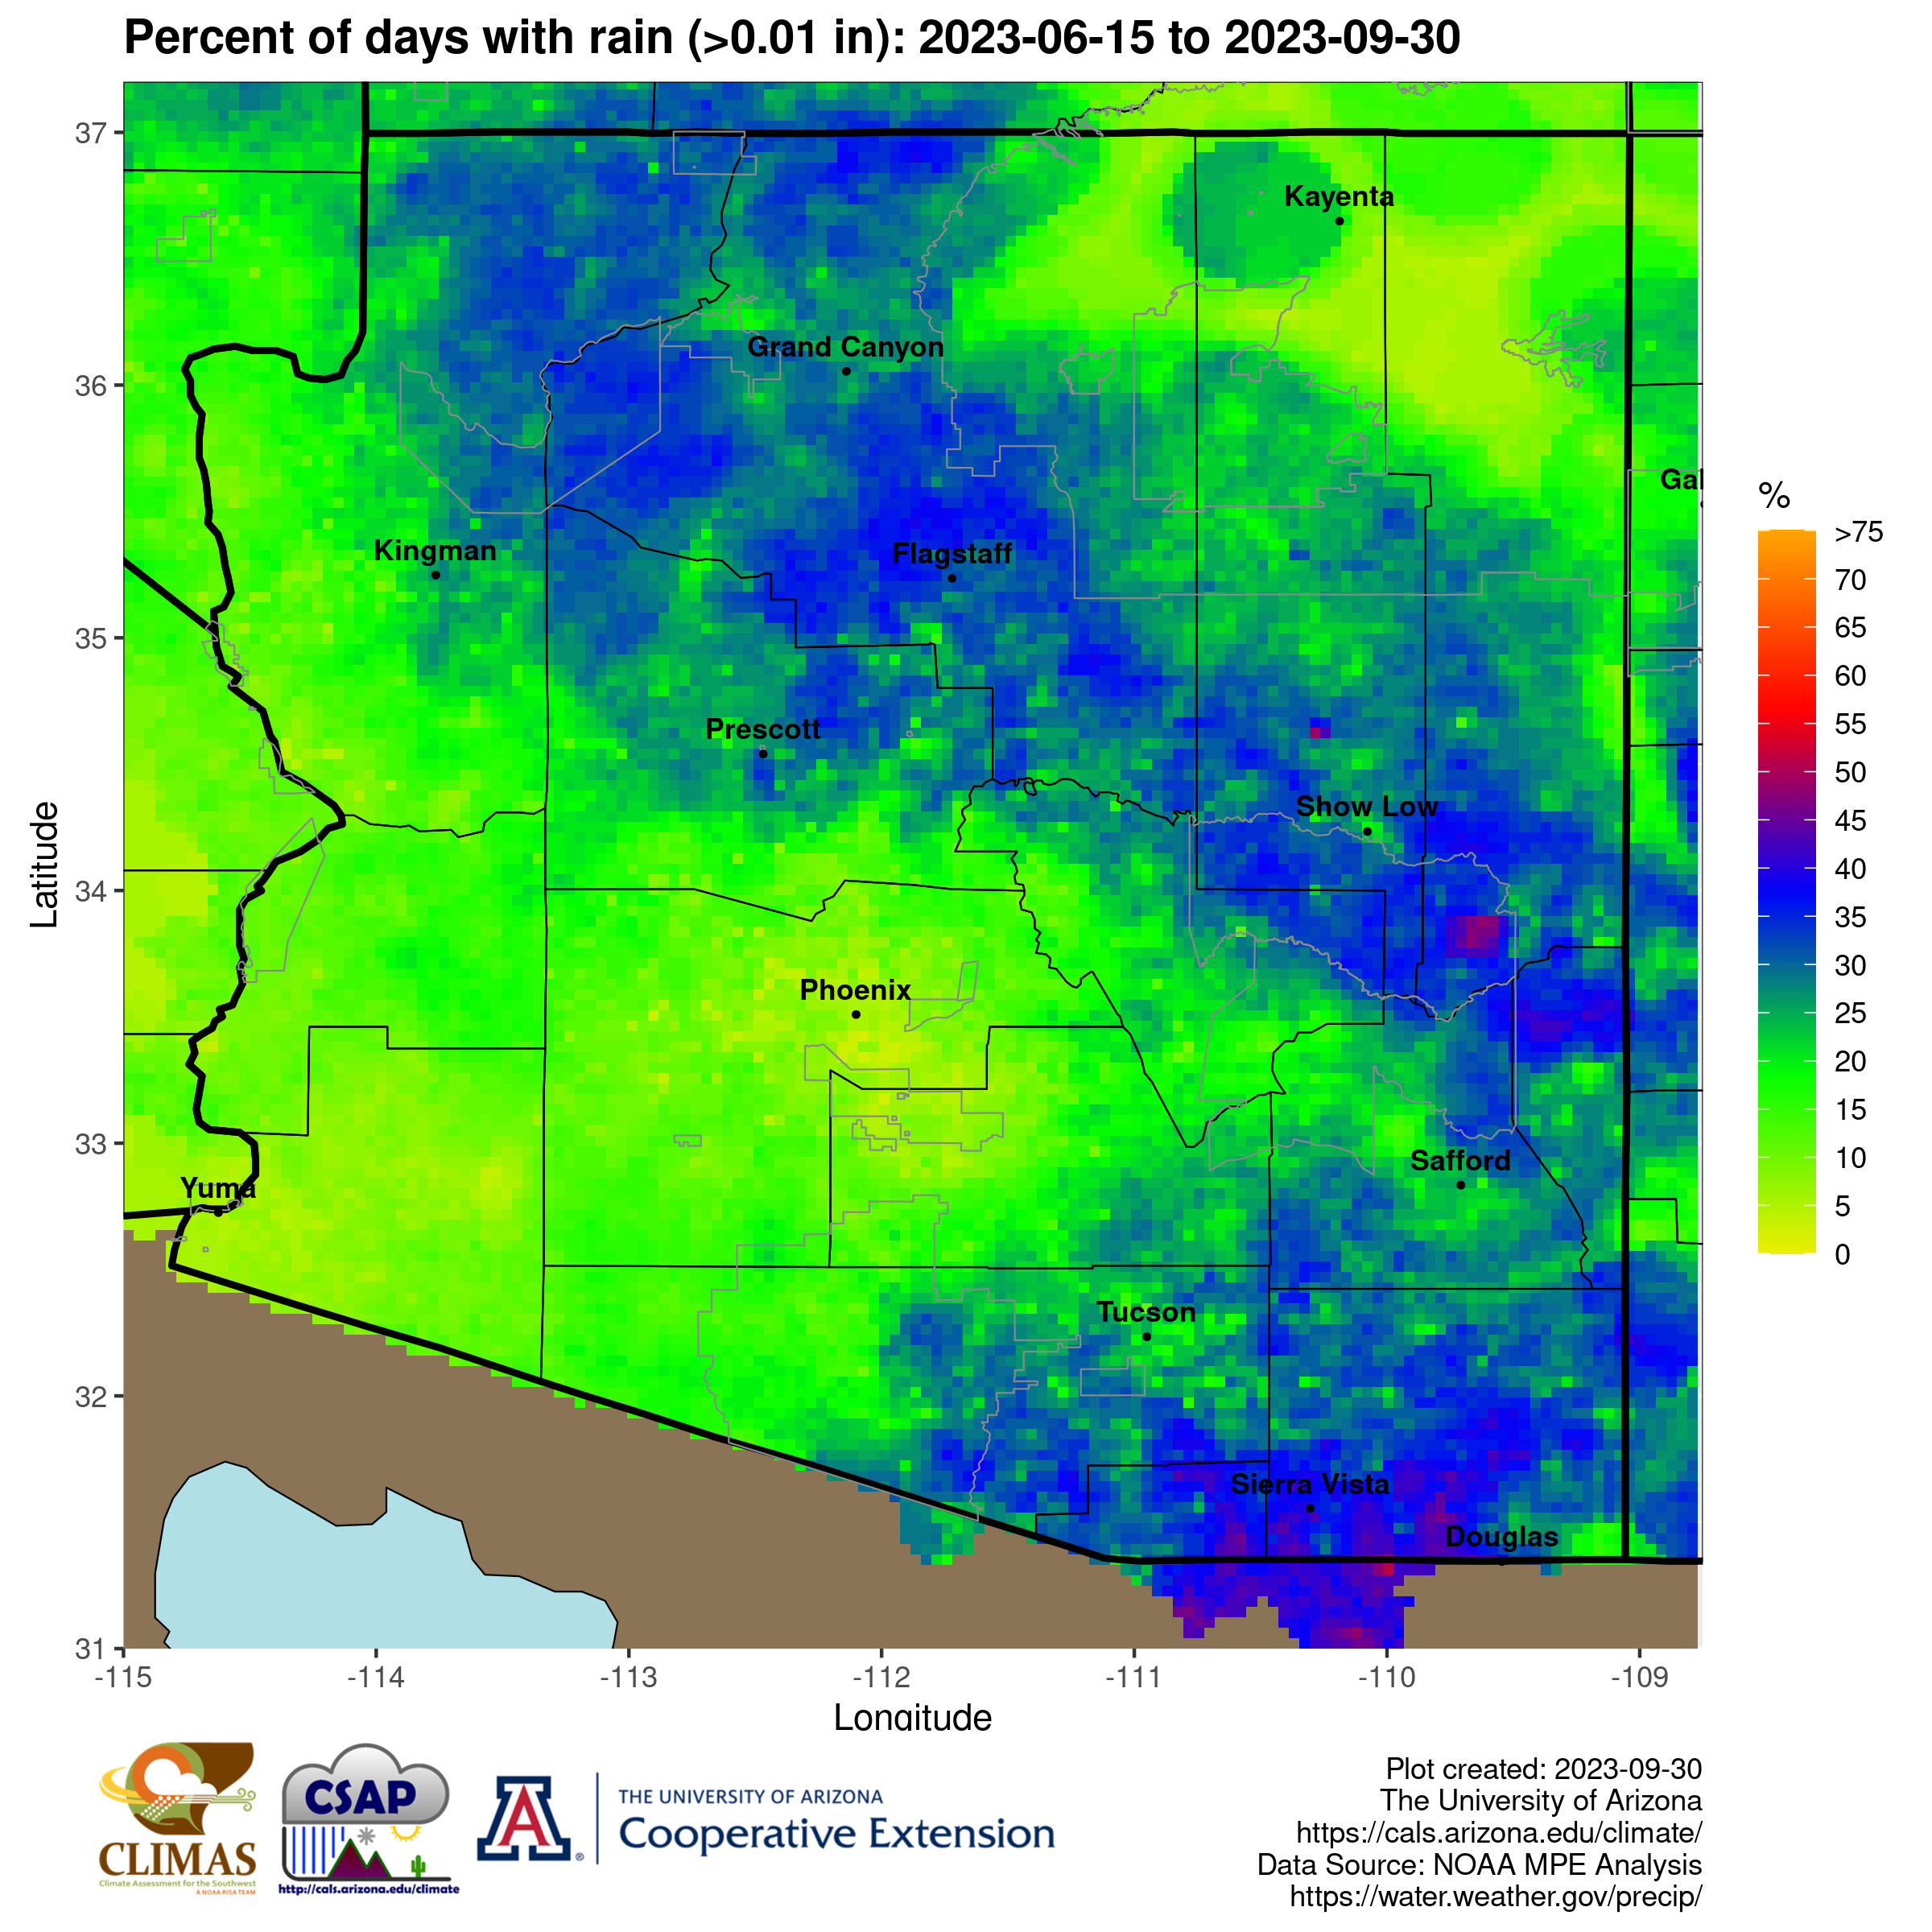
Percent of days with rain: A count of days observing greater than or equal to 0.01” of rain divided by the number of days between 6/15 and the current date. A value of 50% indicates that rain was observed on half of the days between 6/15 and the current date.
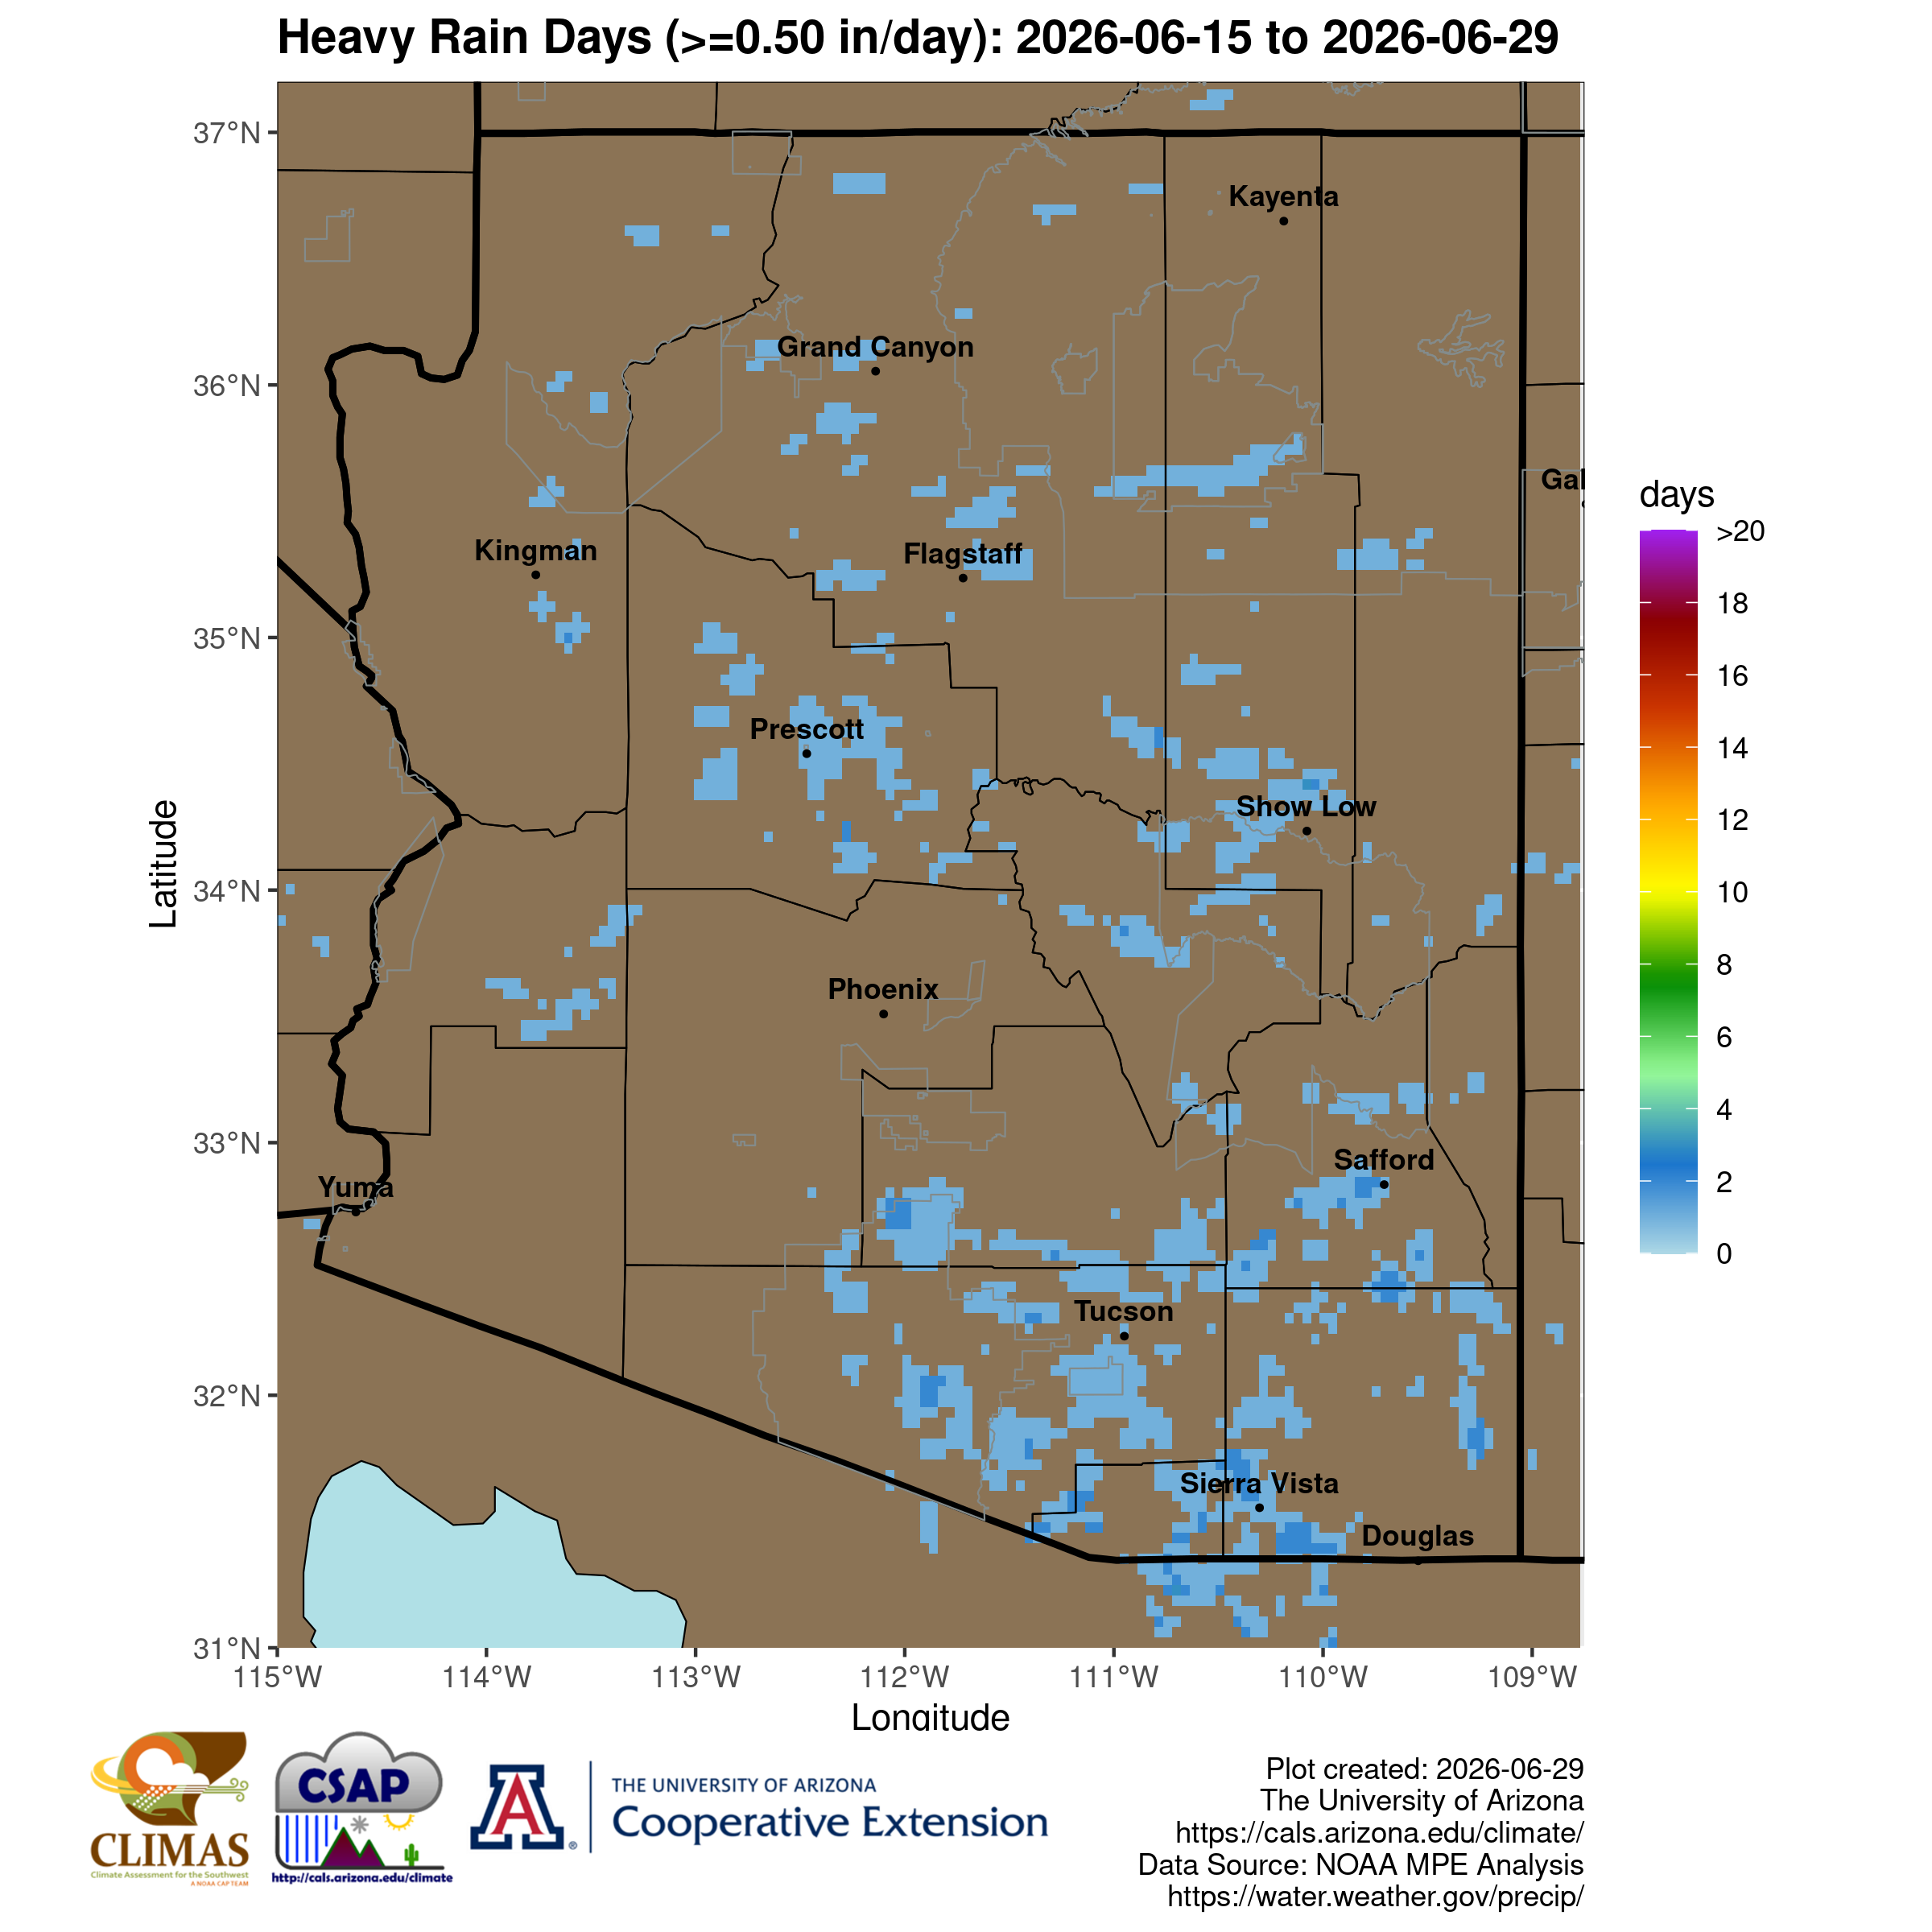
Heavy rain days: The number of days with at least 0.50” of precipitation. Higher values highlight areas with repeated runoff-producing storms, not just one large event.
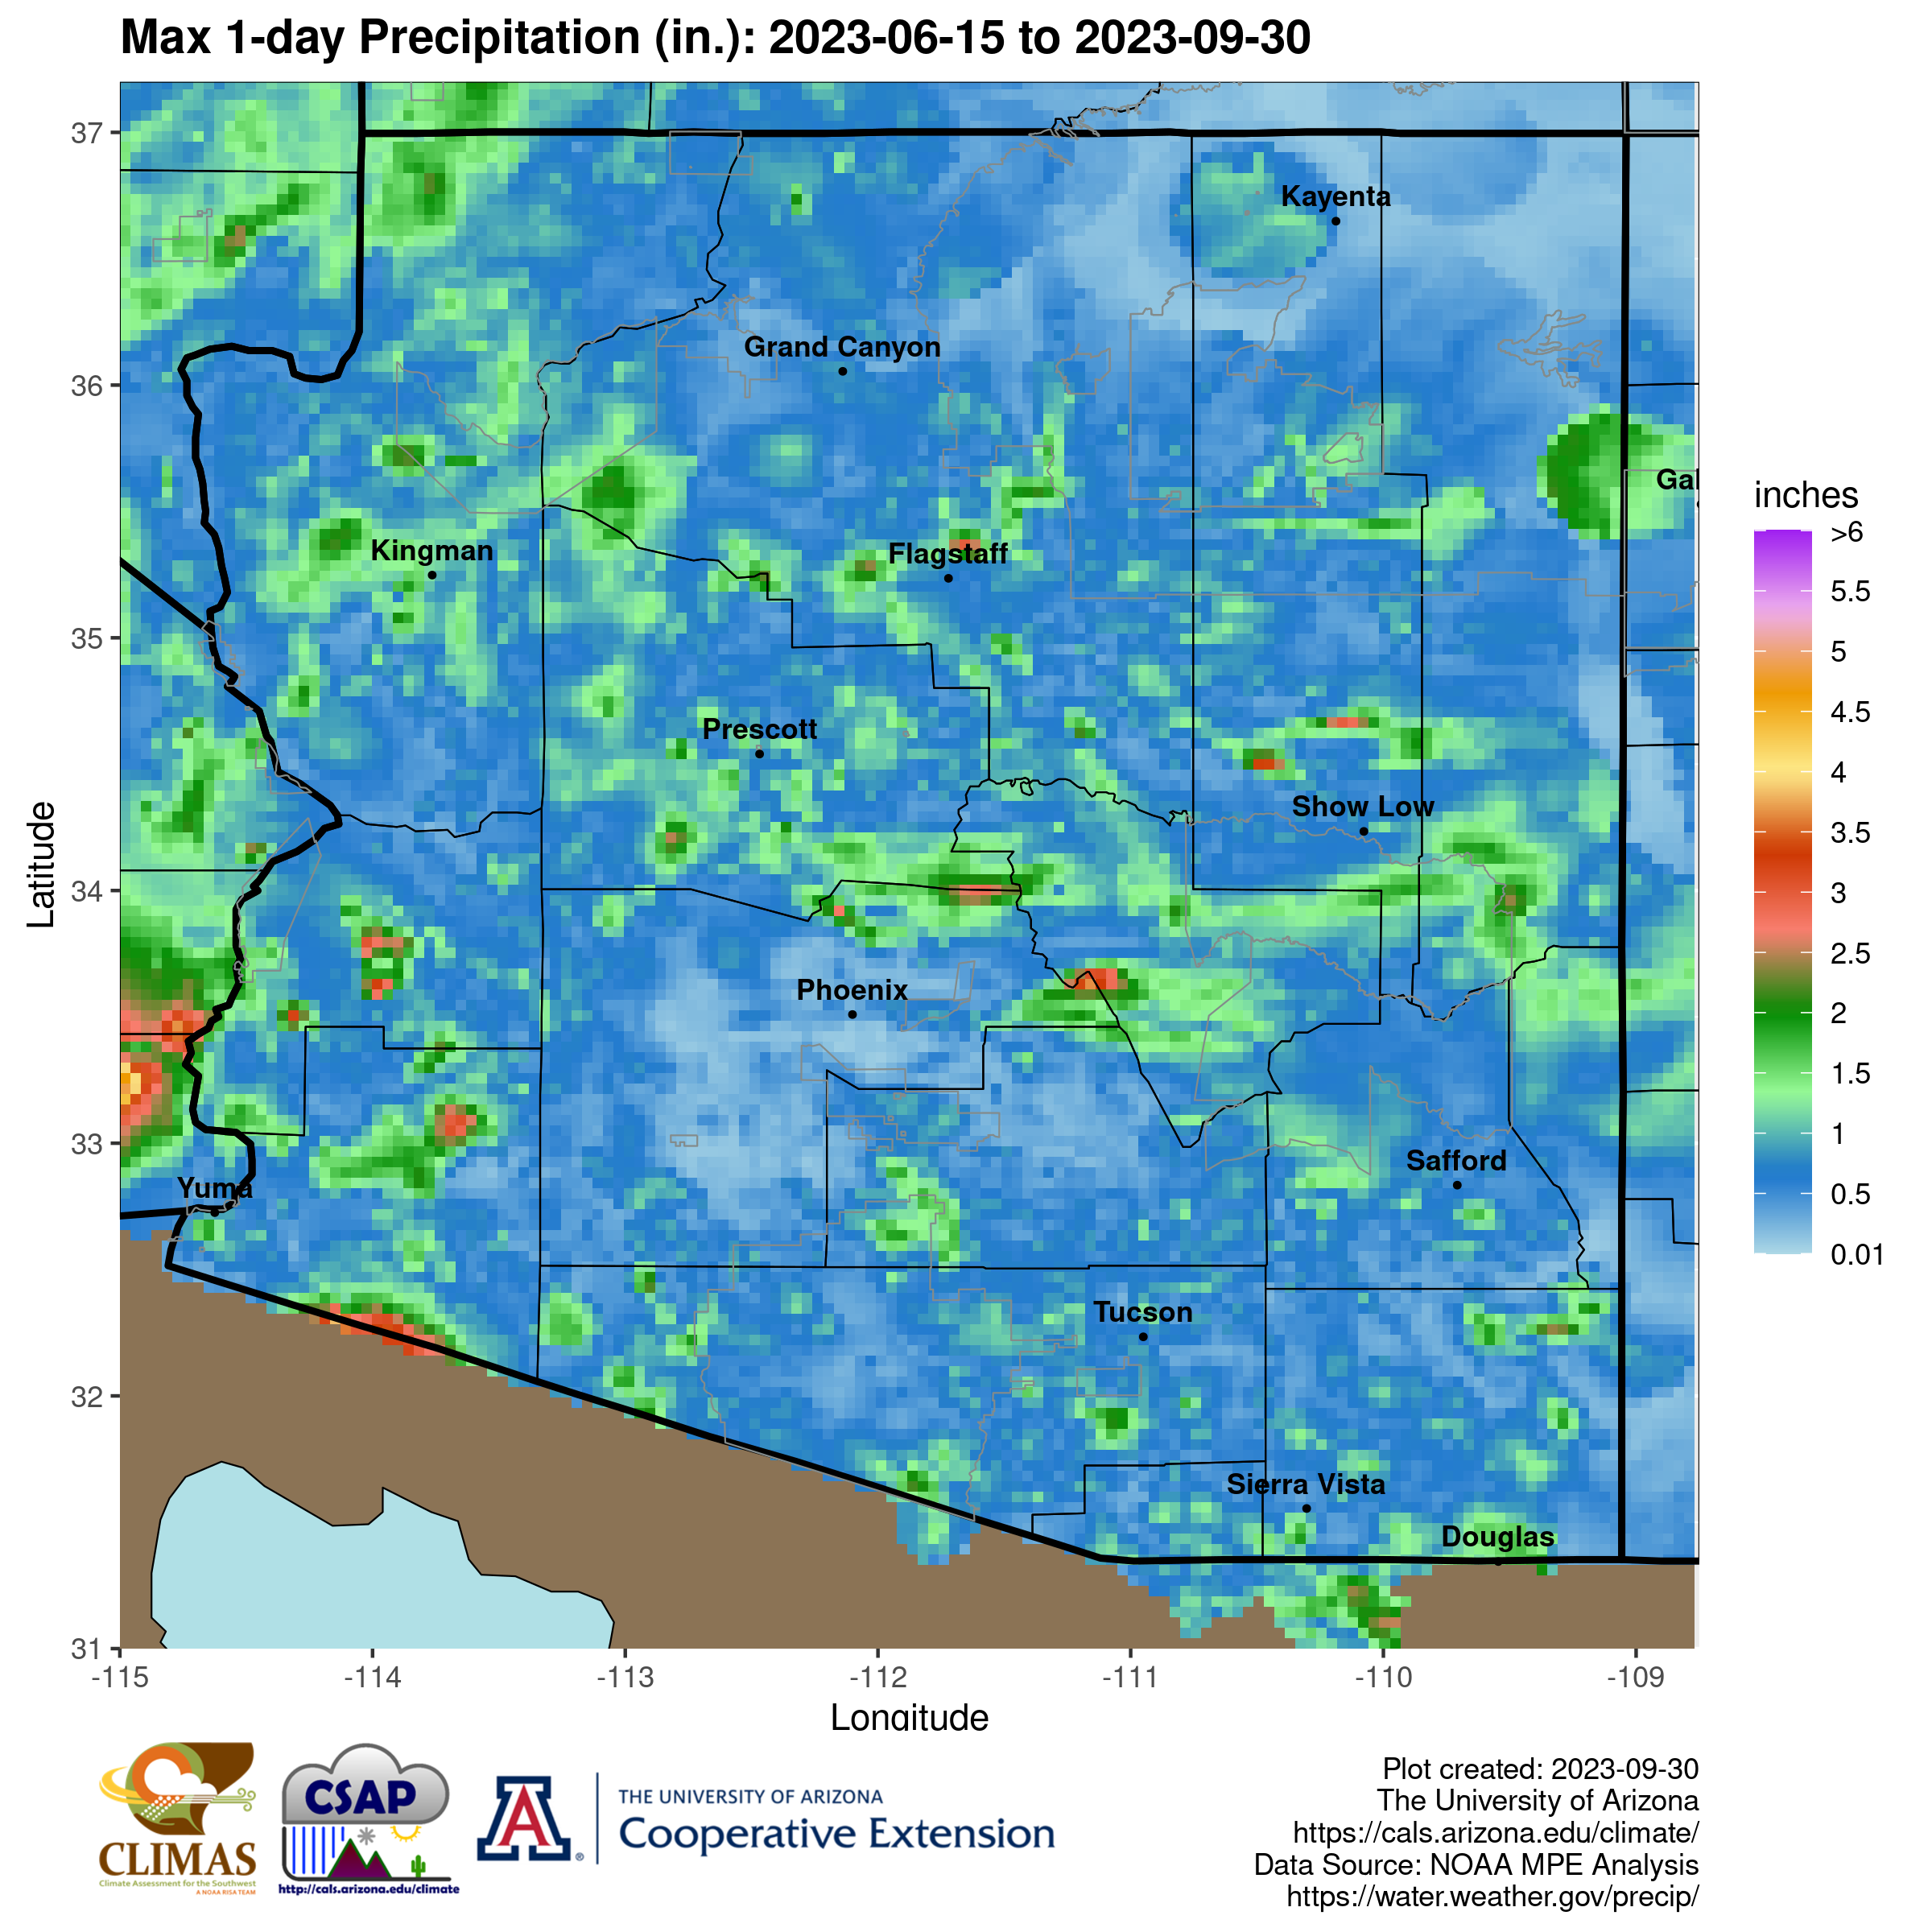
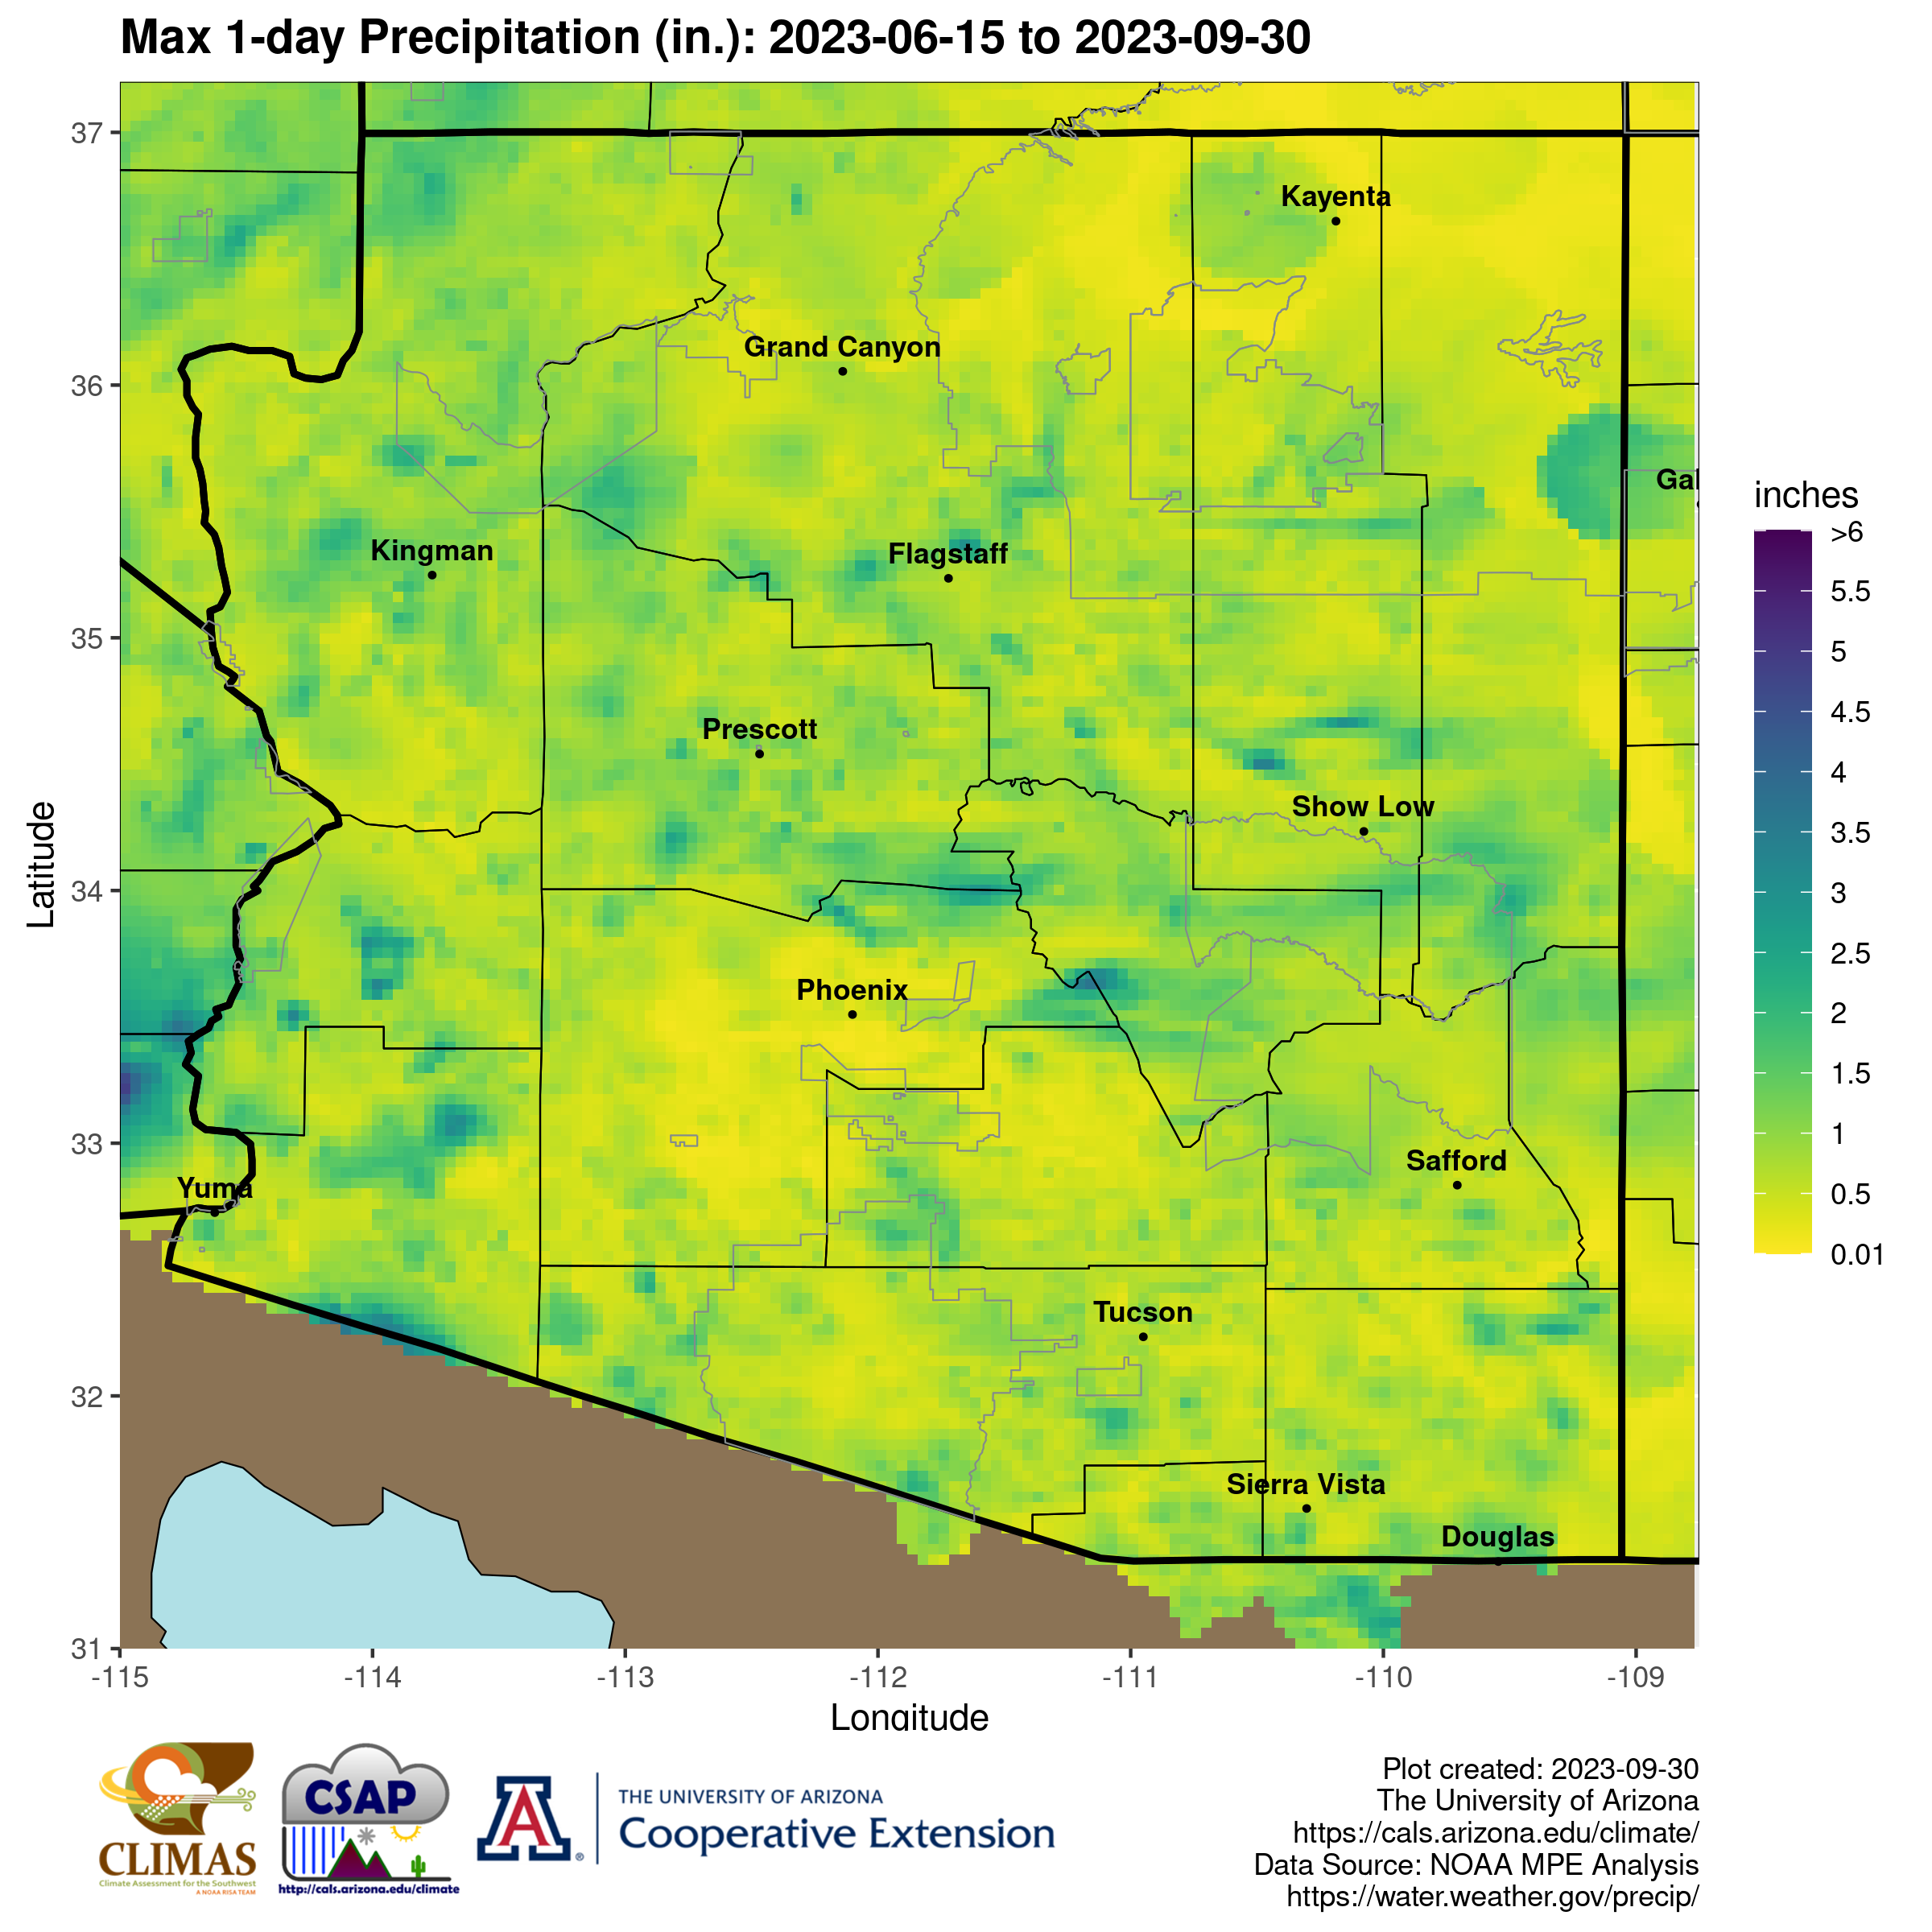
Max 1-day precipitation: This map shows the single
maximum 1-day precipitation amount observed in each data grid cell
between 6/15 and the current date. (Colorblind-friendly)
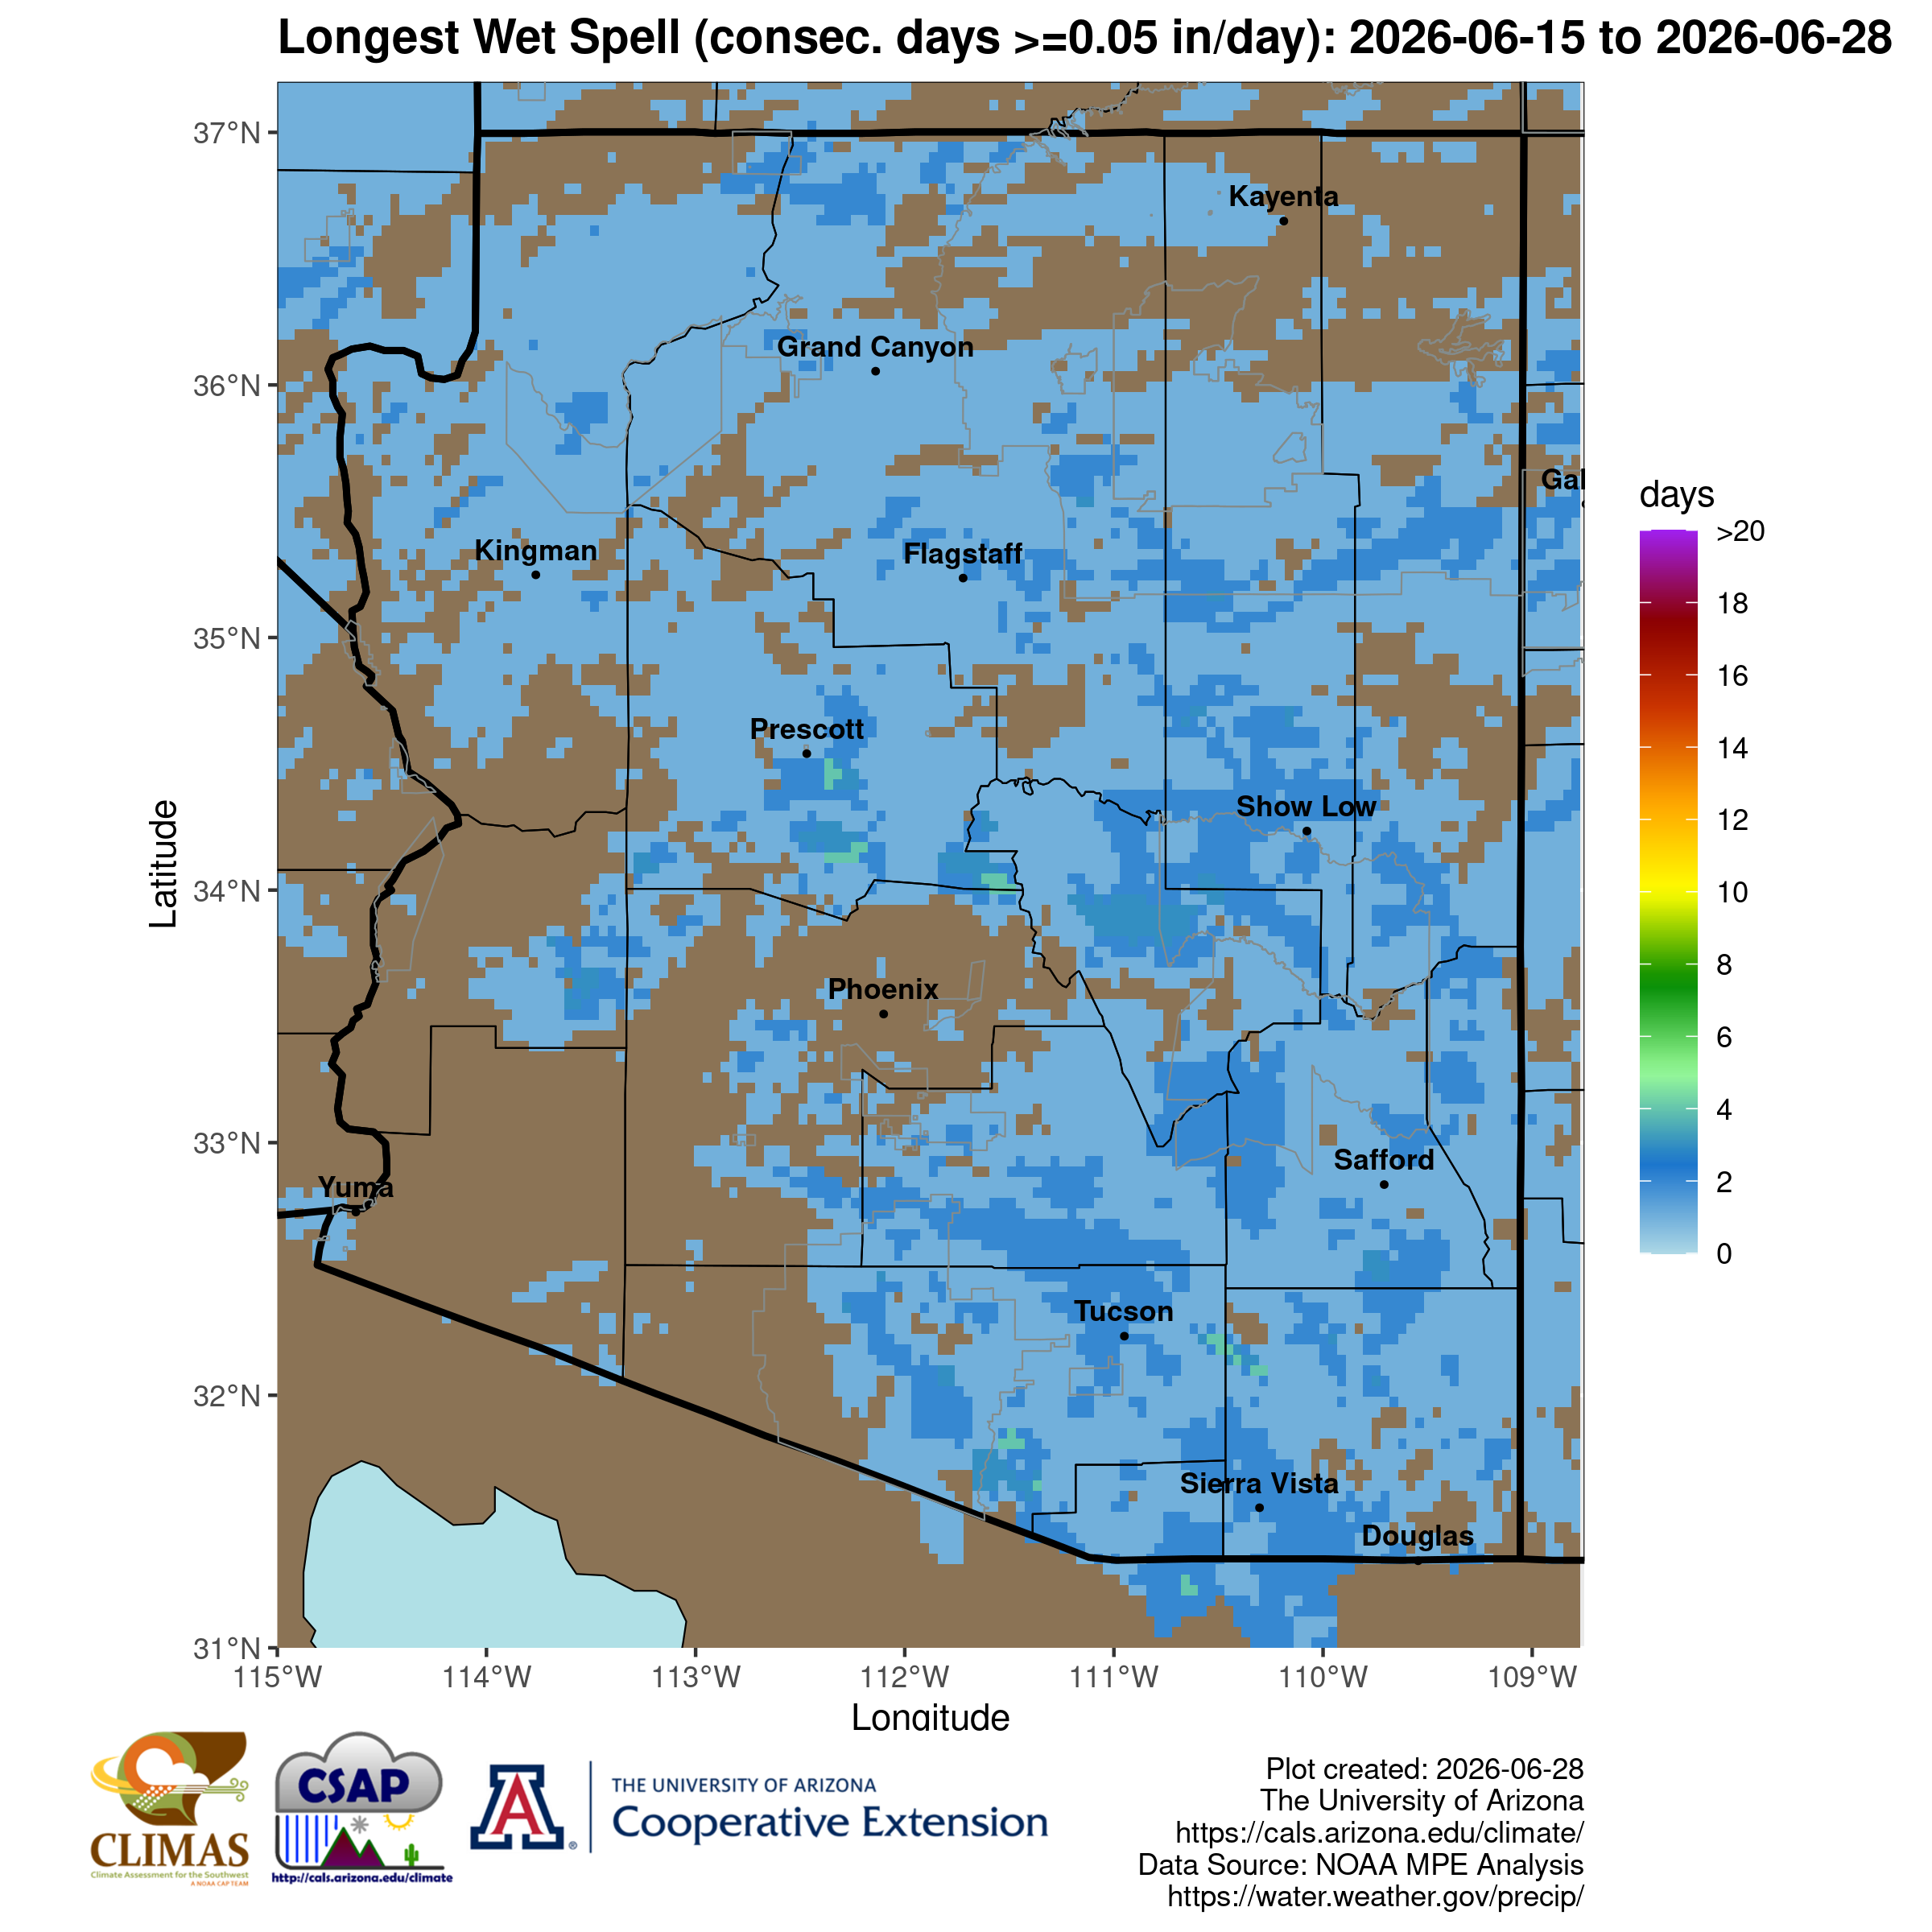
Longest wet spell: The longest stretch of days with at least 0.05” of precipitation. Higher values indicate persistent periods of monsoon activity and sustained moisture.
Most Recent 24-hr Precipitation (ending 5am MST on date listed)
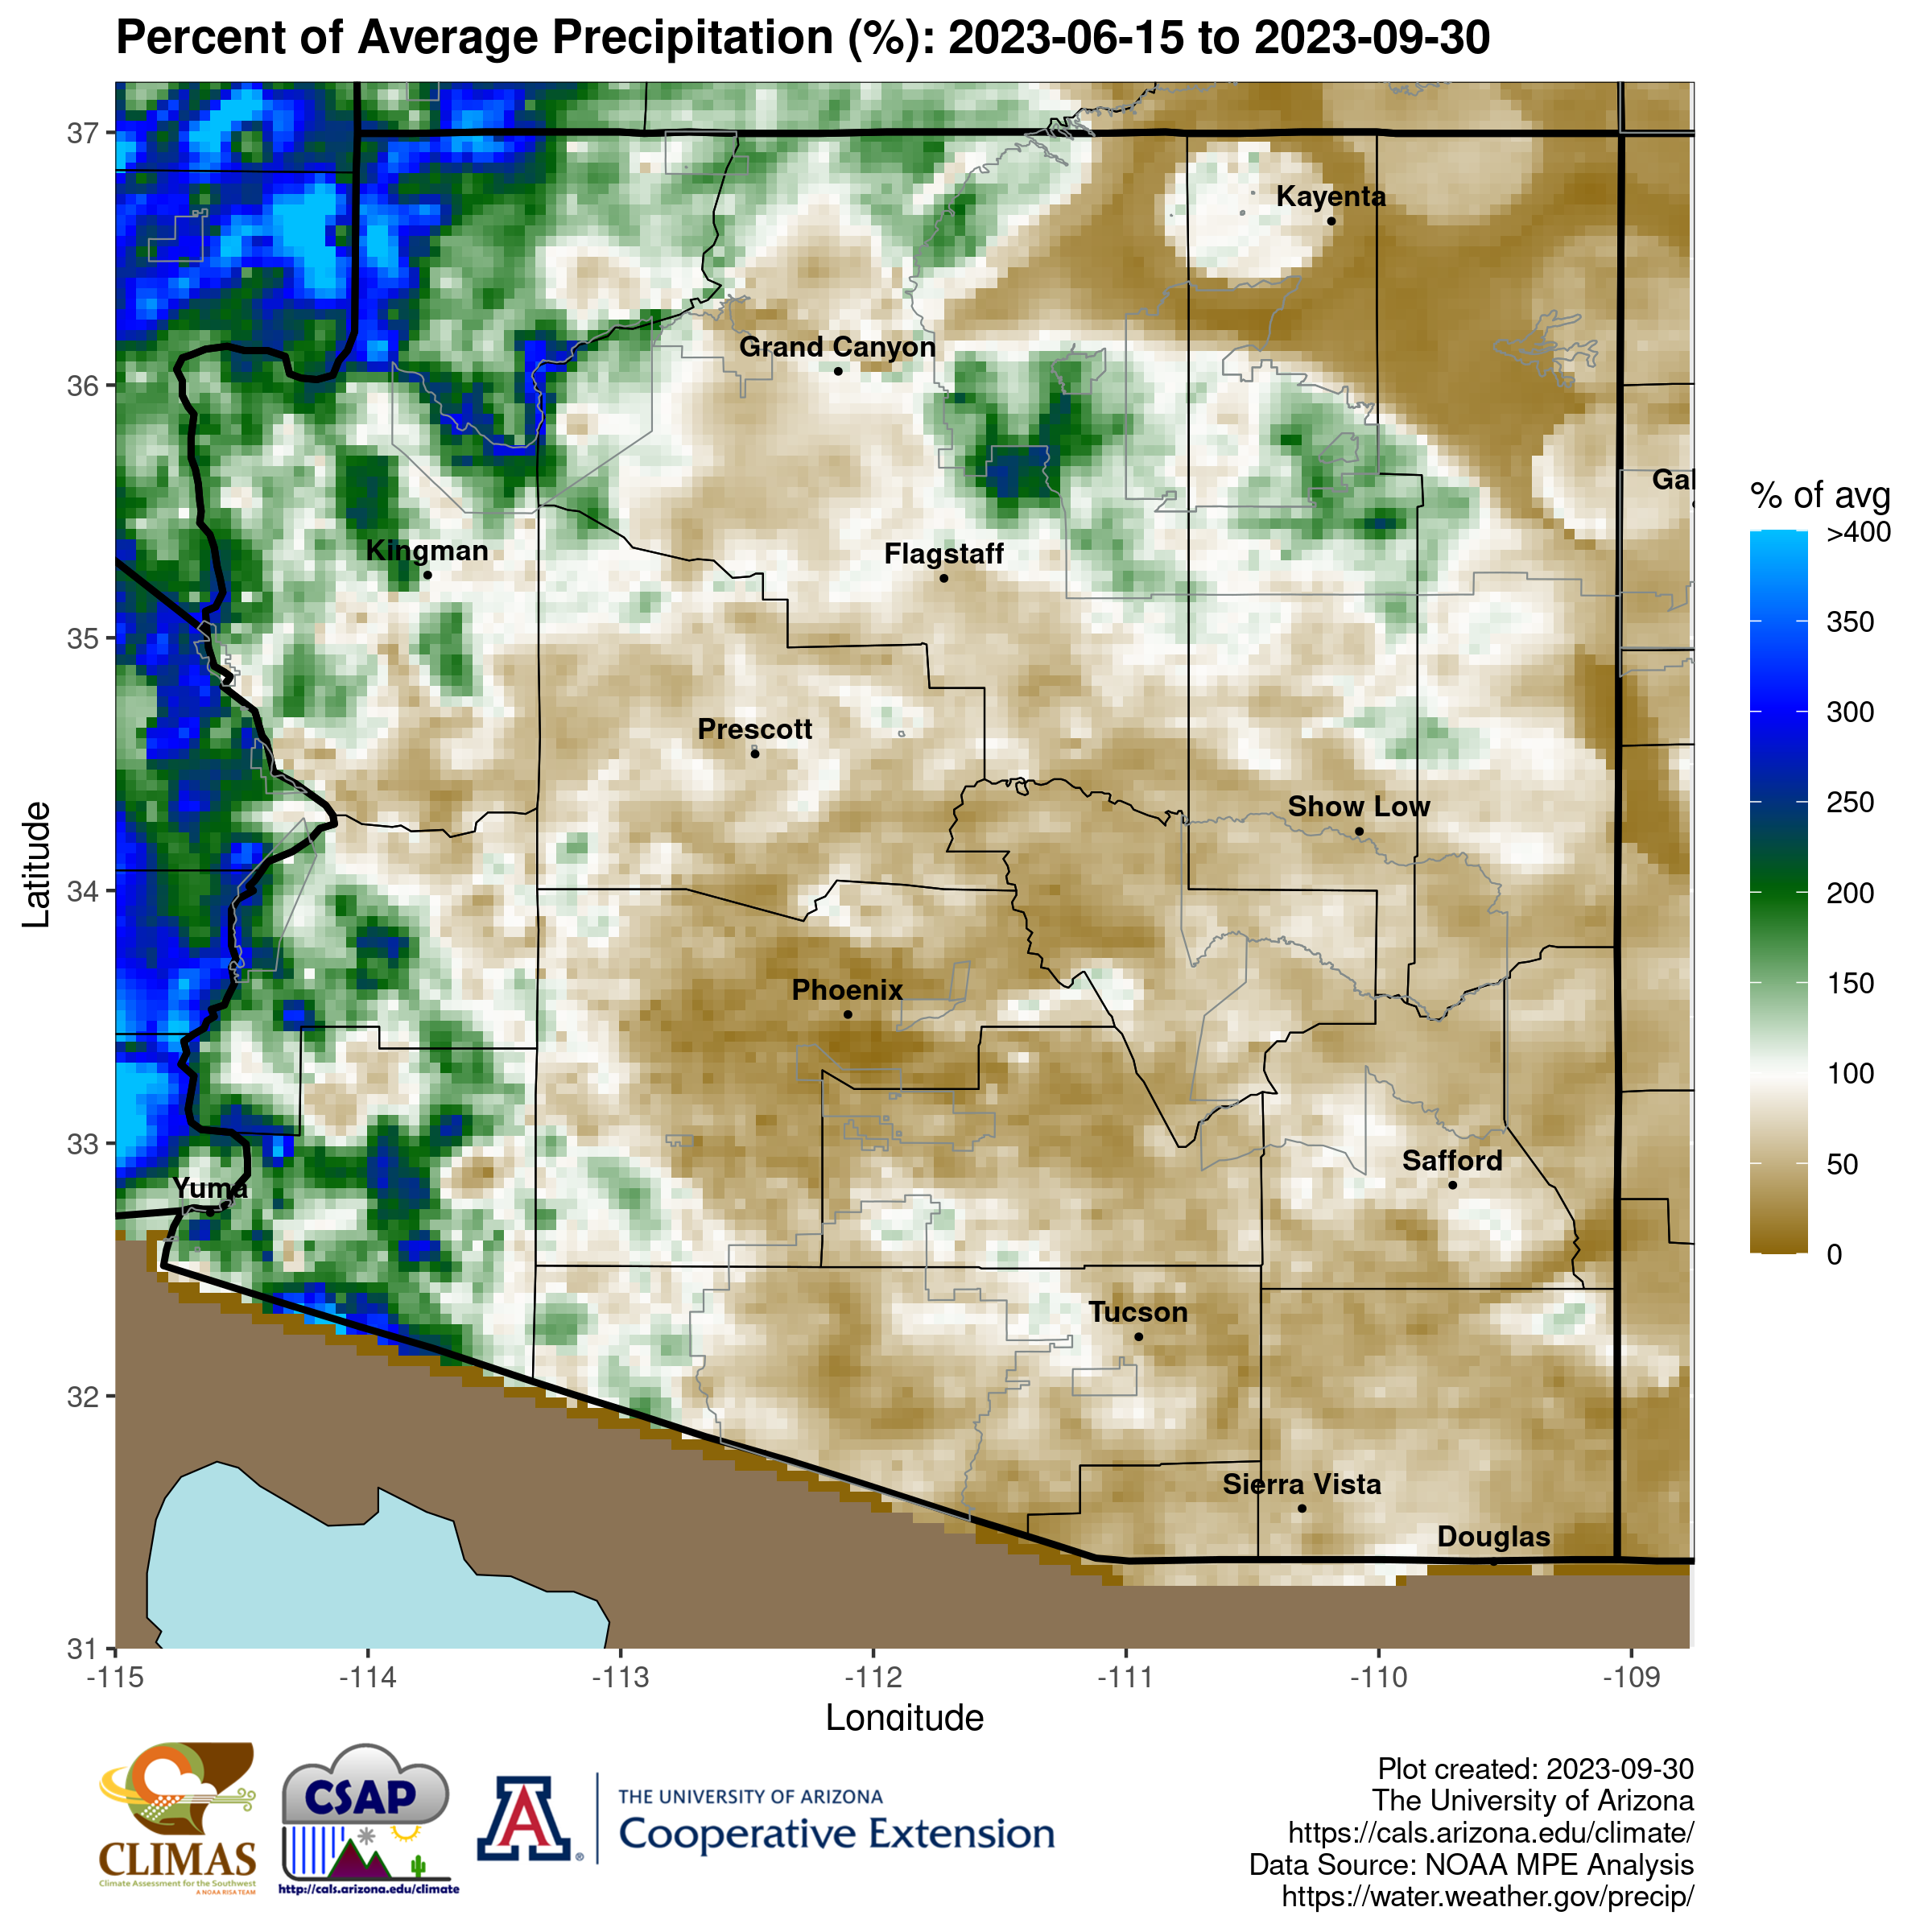
Percent of average precipitation: Percent of average is calculated by dividing the total accumulated precipitation by the long-term (1991-2020) mean and is an indication of how much totals have deviated from average precipitation for the June 15th to present period. 100% is equal to average for the time period shown on the map. (Seasonal Average Total Precipitation)
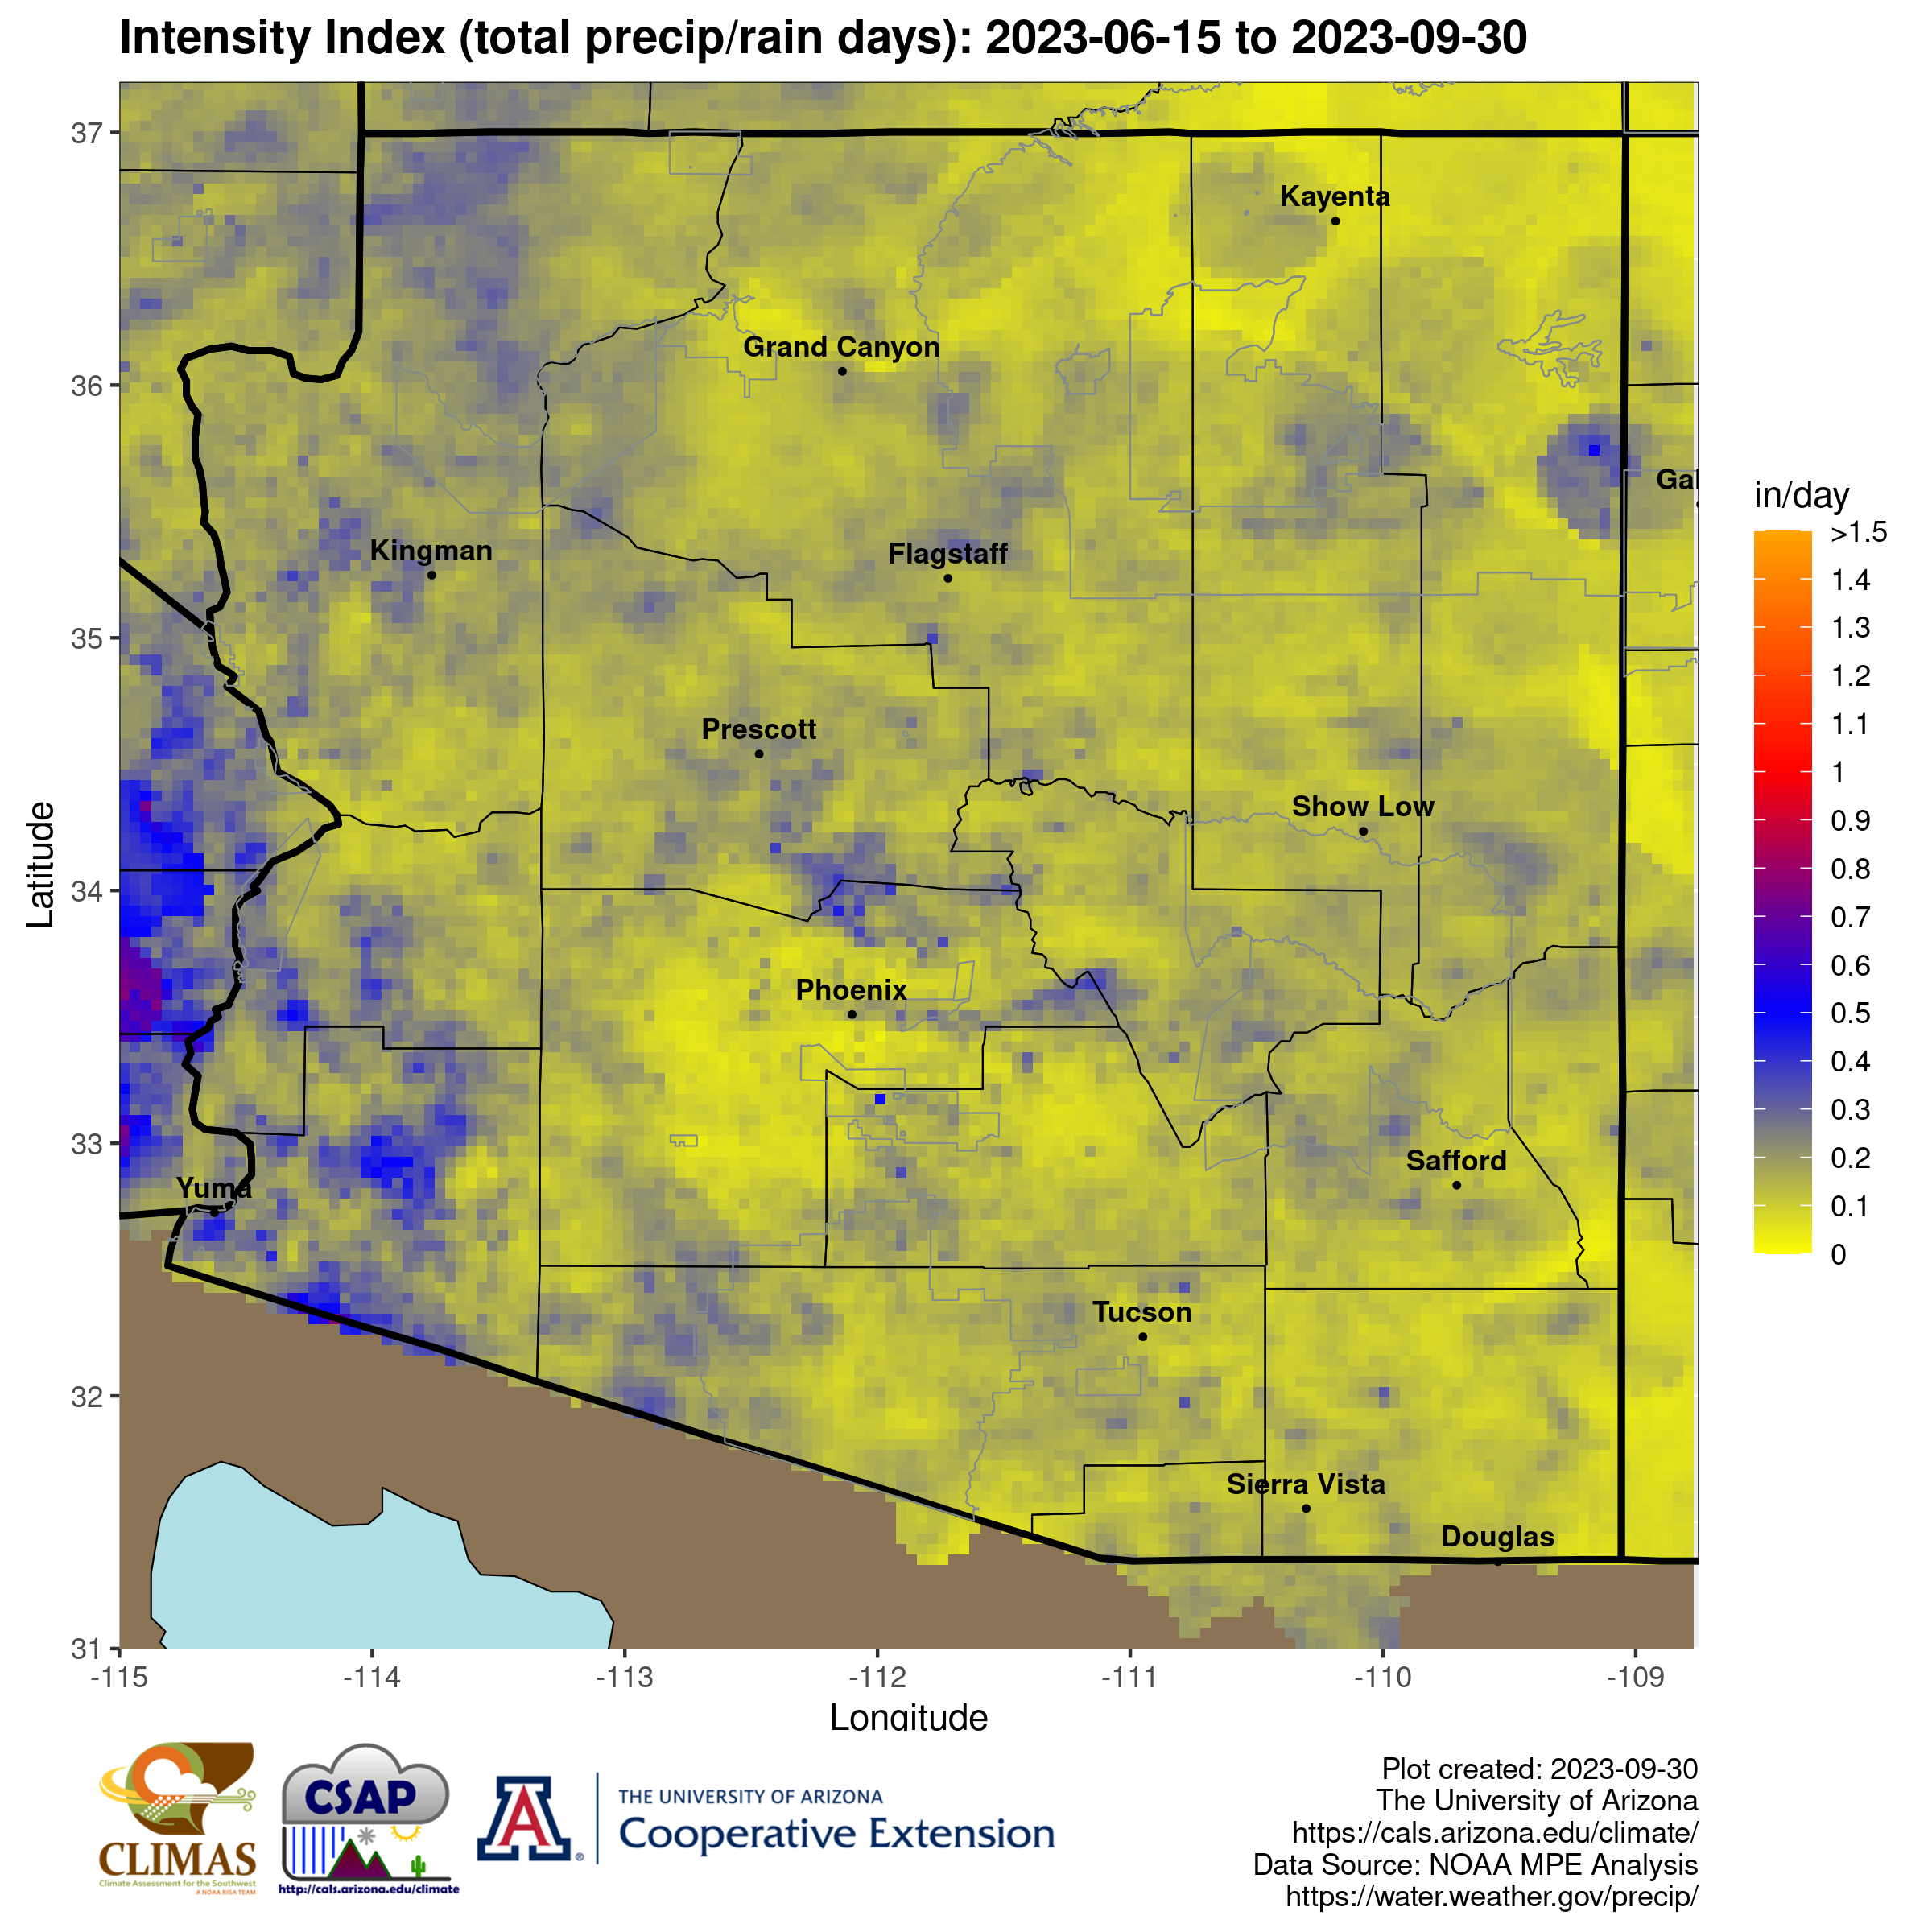
Daily intensity index: This index is the simple ratio between the total precipitation over the time period and the number of days observing rain with units in ‘inches/day’. A high value indicates that most of the total precipitation came in a small number of large or intense events.
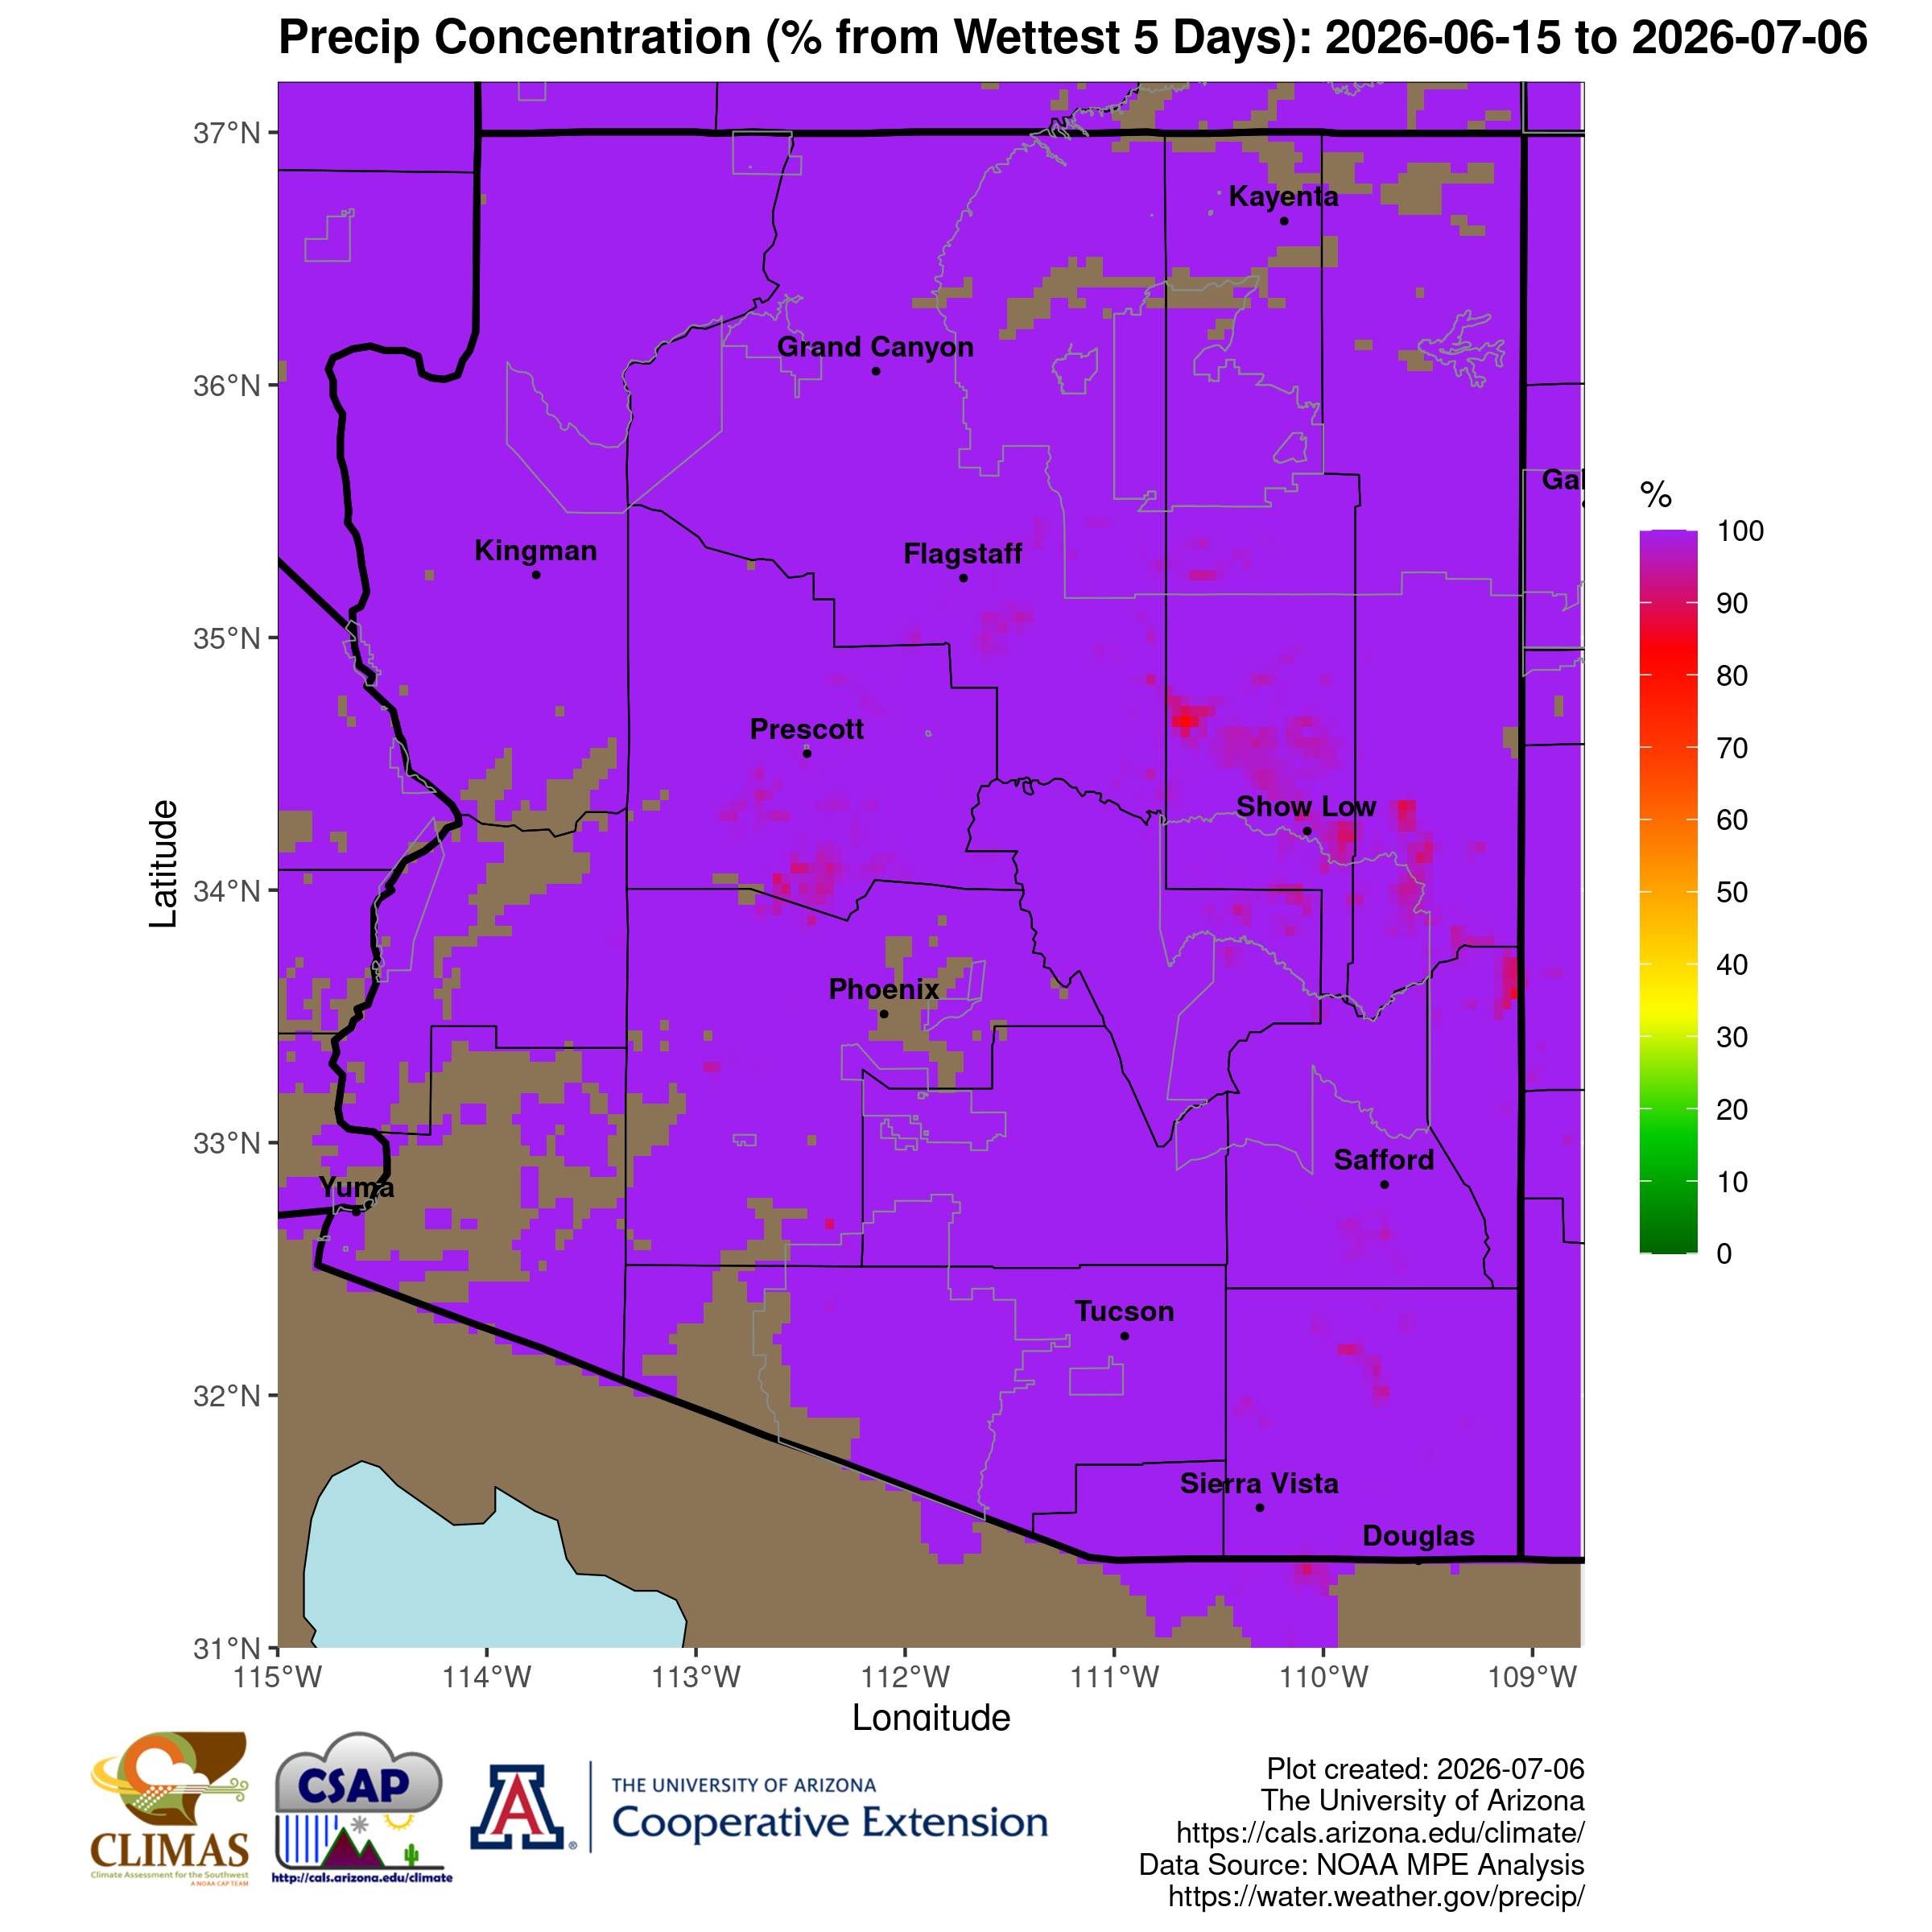
Precipitation concentration: The percent of total seasonal precipitation that fell during the five wettest days. Higher values indicate a more episodic season dominated by a few major events; lower values indicate rainfall was more evenly distributed.
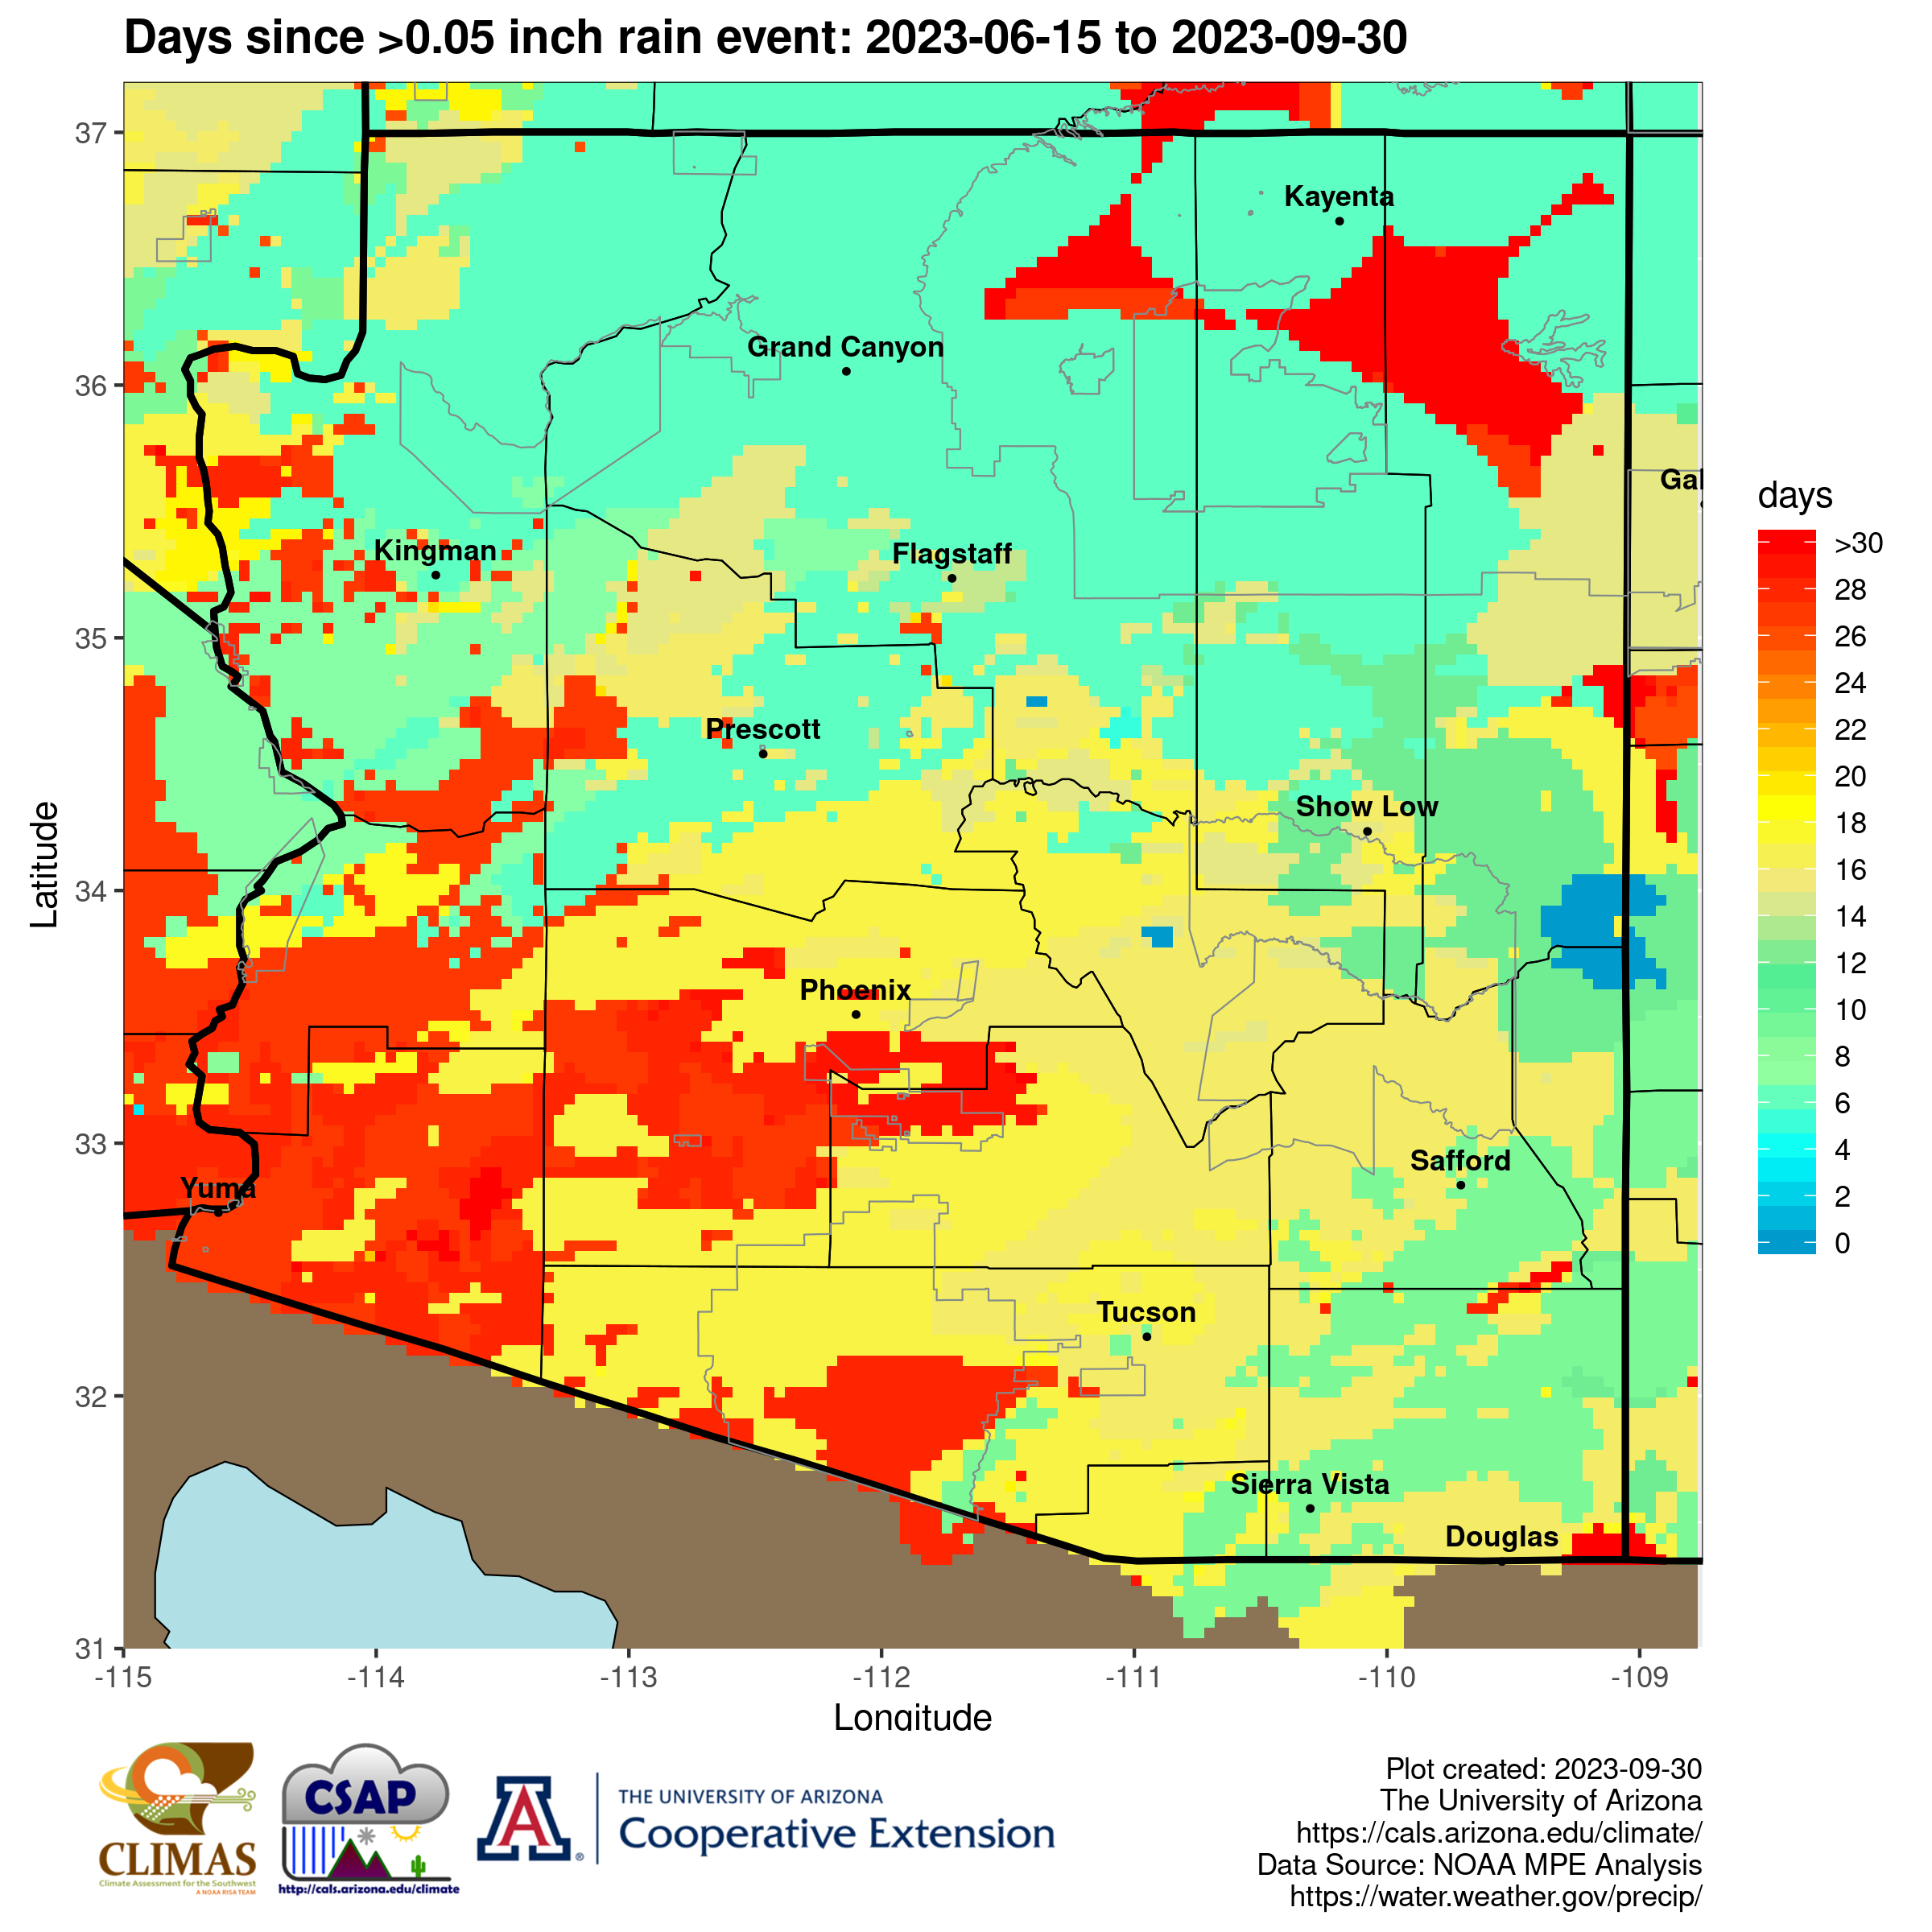
Days since 0.05” rain event: This map indicates the number of days since at least a precipitation amount of 0.05” was observed in each data grid cell. Higher values indicate a longer time period or break since at least light rainfall was observed.
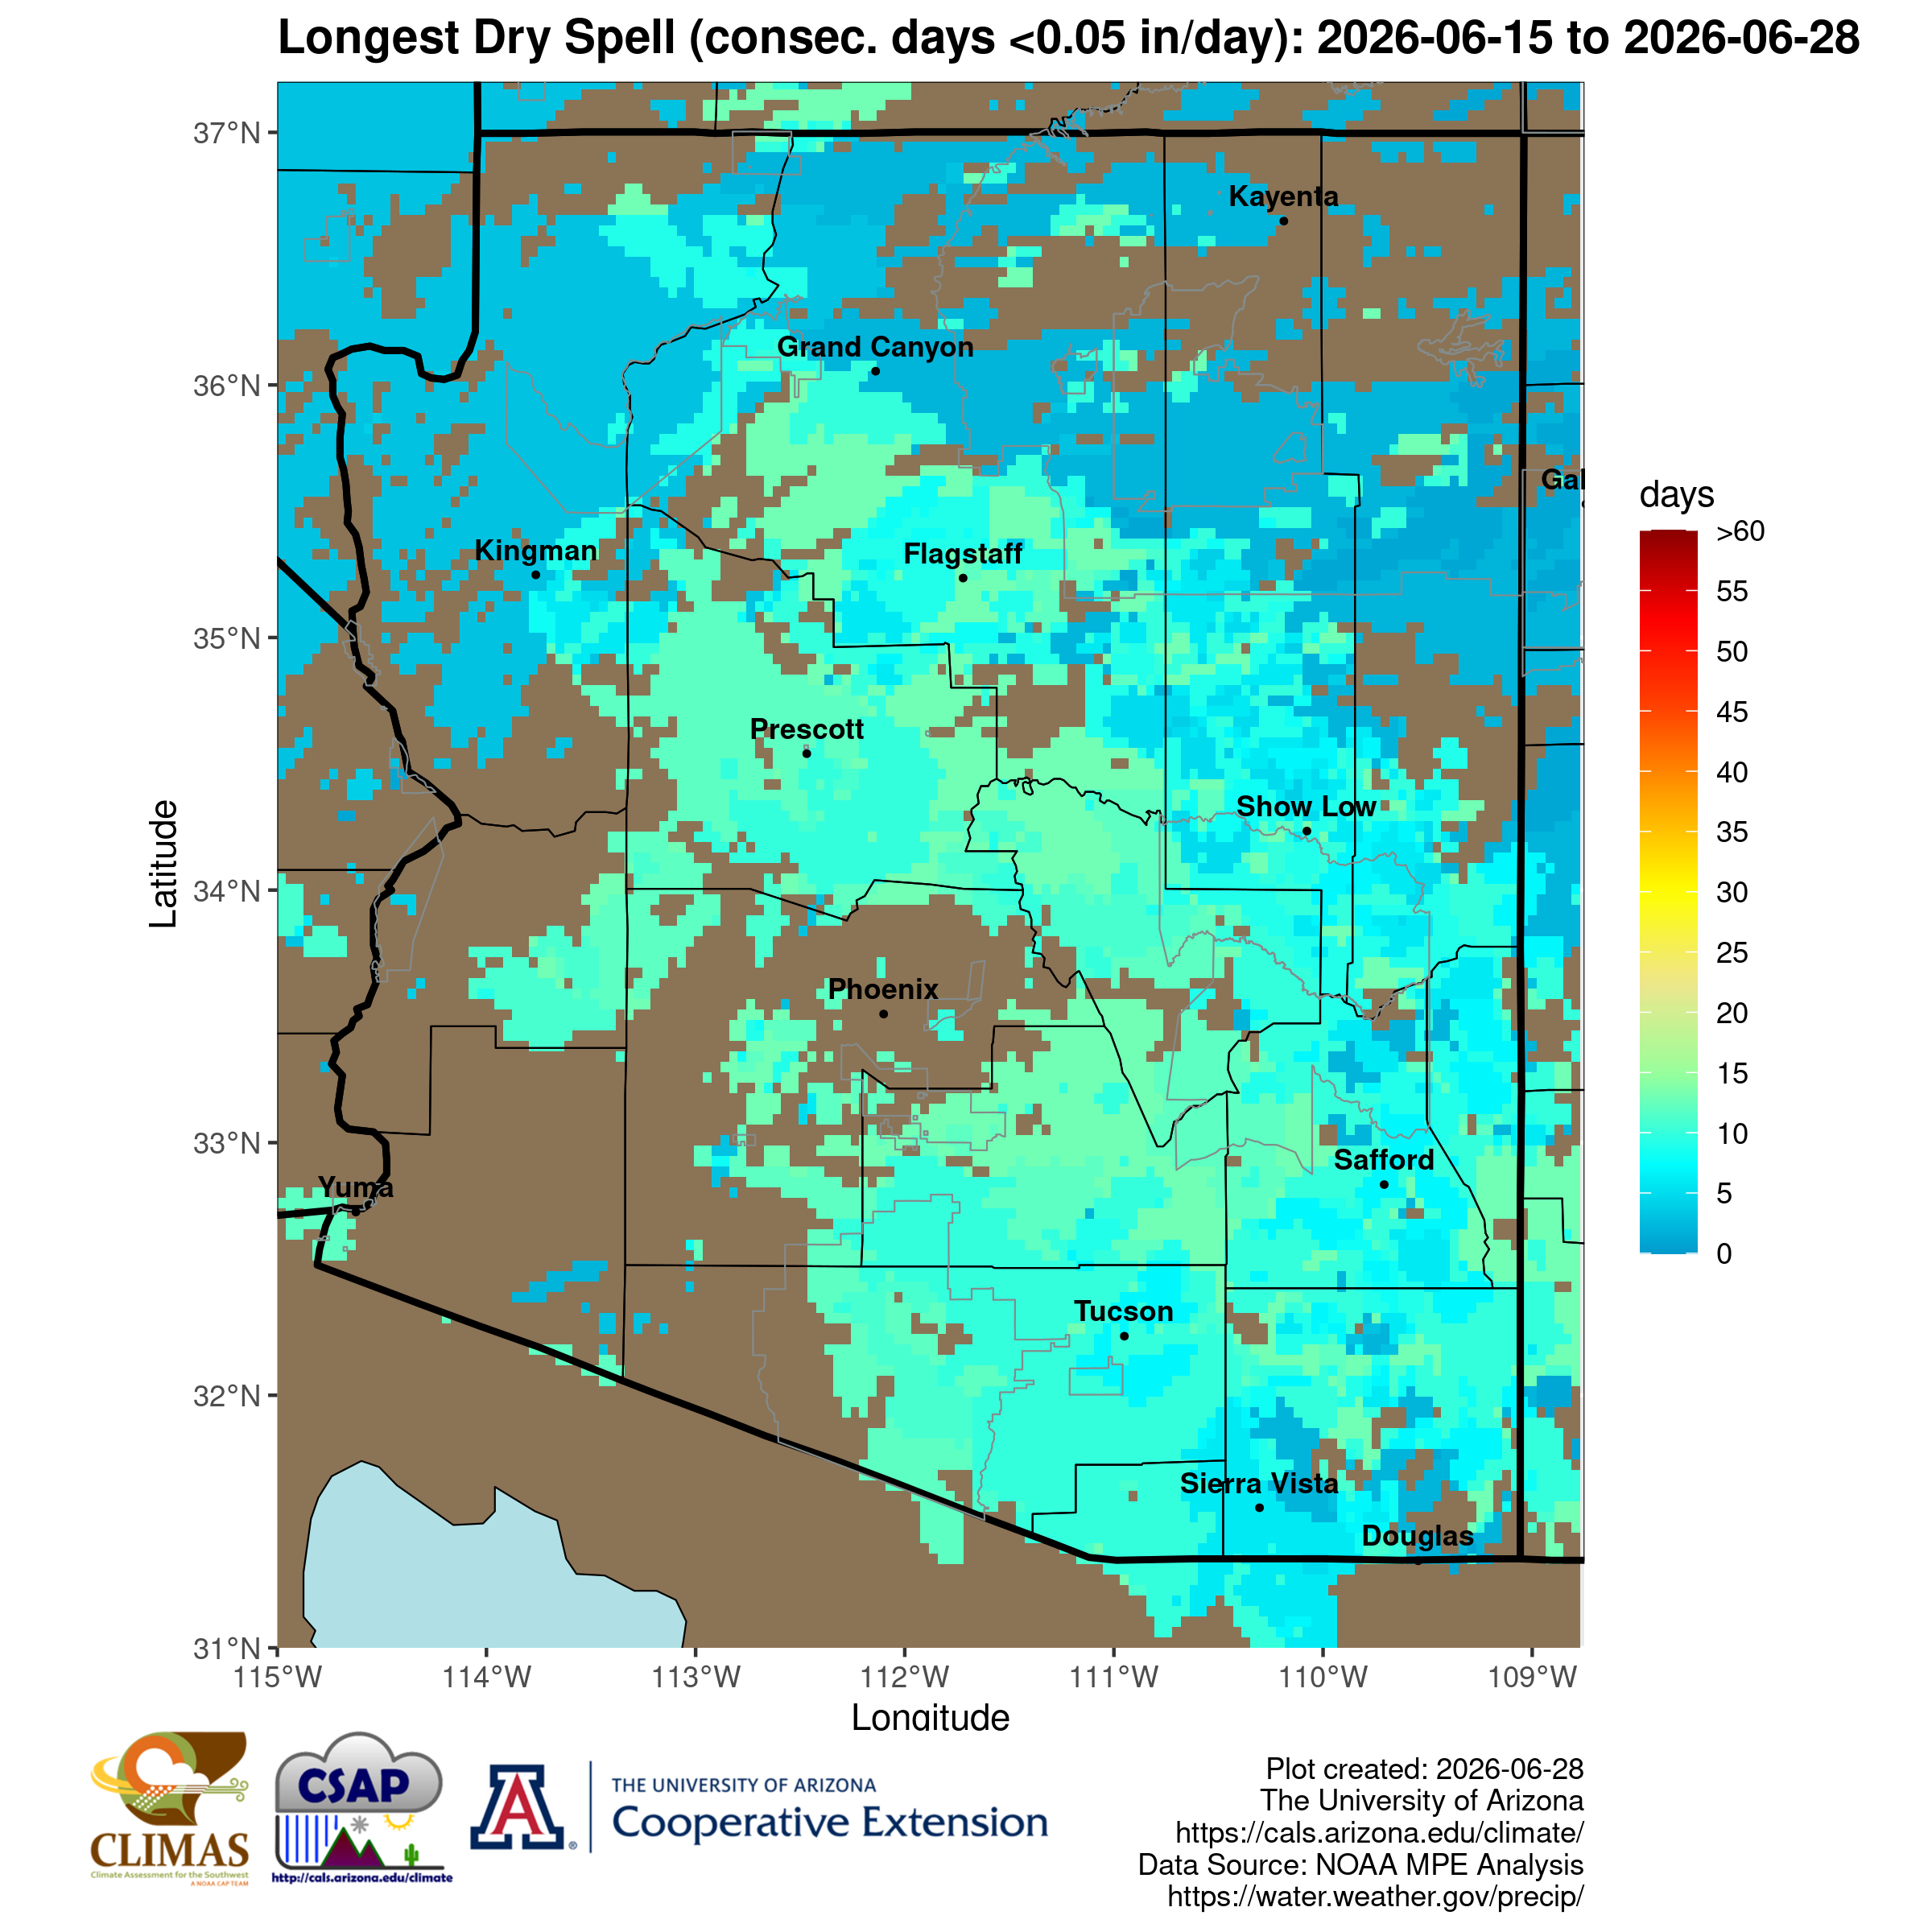
Longest dry spell: The longest stretch of days with less than 0.05” of precipitation after the first 0.05” rain event of the season. Areas that have not yet received at least 0.05” are left blank. Higher values indicate prolonged monsoon breaks after rainfall has begun.
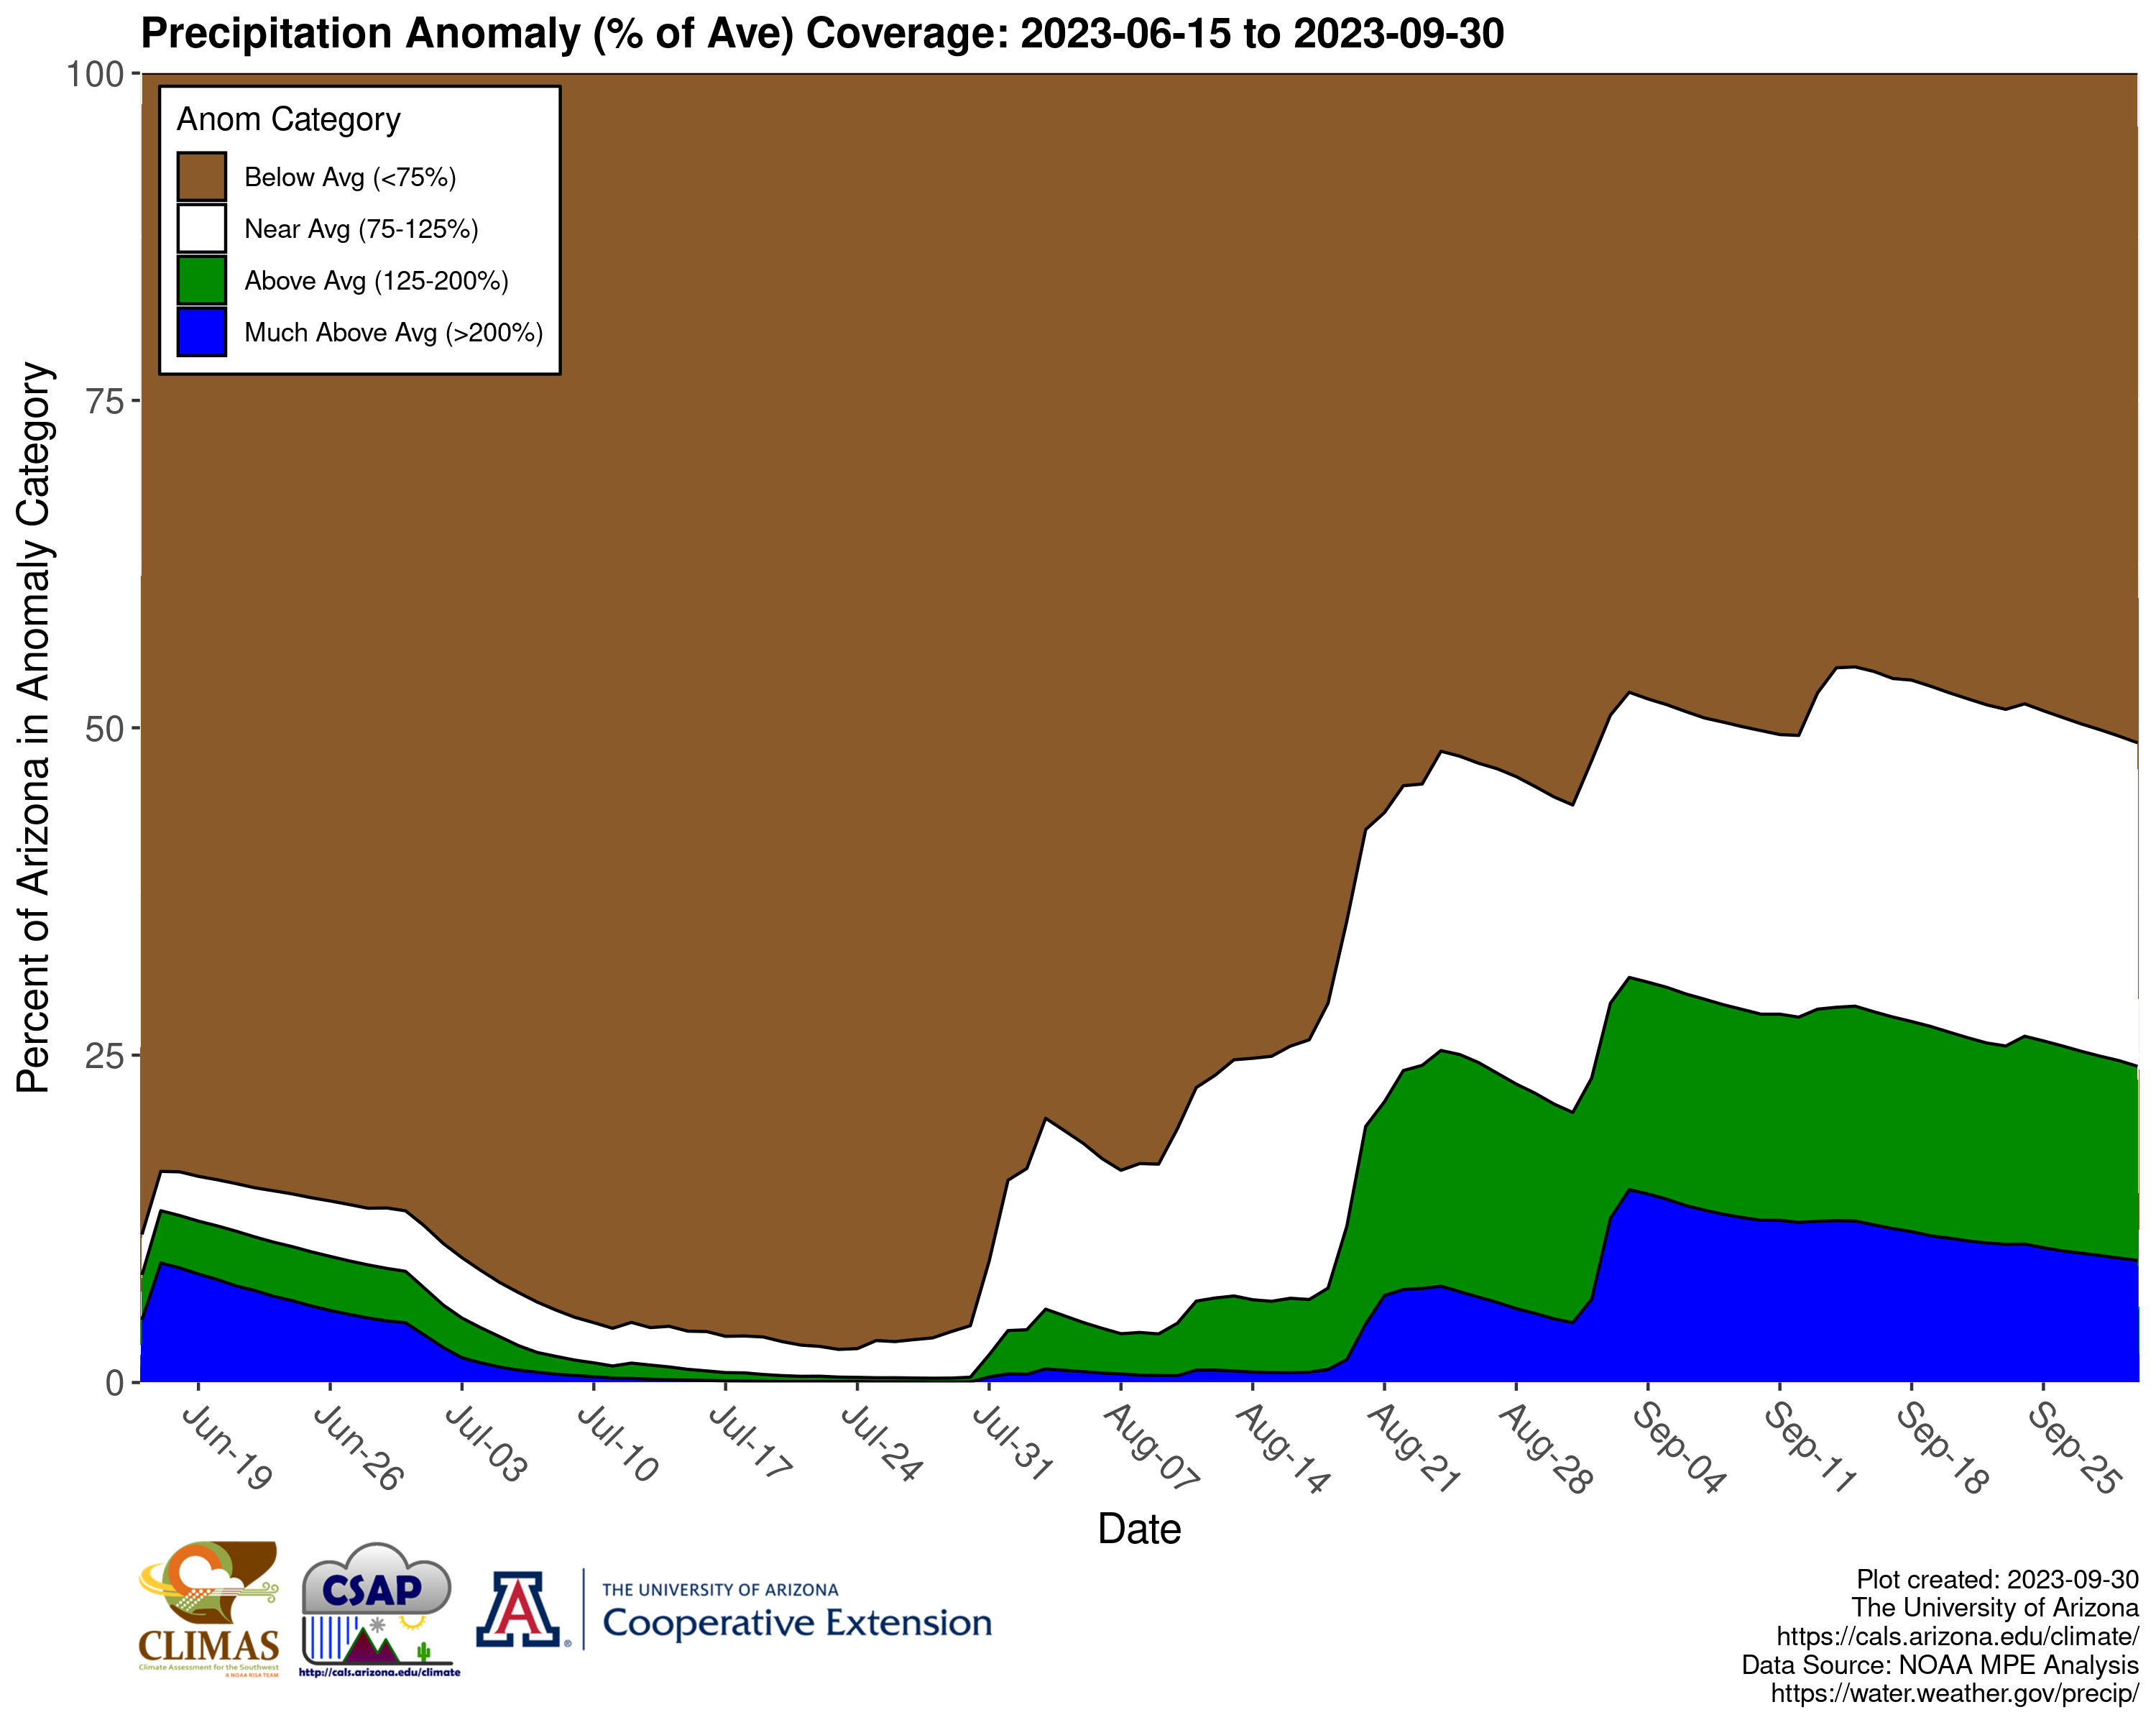
Daily change in precipitation anomaly coverage: This figure depicts the daily change in the coverage of different categories of precipitation anomalies or differences from average. It is calculated by counting the number of grid cells in each anomaly category (e.g. below or above average) each day and then dividing it by the total number of grid cells for Arizona. For example, if the brown or below average category is greatest for any given day, then that indicates most of the state was observing below average precipitation.
Other SW monsoon season resources:
- Tucson - National Weather Service Monsoon Tracker
- Overview of Arizona and the North American Monsoon System
- CLIMAS Monsoon Overview Page
- North American Monsoon Experiment Webpage
- NOAA Climate Prediction Center Monsoon Monitoring
- Arizona Regional WRF Model Forecasts
