
< Back to Climate Viticulture Newsletter
Hello, everyone!
This is the February 2025 issue of the Climate Viticulture Newsletter – a quick look at some timely climate topics relevant to wine grape growing in Arizona.
IN THIS ISSUE
- A Recap of January Temperature and Precipitation
- The Outlook for February Temperature and Precipitation
- A Review of Growing Season Precipitation in 2024
- Daily Statistics of Chill and Heat Accumulation
- Extra Notes
A Recap of January Temperature and Precipitation
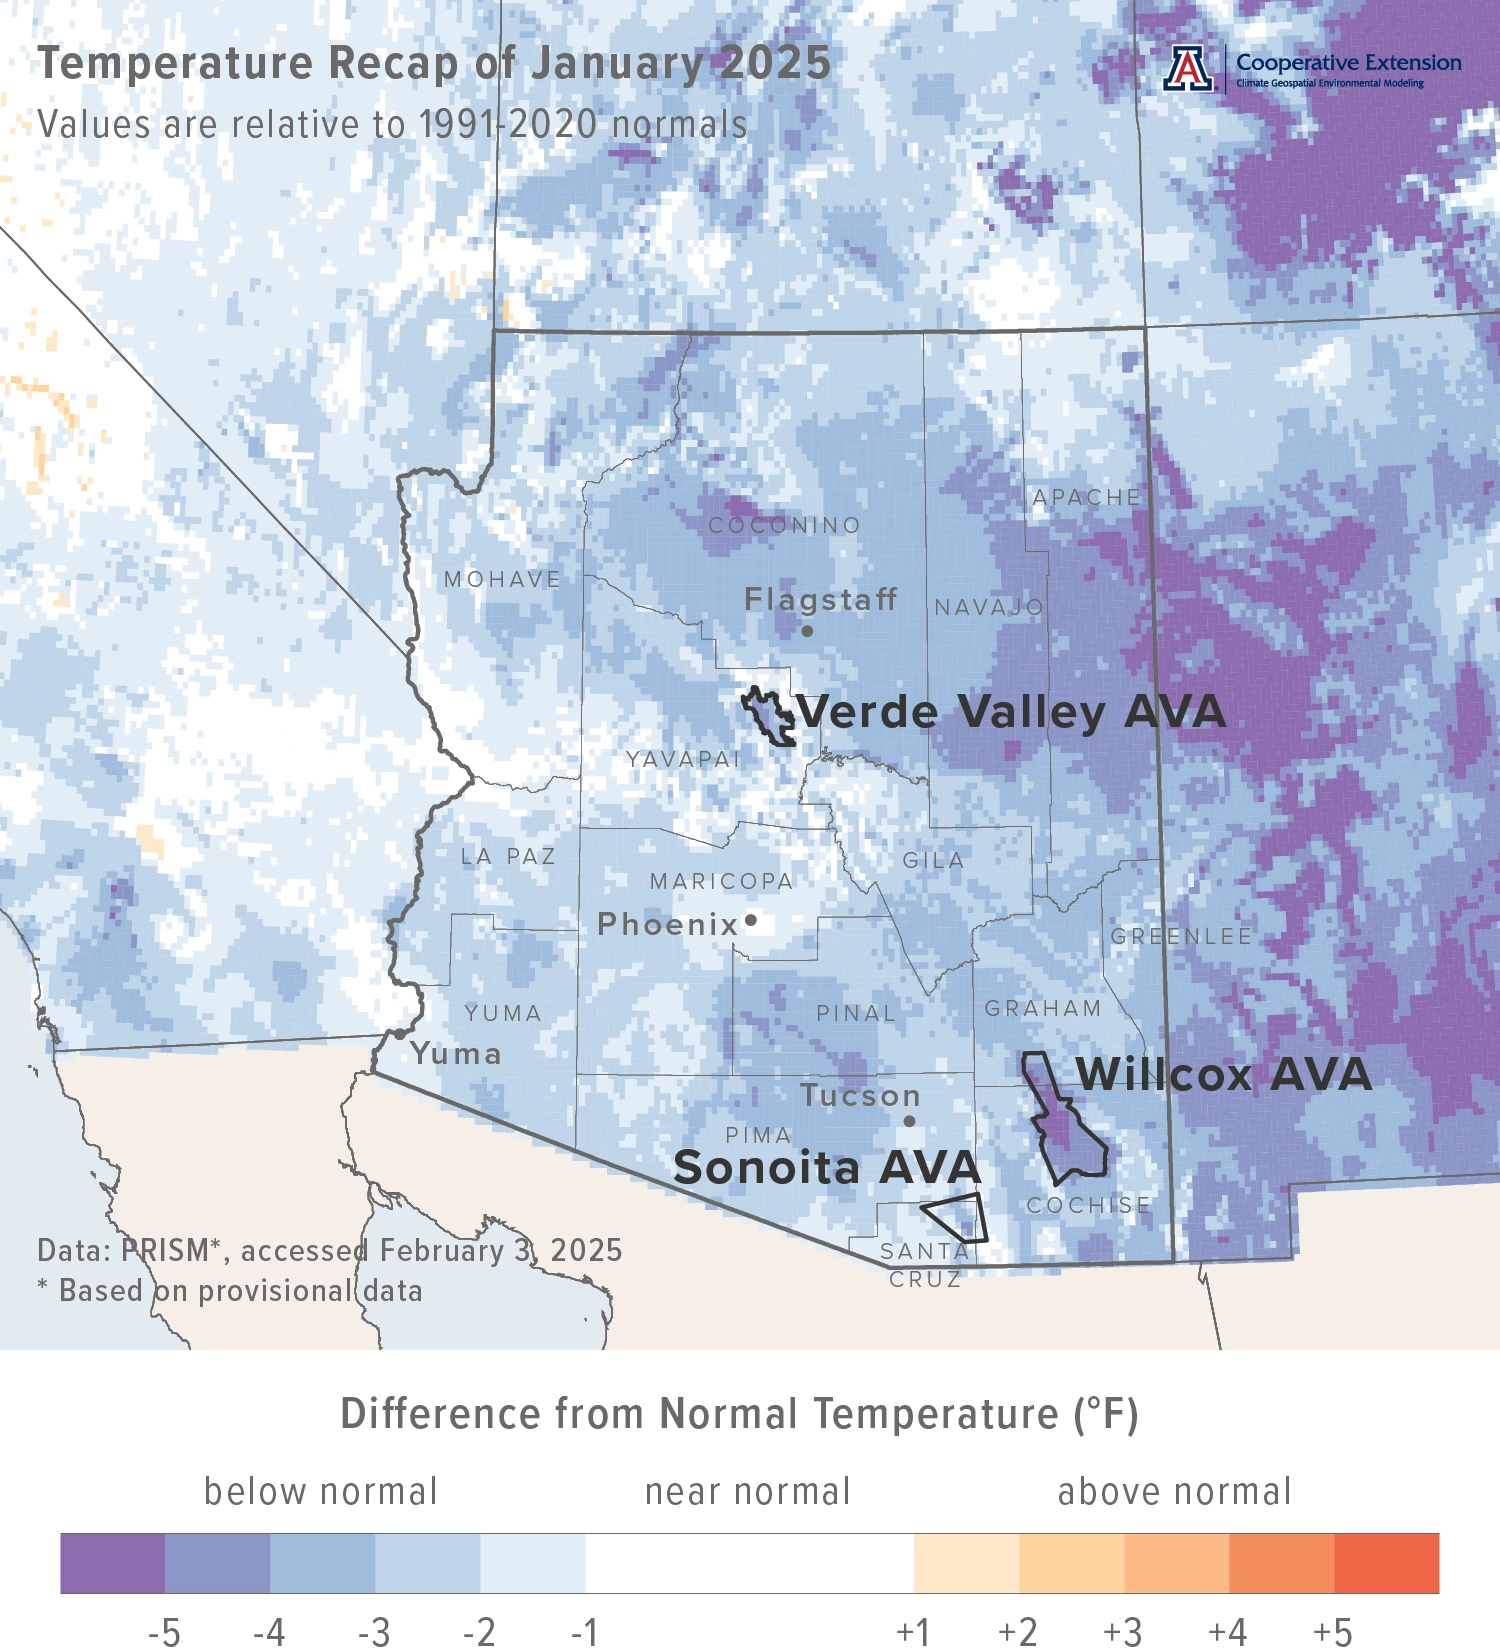
Monthly average temperatures were 1 to 4 °F below the 1991-2020 normal for much of the state (light blue, blue, and dark blue areas on map). Parts of northeastern and southeastern Arizona had temperatures 4 °F or more below normal (light purple and purple areas on map). For reference, monthly average temperatures in January last year were 1 to 3 °F below normal for much of southern, central, and western Arizona. Much of the rest of the state measured near-normal temperatures.
Area-average maximum and minimum temperatures during January 2025 were 57.9 and 27.8 °F for the Sonoita AVA, 55.4 and 27.4 °F for the Verde Valley AVA, and 57.6 and 23.2 °F for the Willcox AVA. Respective January normals are 58.7 and 31.2 °F, 58.1 and 30.6 °F, and 59.6 and 30.2 °F.
Temperature last month ranged between 72.3 and 14.2 °F at the AZMet Bonita station and between 73.8 and 12.4 °F at the AZMet Willcox Bench station.
Jeremy Weiss
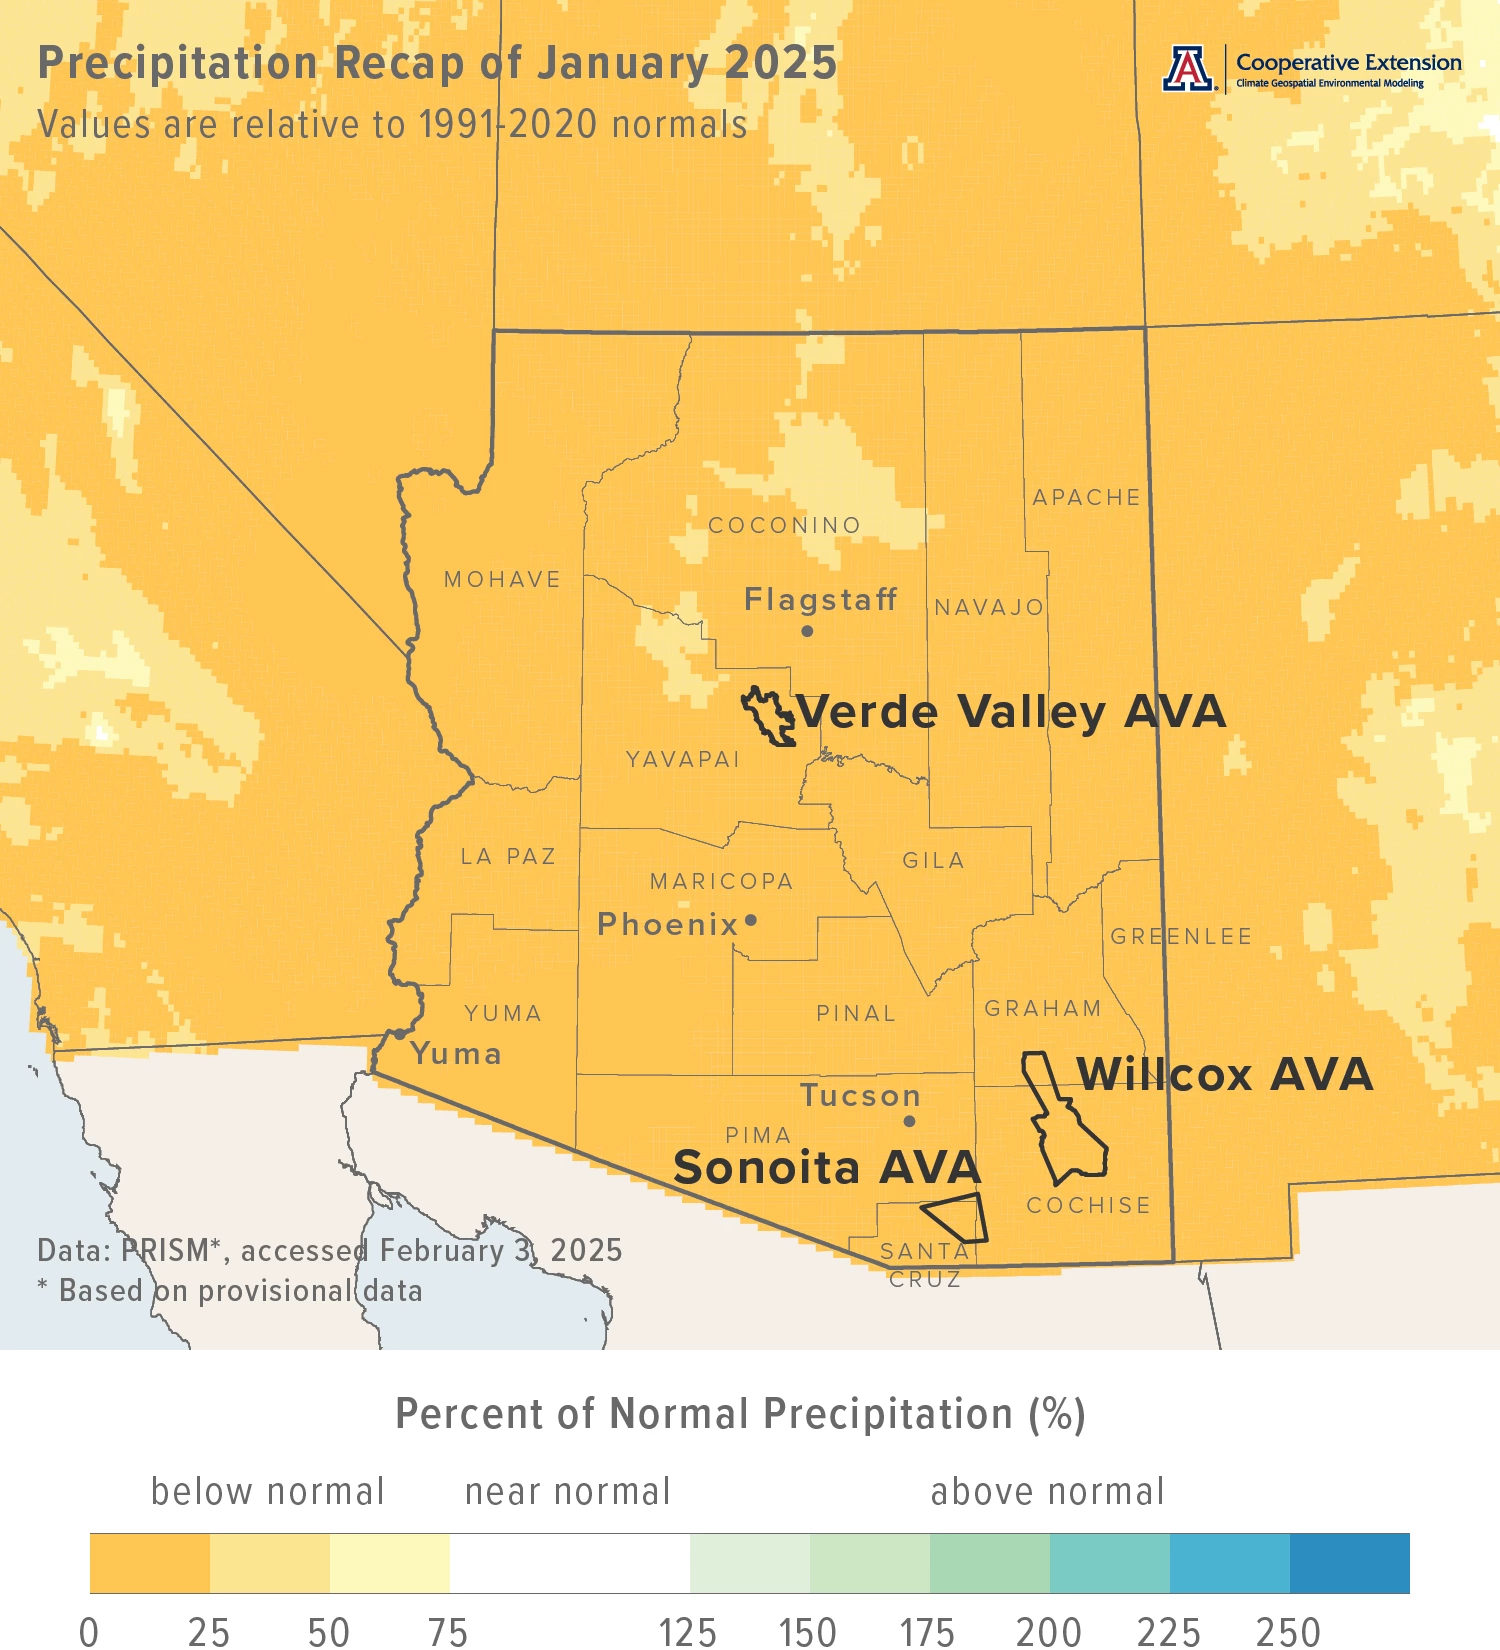
Similar to the past several months, monthly precipitation totals were below 25 % of normal for almost all of Arizona (dark yellow areas on map), including all three Arizona AVAs. Only a few locations in northern Arizona recorded below-normal totals between 25 and 50 % (yellow areas on map). Precipitation during January 2024 was more than 150 % of normal for the southern tier of the state, and less than 75 % of normal for much of central and west-central Arizona. Otherwise across the state, amounts were near normal.
Area-average total precipitation in January 2025 was 0.06 inches for the Sonoita AVA, 0.22 inches for the Verde Valley AVA, and 0.06 inches for the Willcox AVA. Respective January normals are 1.24, 1.45, and 1.07 inches.
Total precipitation last month was 0.09 and 0.00 inches at the AZMet Bonita and Willcox Bench stations, respectively.
Dig further into daily weather summaries for the AZMet Bonita and Willcox Bench stations in the Willcox AVA
Learn more about PRISM climate data
Jeremy Weiss
The Outlook for February Temperature and Precipitation
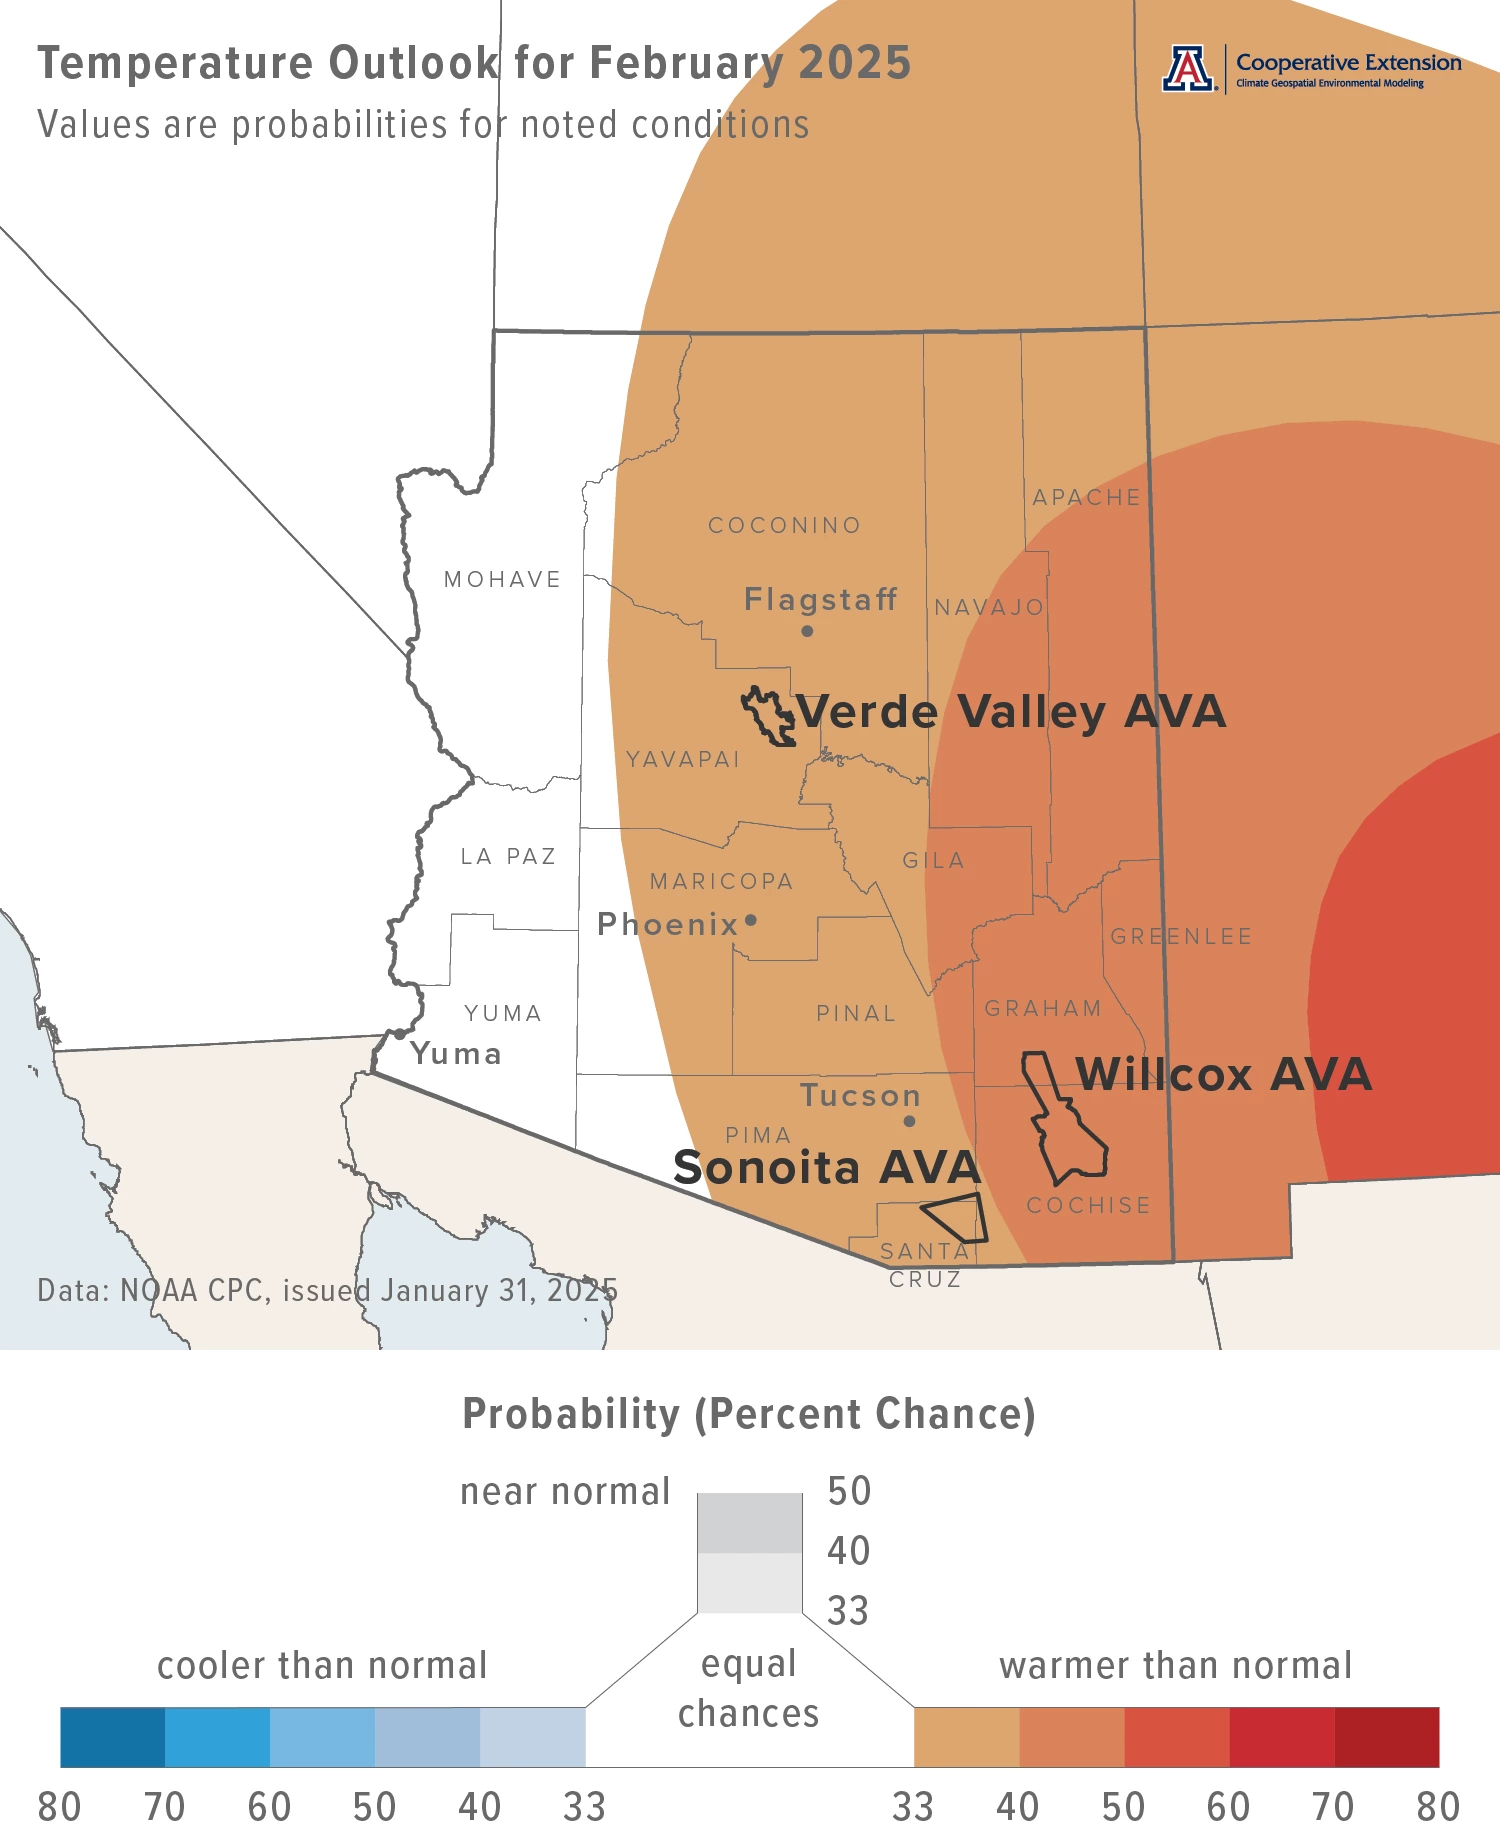
Temperatures over the course of this month have a slight increase in chances for being above the 1991-2020 normal across the eastern two-thirds of Arizona (light orange and orange areas on map). For the western one-third, there are equal chances for below-, near-, or above-normal temperatures (white area on map). Monthly average temperatures in February last year were 1 to 3 °F above normal for many areas in the eastern one-third of Arizona. Much of the rest of the state saw near-normal temperatures.
Area-average maximum and minimum temperatures during February 2024 were 61.7 and 36.5 °F for the Sonoita AVA, 61.3 and 34.3 °F for the Verde Valley AVA, and 63.5 and 34.3 °F for the Willcox AVA. Respective February normals are 61.2 and 33.2 °F, 61.6 and 32.9 °F, and 63.1 and 32.7 °F.
Temperature in February last year ranged between 78.3 and 24.8 °F at the AZMet Bonita station and between 79.5 and 26.2 °F at the AZMet Willcox Bench station.
Jeremy Weiss
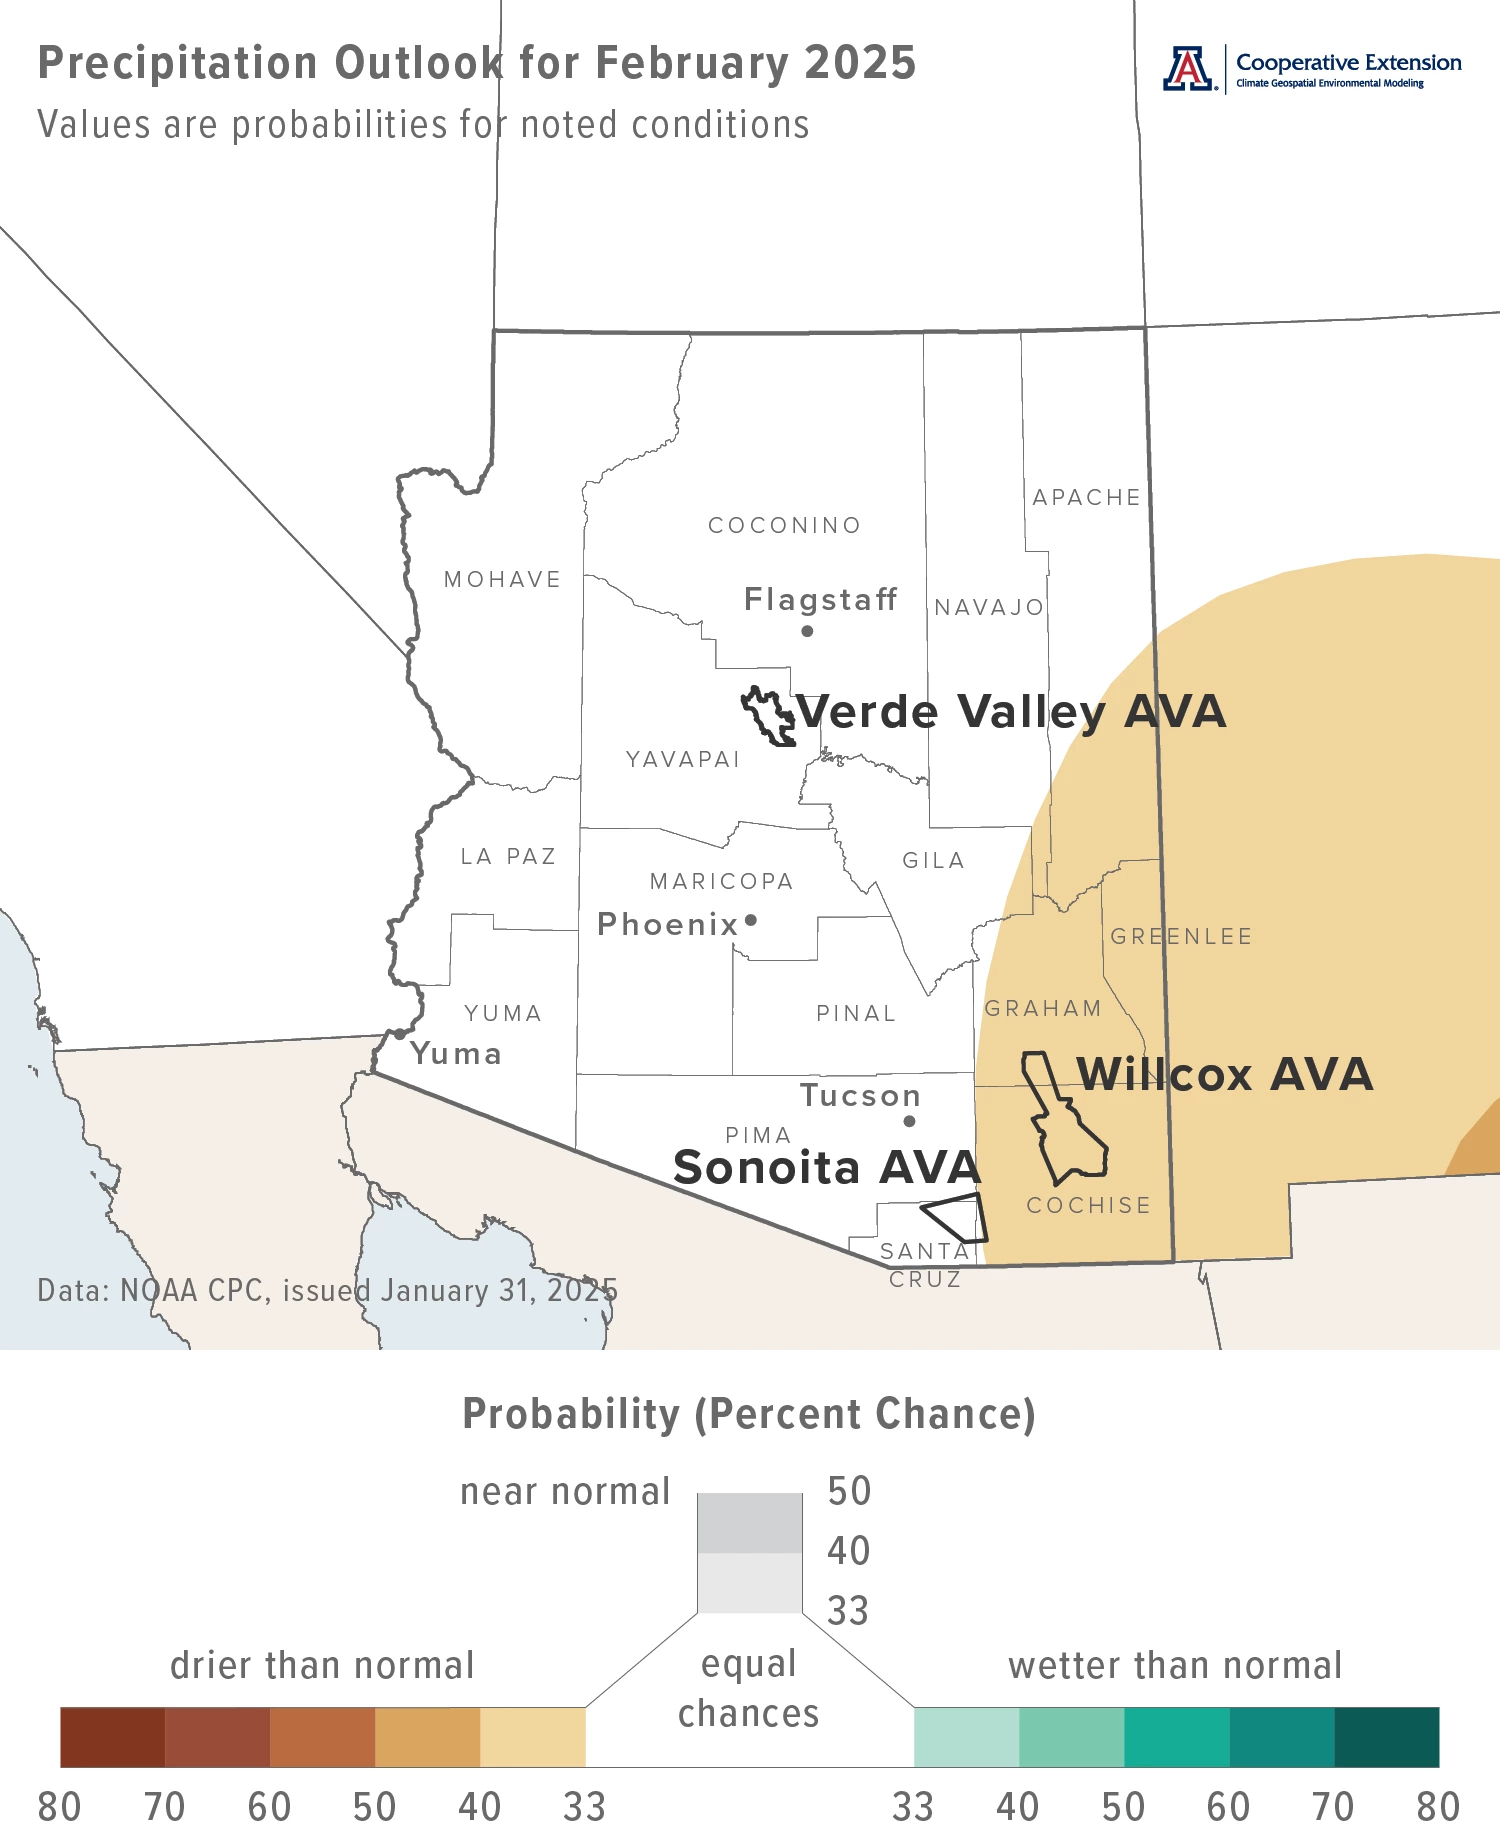
Precipitation totals for this month have a slight increase in chances for being below normal across the extreme southeastern and east-central parts of the state (light tan area on map). For the rest of Arizona, there are equal chances for below-, near-, or above-normal totals (white area on map). Precipitation during February 2024 was more than 150 % of normal for many areas across the north-central and southern parts of the state. Several locations in southeastern Arizona measured amounts more than 200 % of normal. Otherwise, totals mostly were near normal.
Area-average precipitation totals in February 2024 were 2.09 inches for the Sonoita AVA, 2.16 inches for the Verde Valley AVA, and 1.62 inches for the Willcox AVA. Respective February normals are 1.12, 1.43, and 0.93 inches.
Total precipitation in February last year was 0.97 and 1.27 inches at the AZMet Bonita and Willcox Bench stations, respectively.
To stay informed of long-range temperature and precipitation possibilities beyond the coverage of a standard weather forecast, check in, too, with the six-to-ten-day outlook and eight-to-fourteen-day outlook issued daily by NOAA’s Climate Prediction Center.
Jeremy Weiss
A Review of Growing Season Precipitation in 2024
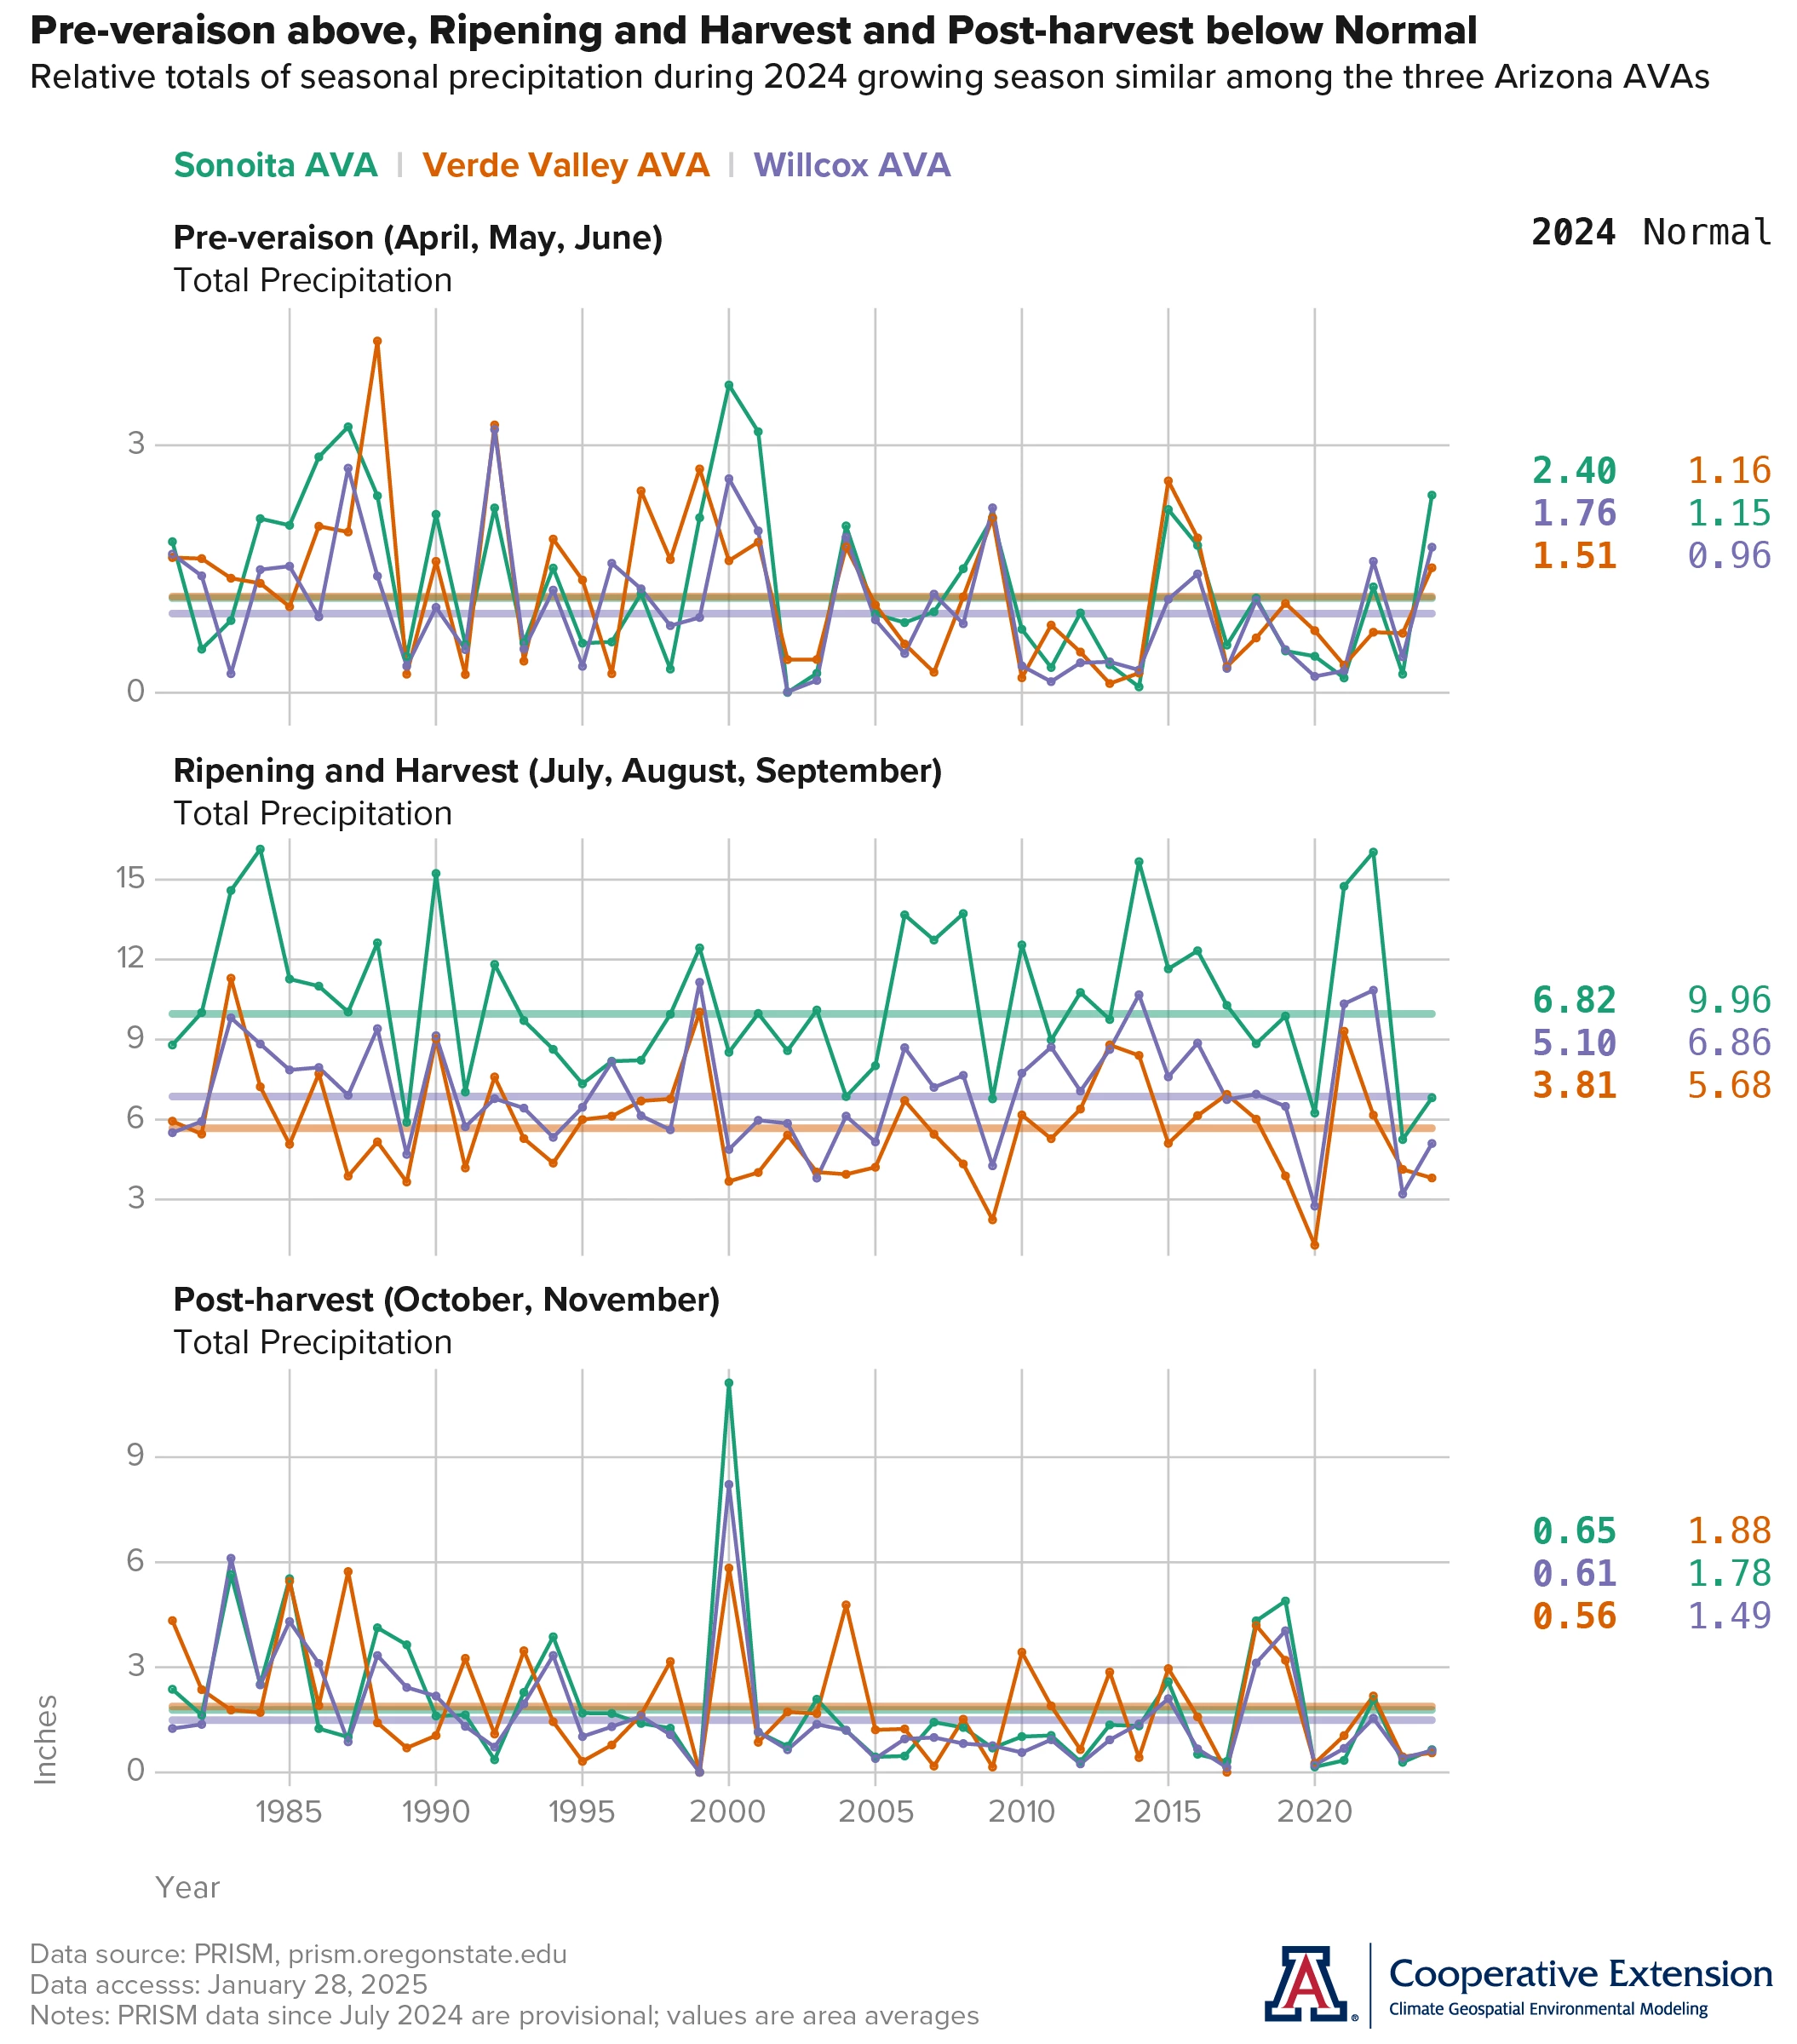
As the second part of our review of this past growing season, we focus on precipitation in the three Arizona AVAs. We again organize the information by different periods. For simplicity, pre-veraison includes the months of April, May, and June (top graph), ripening and harvest the months of July, August, and September (middle graph), and post-harvest the months of October and November (bottom graph).
Pre-veraison precipitation totals were above the 1991-2020 normal for all three AVAs (values to the right of the graphs), with amounts ranging from 1.51 inches in the Verde Valley AVA to 2.40 inches in the Sonoita AVA. The relatively wet conditions during the first part of the 2024 growing season followed a dormant season, from November 2023 through March 2024, in which precipitation totals were between 110 and 120 % of normal. Although above normal in 2024, pre-veraison totals often have been less than one inch in recent years (variable, colored lines with points on graphs), helping define what is the dry and, as the case typically is in June, hot foresummer that precedes the monsoon. The relatively low precipitation from April through June does little to counter the roughly 0.20 to 0.40 inches lost daily to evapotranspiration at this time of year, as estimated at the AZMet Bonita and Willcox Bench stations in the Willcox AVA. It does, however, help keep some disease pressure and related management needs relatively lower.
For a second consecutive year, precipitation totals for all three Arizona AVAs during the ripening and harvest period were below their respective normals (horizontal, colored lines on graphs). Relatively dry conditions perhaps were most noticeable for the Sonoita AVA, where the deficit was on the order of about three inches. Deficits in the Verde Valley and Willcox AVAs were only about one-and-a-half to two inches. Also noticeable for the Sonoita and Willcox AVAs was having relatively dry conditions in 2023 and 2024 follow two vintages with near-record to record rainfall during ripening and harvest. For the Verde Valley AVA, relatively wet conditions only appeared in 2021 with seasonal rainfall totals near normal in 2022. Identifying varieties that did a better job handling either, or both, the hot-and-dry and cool-and-wet conditions of the past few years at this time of the growing season could help with varietal selection and hedging against challenging monsoon conditions.
Also for a second consecutive year, post-harvest precipitation totals were below normal for all three Arizona AVAs. Seasonal totals were less than one inch, as often has been the case in recent years, and about 30 to 40 % drier than normal amounts of about one-and-a-half to two inches. With the growing season winding down and wrapping up, rainfall at this time of the year factors into some post-harvest activities like establishment of winter cover crops.
Jeremy Weiss
Daily Statistics of Chill and Heat Accumulation
We return now to our new project about the effects of Arizona climate on the timing of wine grape growth stages. During the project, we’ll be looking at how chill and heat accumulation, and soil temperature, during the dormant season correspond to bud break dates, and how heat accumulation during the growing season corresponds to time between bud break, flowering, and veraison. Last December, the topic was seasonal accumulation of growing degree days. This month, we examine some daily statistics of chill and heat accumulation throughout the year based on hourly temperature data from the AZMet Willcox Bench station in the Willcox AVA.
For chill accumulation, we analyze chill portions, a variable that we’ve used often in assessing the start of the growing season. Here, chill portions are based on the dynamic model described in Erez et al. (1990). Developed to simulate the complex effects of temperature on what the authors term ‘rest breaking’, the model incorporates a nonlinear increase in chilling effect with temperatures from 28.4 °F (-2.0 °C) to 44.6 °F (7.0 °C), and a nonlinear decrease from 44.6 °F to 55.4 °F (13.0 °C). There is no chilling effect from temperatures below 28.4 °F or above 55.4 °F. The model also incorporates effects of ‘moderate’ and ‘high’ temperatures, which can enhance or negate, respectively, chilling effect depending on their magnitude, duration, and fluctuation with temperatures that have a chilling effect. Several publications regard this combination of features as a better way to calculate chill accumulation, in areas with relatively mild winters, as we consider the Willcox AVA.
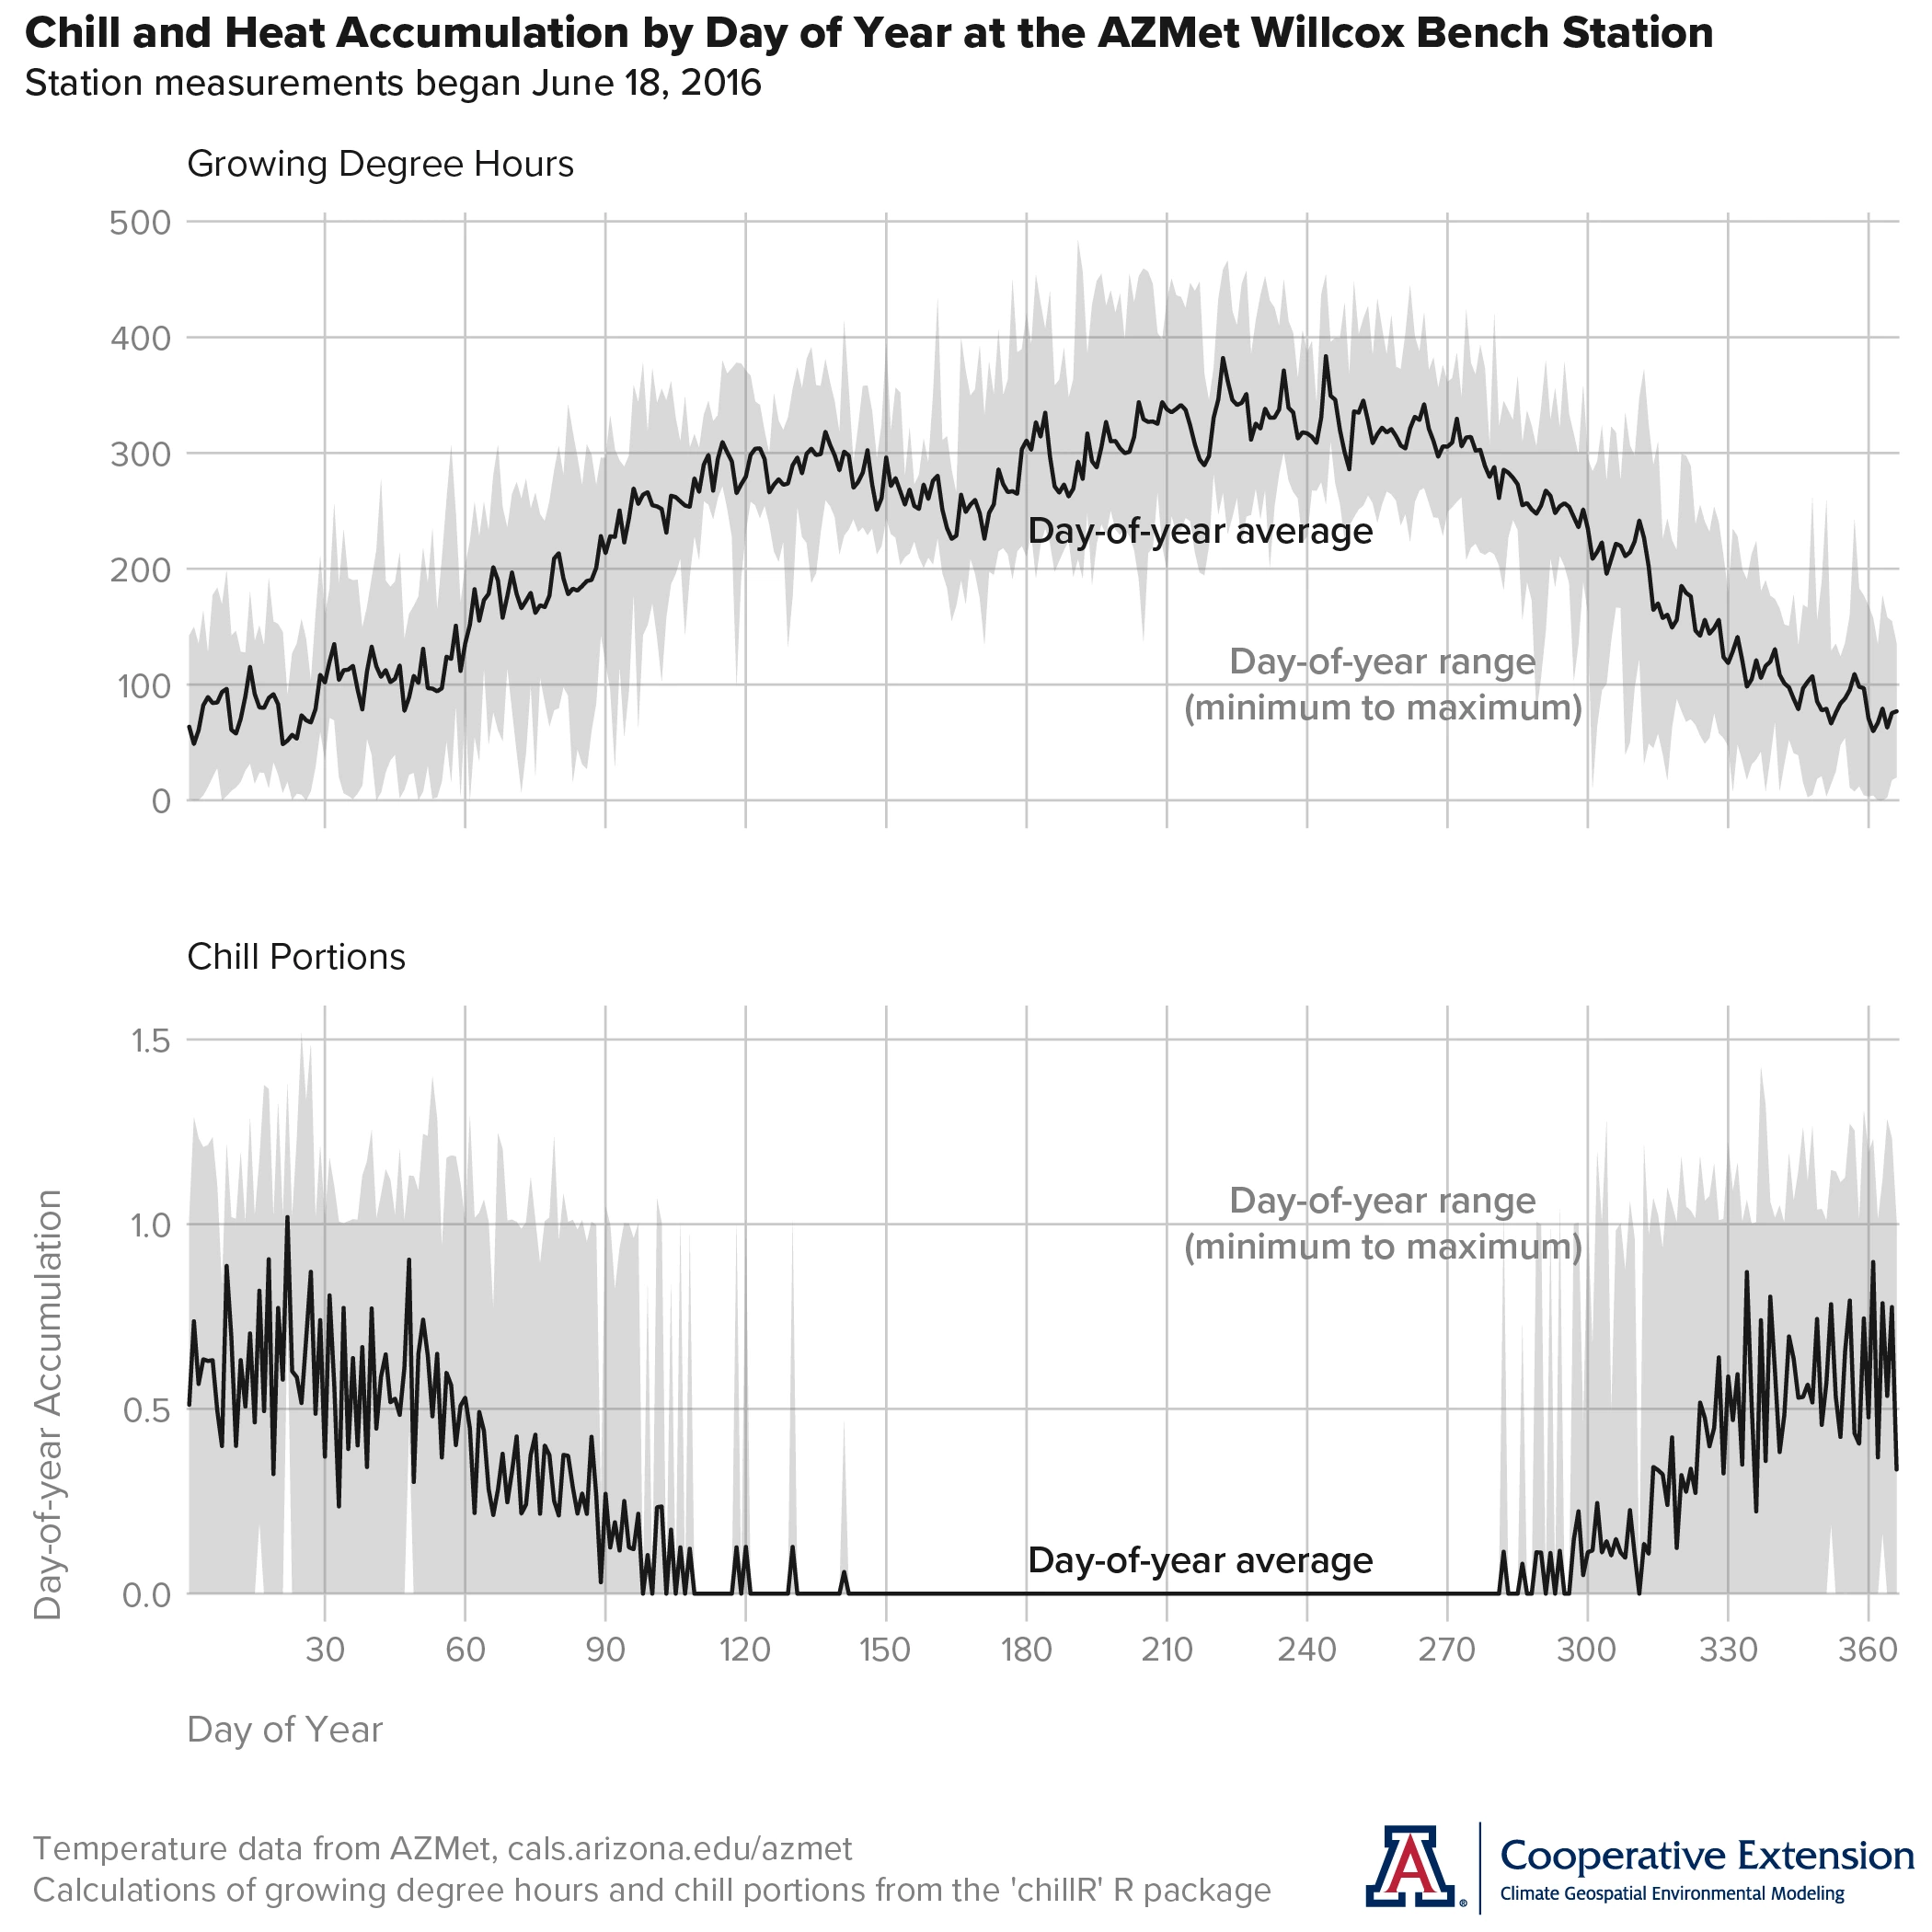
Generally, average day-of-year values of chill portions (black line in lower graph) are relatively high and level during January and February (approximately days of year 1 through 60). During March and April (approximately days of year 60 through 120), values decrease to zero, where they remain into October (approximately days of year 270 through 300). Chill portions increase during November before levelling off in December (approximately days of year 300 through 365 or 366, depending on leap years), at the highest values during the year and similar to those in January and February. The gray-shaded area (lower graph) represents the range of chill portions, or difference between the maximum and minimum values, on a given day of year.
One can map seasonal temperatures at the AZMet Willcox Bench station to this pattern of average values to better understand this model and chill accumulation throughout the year. Regarding only temperatures between 28.4 and 55.4 °F, for example, hourly average temperatures during January and February often are in this range of chilling effect (figure not shown). During March and April, hourly average temperatures are decreasingly in this chilling-effect range and increasingly warmer than it, which, at least in part, explains the decrease of day-of-year accumulation of chill portions towards zero over the course of these months. Given temperatures during the warmer months of the year, chill portions unsurprisingly do not accumulate again until the latter half of October. Average hourly temperatures increasingly fall in this chilling-effect range during November and occur often in this range in December. Thus, values of chill portions increase and level off during these months.
For heat accumulation, we analyze growing degree hours, a variable that we’ve mentioned in a past issue or two but not used typically in assessing the start of the growing season. Here, growing degree hours are based on a model described in Anderson et al. (1986). This model outputs a nonlinearly increasing number of growing degree hours between a base temperature of 39.2 °F (4.0 °C) and an optimal temperature of 77.0 °F (25.0 °C). Above the optimal temperature, the model outputs a nonlinearly decreasing number of growing degree hours until an upper, or critical, temperature of 96.8 °F (36.0 °C). Growing degree hours do not accumulate, that is, they have a value of zero, when an hourly average temperature is below the base temperature or above the upper temperature.
Generally, average day-of-year values of growing degree hours (black line in upper graph) are relatively low and increase slowly during January and February (approximately days of year 1 through 60). During March and April (approximately days of year 60 through 120), values increase more rapidly before leveling off in May and decreasing in June (approximately days of year 120 through 180). Growing degree hours increase again during July before leveling off again, this time at the highest average values of the growing season, in August and September (approximately days of year 180 through 270). From October through December (approximately days of year 270 through 365 or 366, depending on leap years), values decrease rapidly until close to the end of the calendar year when the decrease becomes less rapid. The gray-shaded area (upper graph) represents the range of growing degree hours, or difference between the maximum and minimum values, on a given day of year.
One also can map seasonal temperatures at the AZMet Willcox Bench station to this pattern of average values to better understand this model and heat accumulation throughout the year. Hourly average temperatures during January and February do occur above the base temperature (39.2 °F), but rarely near the optimal temperature (77.0 °F; figure not shown), which explains relatively low and slowly increasing values of growing degree hours. Hourly average temperature increasingly is more often near the optimal temperature from March through May, hence values increase more rapidly and level off at relatively high values. Decreasing values in June suggest hourly average temperatures more often near and above the upper temperature (96.8 °F) and less often near the optimal one, whereas values increasing again and levelling off from July through September indicate moderation of the hottest summer temperatures, due to higher humidity, cloud cover, and rain from the monsoon, but summertime heat, nonetheless. As hourly average temperatures decrease during the rest of autumn and into the start of winter, they occur less frequently near the optimal temperature and more frequently near the base temperature. Thus, values of growing degree hours decrease over these months.
Whether or not these models or the specified temperature thresholds are the best for predicting wine grape phenology in Arizona remains to be seen. Nonetheless, their presence in the scientific literature and in practice brings them up for consideration in this explore-and-understand phase of the project.
Funding for the project is made possible by a grant and cooperative agreement from the U.S. Department of Agriculture (USDA) Agricultural Marketing Service, with additional administrative support from the Arizona Department of Agriculture.
Jeremy Weiss
Extra Notes
A variety of influences look to be acting on where the winter storm track will track over North America – and if it will track over the Southwest – during February, including a long-awaited and weak La Niña event and other global climate phenomena like the Madden-Julian Oscillation and the Arctic Oscillation. Regarding the first, odds are 59 % for La Niña conditions to persist during the February-through-March 2025 period, with a 60 % chance that ENSO-neutral conditions return during the March-through-May 2025 period. Besides being a weak La Niña event, this forecast also indicates one of short duration, which implies that the typical below-normal totals of seasonal precipitation in the southwest resulting from this ENSO phase may be less likely.
For those of you in southeastern Arizona, including the Sonoita and Willcox AVAs, Cooperative Extension manages an email listserv in coordination with the Tucson forecast office of the National Weather Service to provide information in the days leading up to agriculturally important events, like cold-air outbreaks and the occasional winter storm. Please contact us if you'd like to sign up.
And for those of you in north-central and northeastern Arizona, including the Verde Valley AVA, Cooperative Extension also now manages an email listserv in coordination with the Flagstaff forecast office of the National Weather Service to provide similar information for this part of the state. Please contact us if you'd like to sign up.
Undergraduate students in the College of Agriculture and Life Sciences at the University of Arizona are looking for internships with businesses and companies in the viticulture and winery industries. Please contact Danielle Buhrow, Senior Academic Advisor and Graduate Program Coordinator in the Department of Agricultural and Resource Economics, for more information.
Please feel free to give us feedback on this issue of the Climate Viticulture Newsletter, suggestions on what to include more or less often, and ideas for new topics.
Did someone forward you this newsletter? Please contact us to subscribe.
Have a wonderful February!
With current and past support from: