< Back to Climate Viticulture Newsletter
Hello, everyone!
This is the December 2024 issue of the Climate Viticulture Newsletter – a quick look at some timely climate topics relevant to wine grape growing in Arizona.
IN THIS ISSUE
- A Recap of November Temperature and Precipitation
- The Outlook for December Temperature and Precipitation
- Seasonal Accumulation of Growing Degree Days
- Extra Notes
A Recap of November Temperature and Precipitation
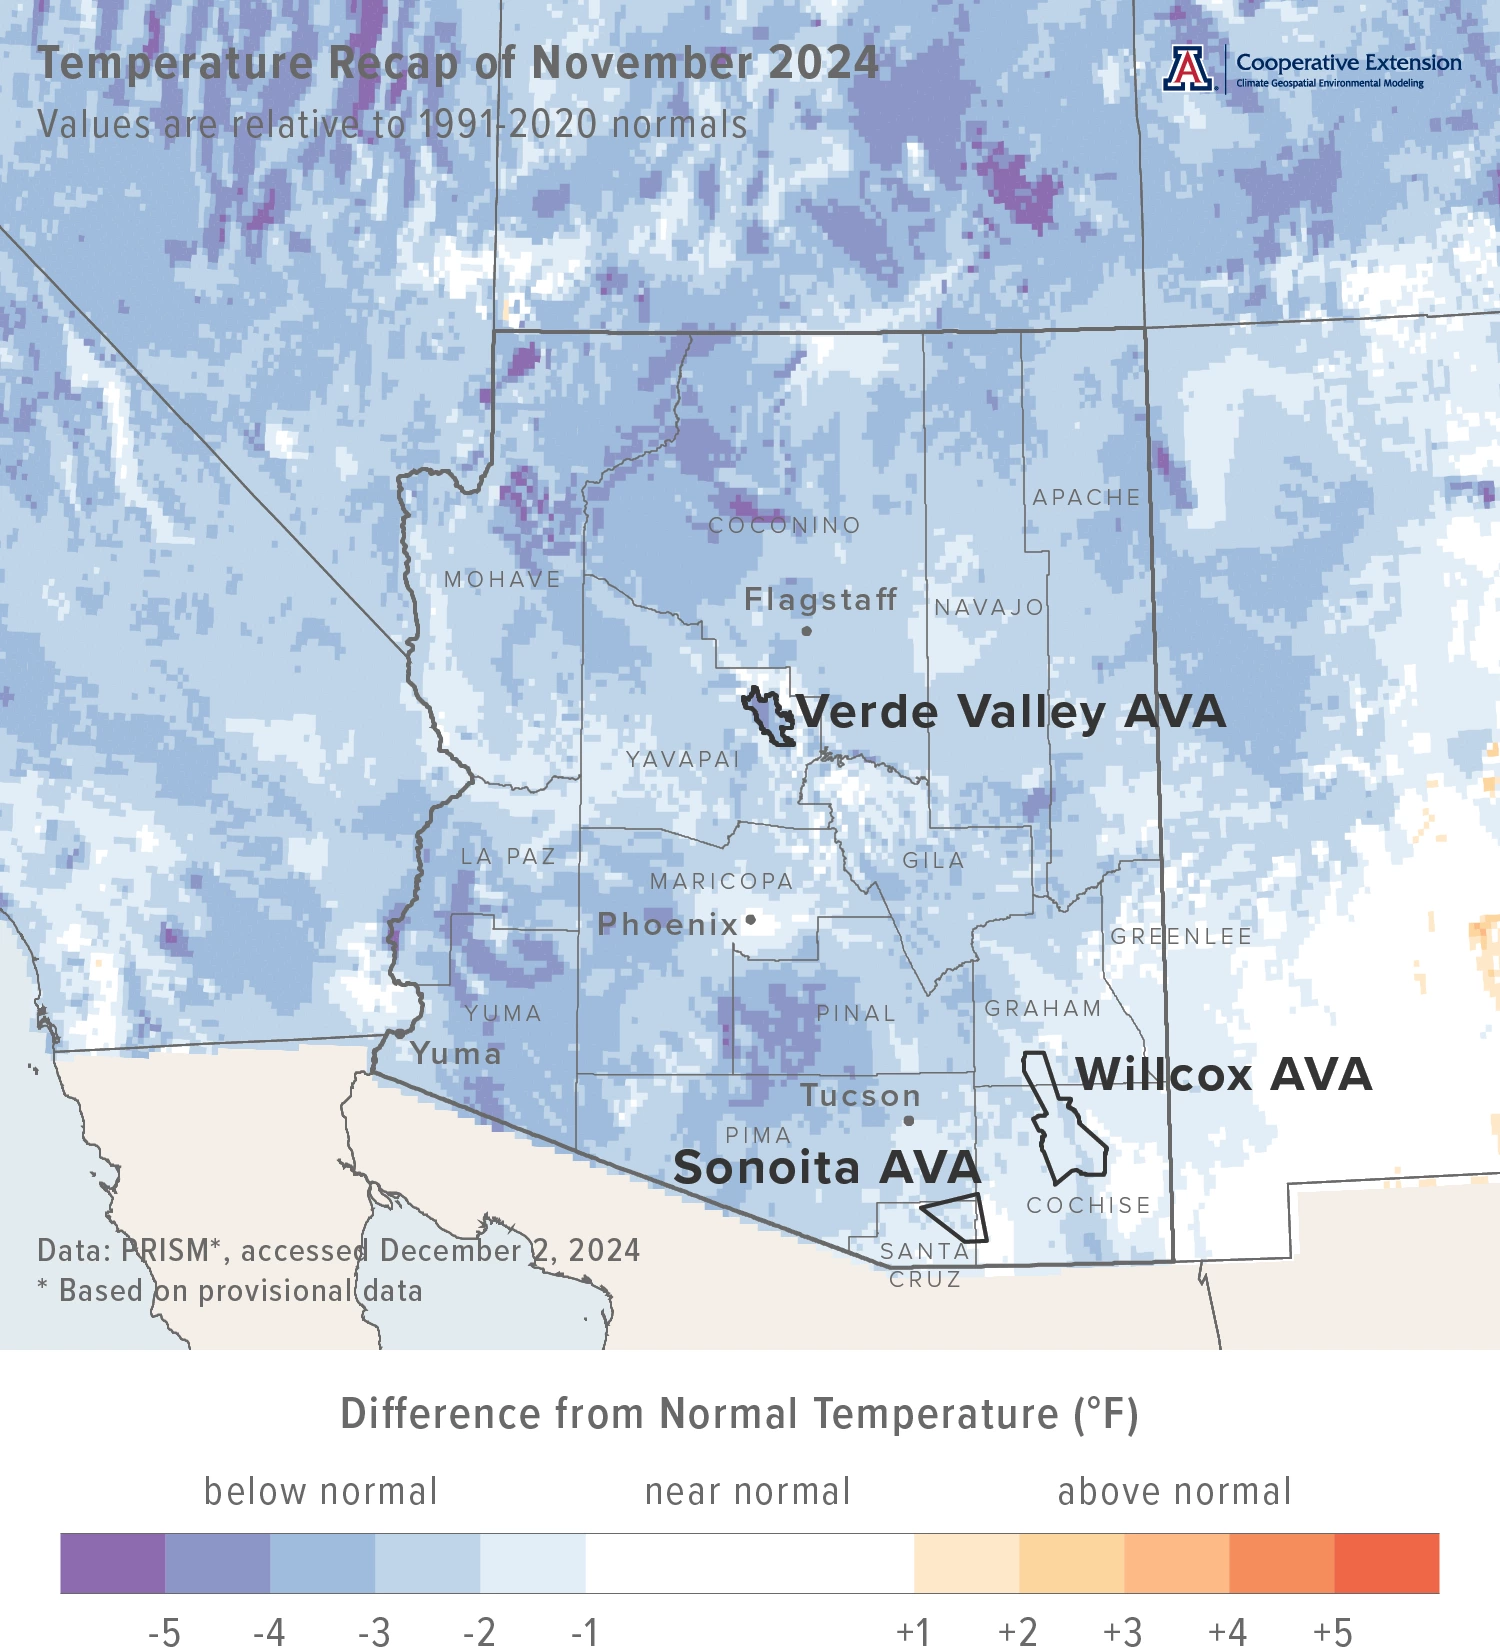
In contrast to the past several months, monthly average temperatures were 1 to 4 °F below the 1991-2020 normal for much of Arizona (light blue, blue, and dark blue areas on map), including all three Arizona AVAs. For reference, monthly average temperatures in November last year were 1 to 4 °F above normal for much of Arizona. Some locations in the central part of the state recorded values more than 4 °F above normal.
Area-average maximum and minimum temperatures during November 2024 were 66.9 and 35.3 °F for the Sonoita AVA, 64.0 and 33.9 °F for the Verde Valley AVA, and 67.7 and 34.2 °F for the Willcox AVA. Respective November normals are 67.2 and 38.2 °F, 67.5 and 36.6 °F, and 68.6 and 36.7 °F.
Temperature last month ranged between 78.3 and 23.2 °F at the AZMet Bonita station and between 82.4 and 24.1 °F at the AZMet Willcox Bench station.
Jeremy Weiss
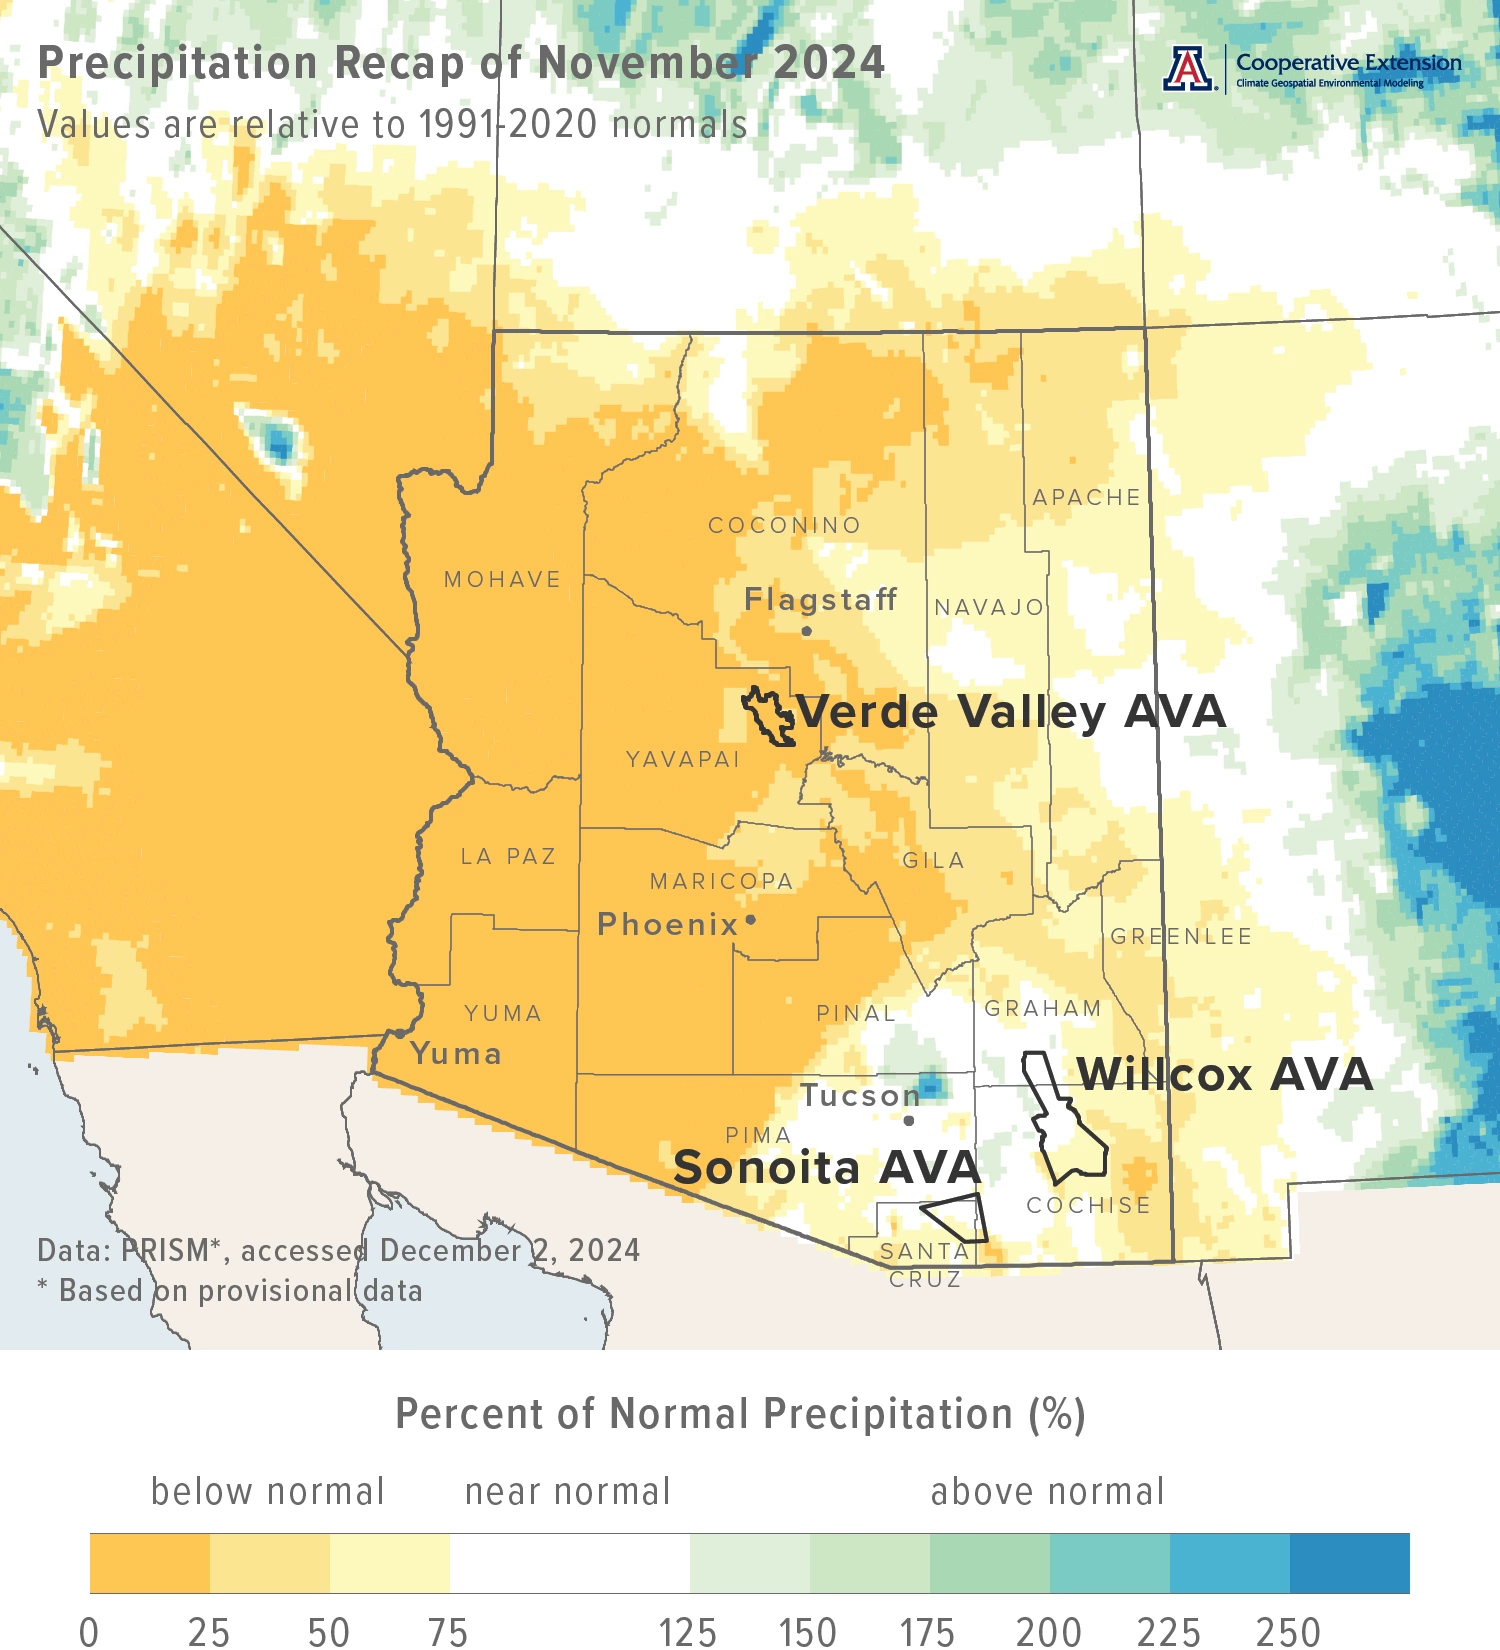
Monthly precipitation totals were less than 25 % of normal for much of the western half of the state (dark yellow areas on map), including the Verde Valley AVA. For the eastern half, amounts ranged from 25 % of normal to near normal (yellow, light yellow, and white areas on map), including the Sonoita and Willcox AVAs. Precipitation during November 2023 was less than 50 % of normal for much of the northwestern and southeastern parts of the state. Many locations in southwestern and northeastern Arizona recorded near-normal amounts, with some in the latter area measuring totals 125 to 175 % of normal.
Area-average total precipitation in November 2024 was 0.65 inches for the Sonoita AVA, 0.18 inches for the Verde Valley AVA, and 0.60 inches for the Willcox AVA. Respective November normals are 0.84, 0.83, and 0.73 inches.
Total precipitation last month was 0.32 and 0.59 inches at the AZMet Bonita and Willcox Bench stations, respectively.
Dig further into daily weather summaries for the AZMet Bonita and Willcox Bench stations in the Willcox AVA
Learn more about PRISM climate data
Jeremy Weiss
The Outlook for December Temperature and Precipitation
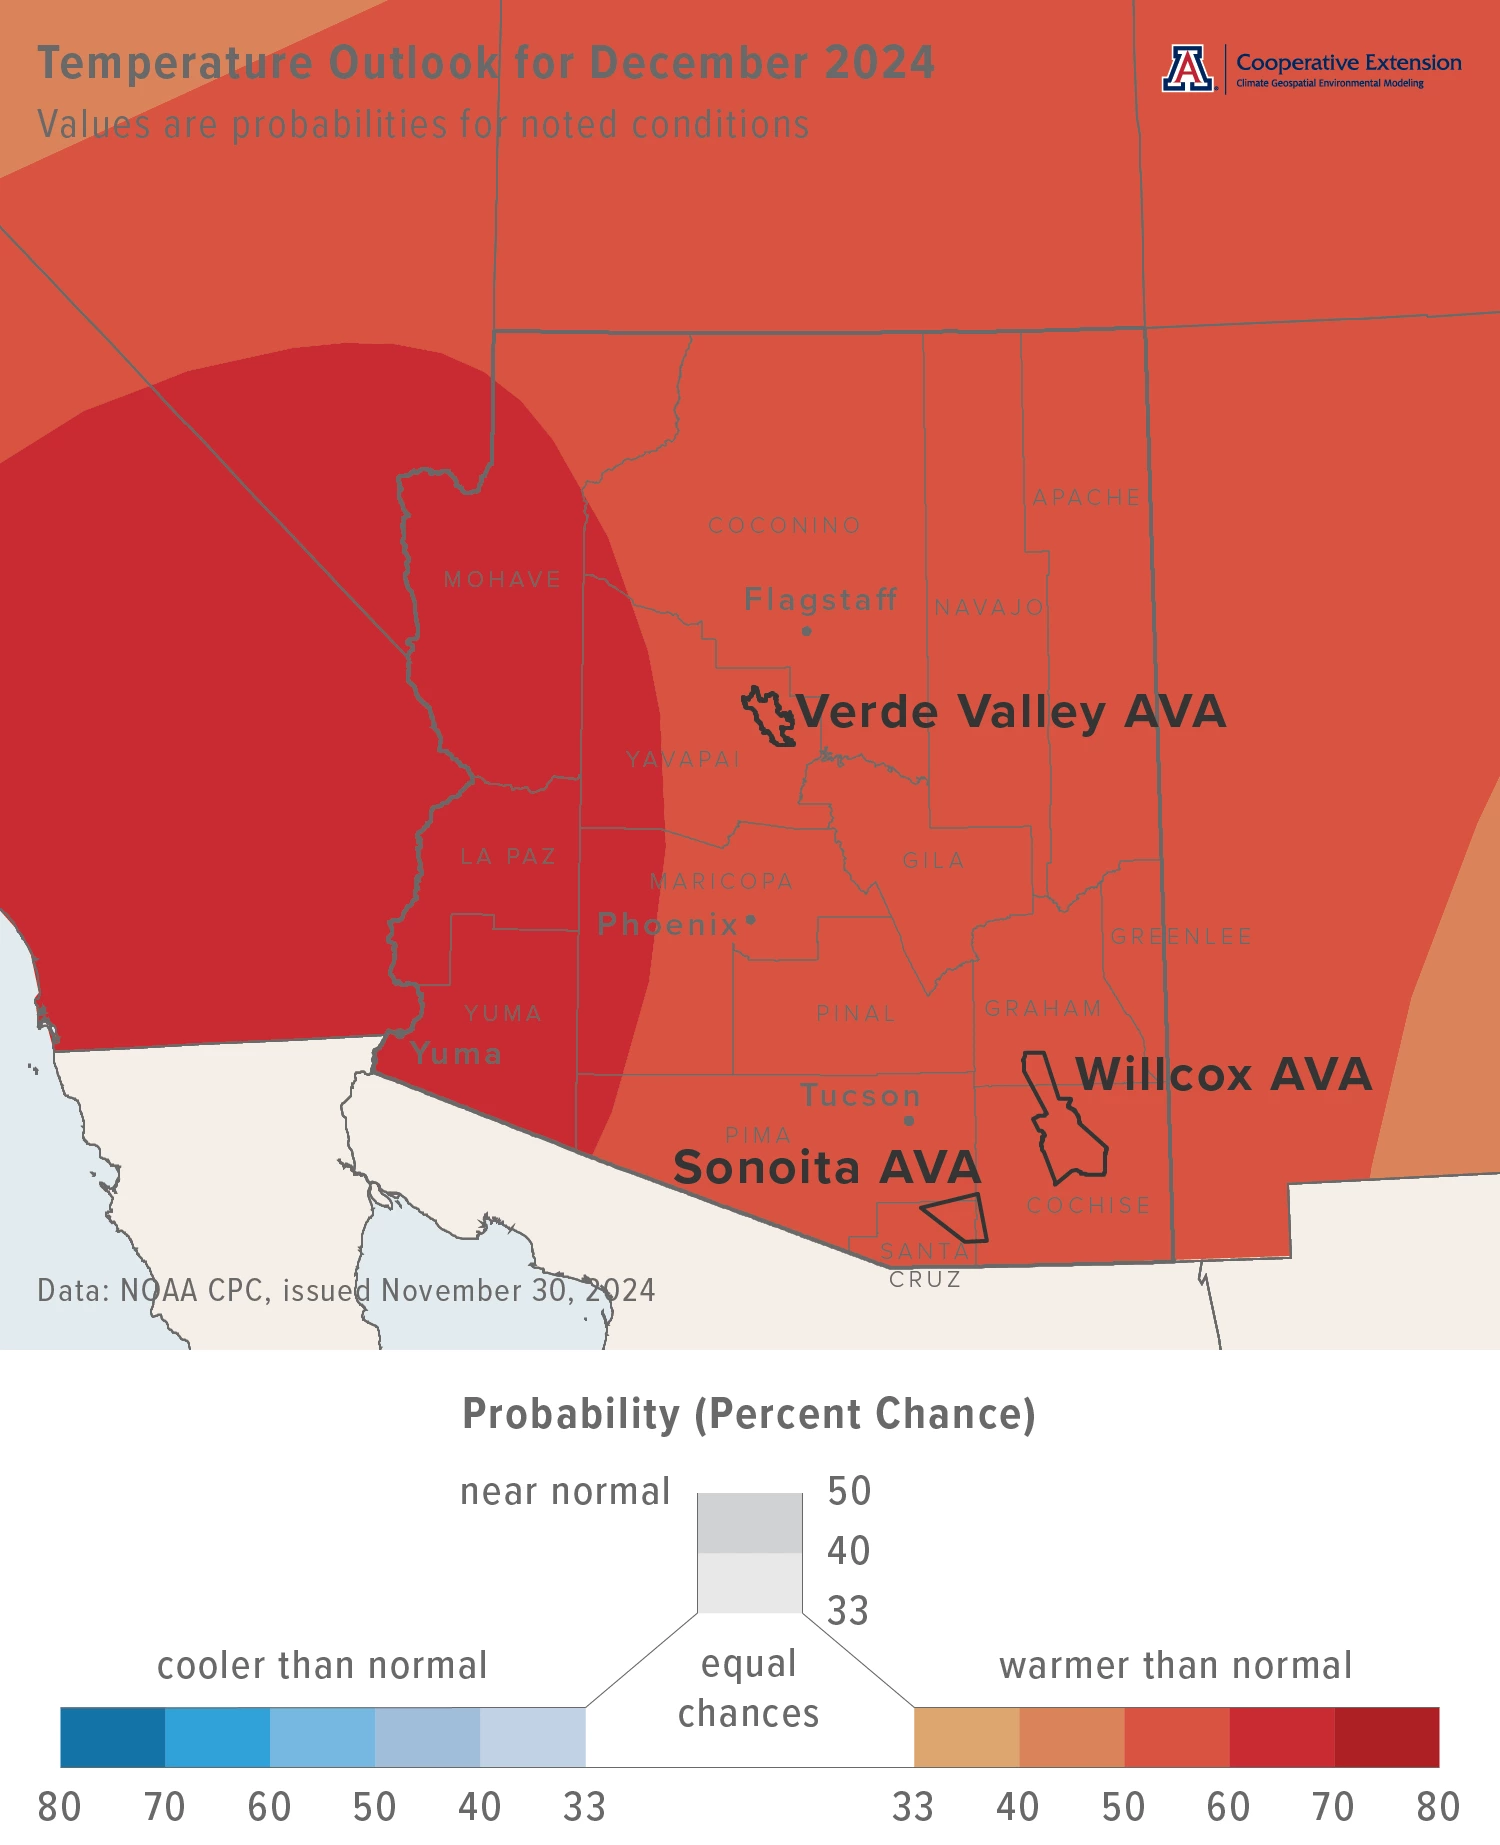
Temperatures over the course of this month have a moderate increase in chances for being above the 1991-2020 normal across all of Arizona (dark orange and red areas on map), with anomalous warmth greater in early December. Monthly average temperatures in December last year were 1 to 4 °F above normal for much of the state. Several areas in central and northwestern Arizona recorded temperatures more than 4 °F above normal.
Area-average maximum and minimum temperatures during December 2023 were 62.0 and 34.3 °F for the Sonoita AVA, 61.3 and 32.4 °F for the Verde Valley AVA, and 61.8 and 30.8 °F for the Willcox AVA. Respective December normals are 58.3 and 31.5 °F, 57.2 and 30.0 °F, and 59.0 and 30.2 °F.
Temperature in December last year ranged between 71.8 and 23.2 °F at the AZMet Bonita station and between 73.0 and 21.7 °F at the AZMet Willcox Bench station.
Jeremy Weiss
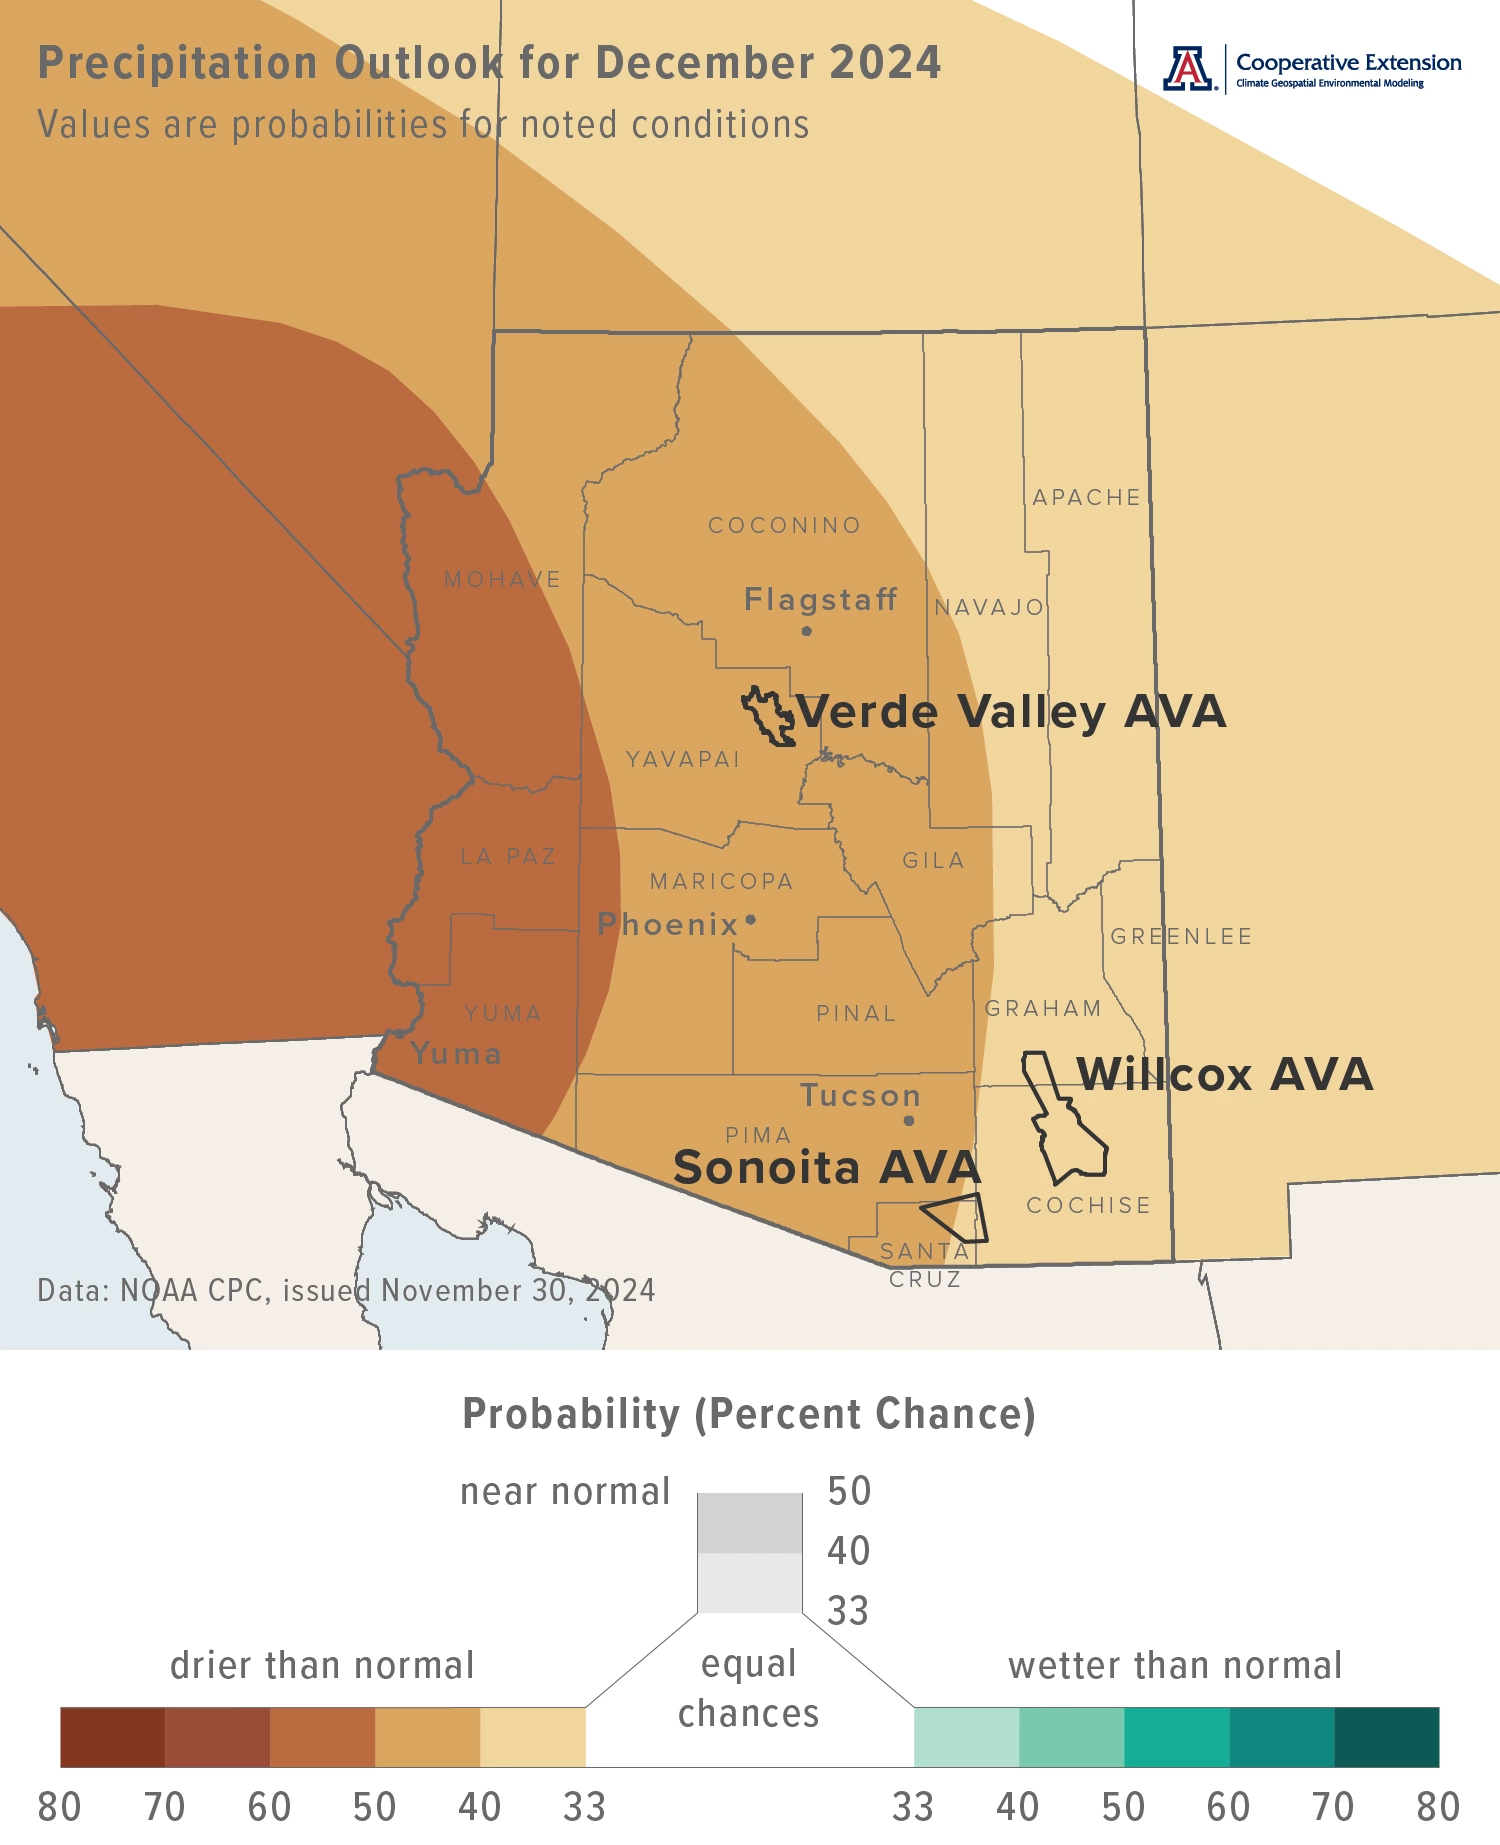
Precipitation totals for this month have a slight increase in chances for being below normal across the eastern two-thirds of the state (light tan and dark tan areas on map). For western one-third, there is a moderate chance for below-normal totals (brown area on map). Precipitation during December 2023 was less than 75 % of normal for much of northwestern Arizona. Otherwise, totals were near normal, with scattered areas along the southern tier of the state measuring more than 125 % of normal.
Area-average precipitation totals in December 2023 were 1.52 inches for the Sonoita AVA, 0.55 inches for the Verde Valley AVA, and 1.31 inches for the Willcox AVA. Respective December normals are 1.40, 1.37, and 1.08 inches.
Total precipitation in December last year was 1.52 and 1.08 inches at the AZMet Bonita and Willcox Bench stations, respectively.
To stay informed of long-range temperature and precipitation possibilities beyond the coverage of a standard weather forecast, check in, too, with the six-to-ten-day outlook and eight-to-fourteen-day outlook issued daily by NOAA’s Climate Prediction Center.
Jeremy Weiss
Seasonal Accumulation of Growing Degree Days
We’ve recently kicked off a new project about the effects of Arizona climate on the timing of wine grape growth stages. In particular, we’ll be looking at how chill and heat accumulation, and soil temperature, during the dormant season correspond to bud break dates, and how heat accumulation during the growing season corresponds to time between bud break, flowering, and veraison. Funding for the project was made possible by a grant / cooperative agreement from the U.S. Department of Agriculture (USDA) Agricultural Marketing Service.
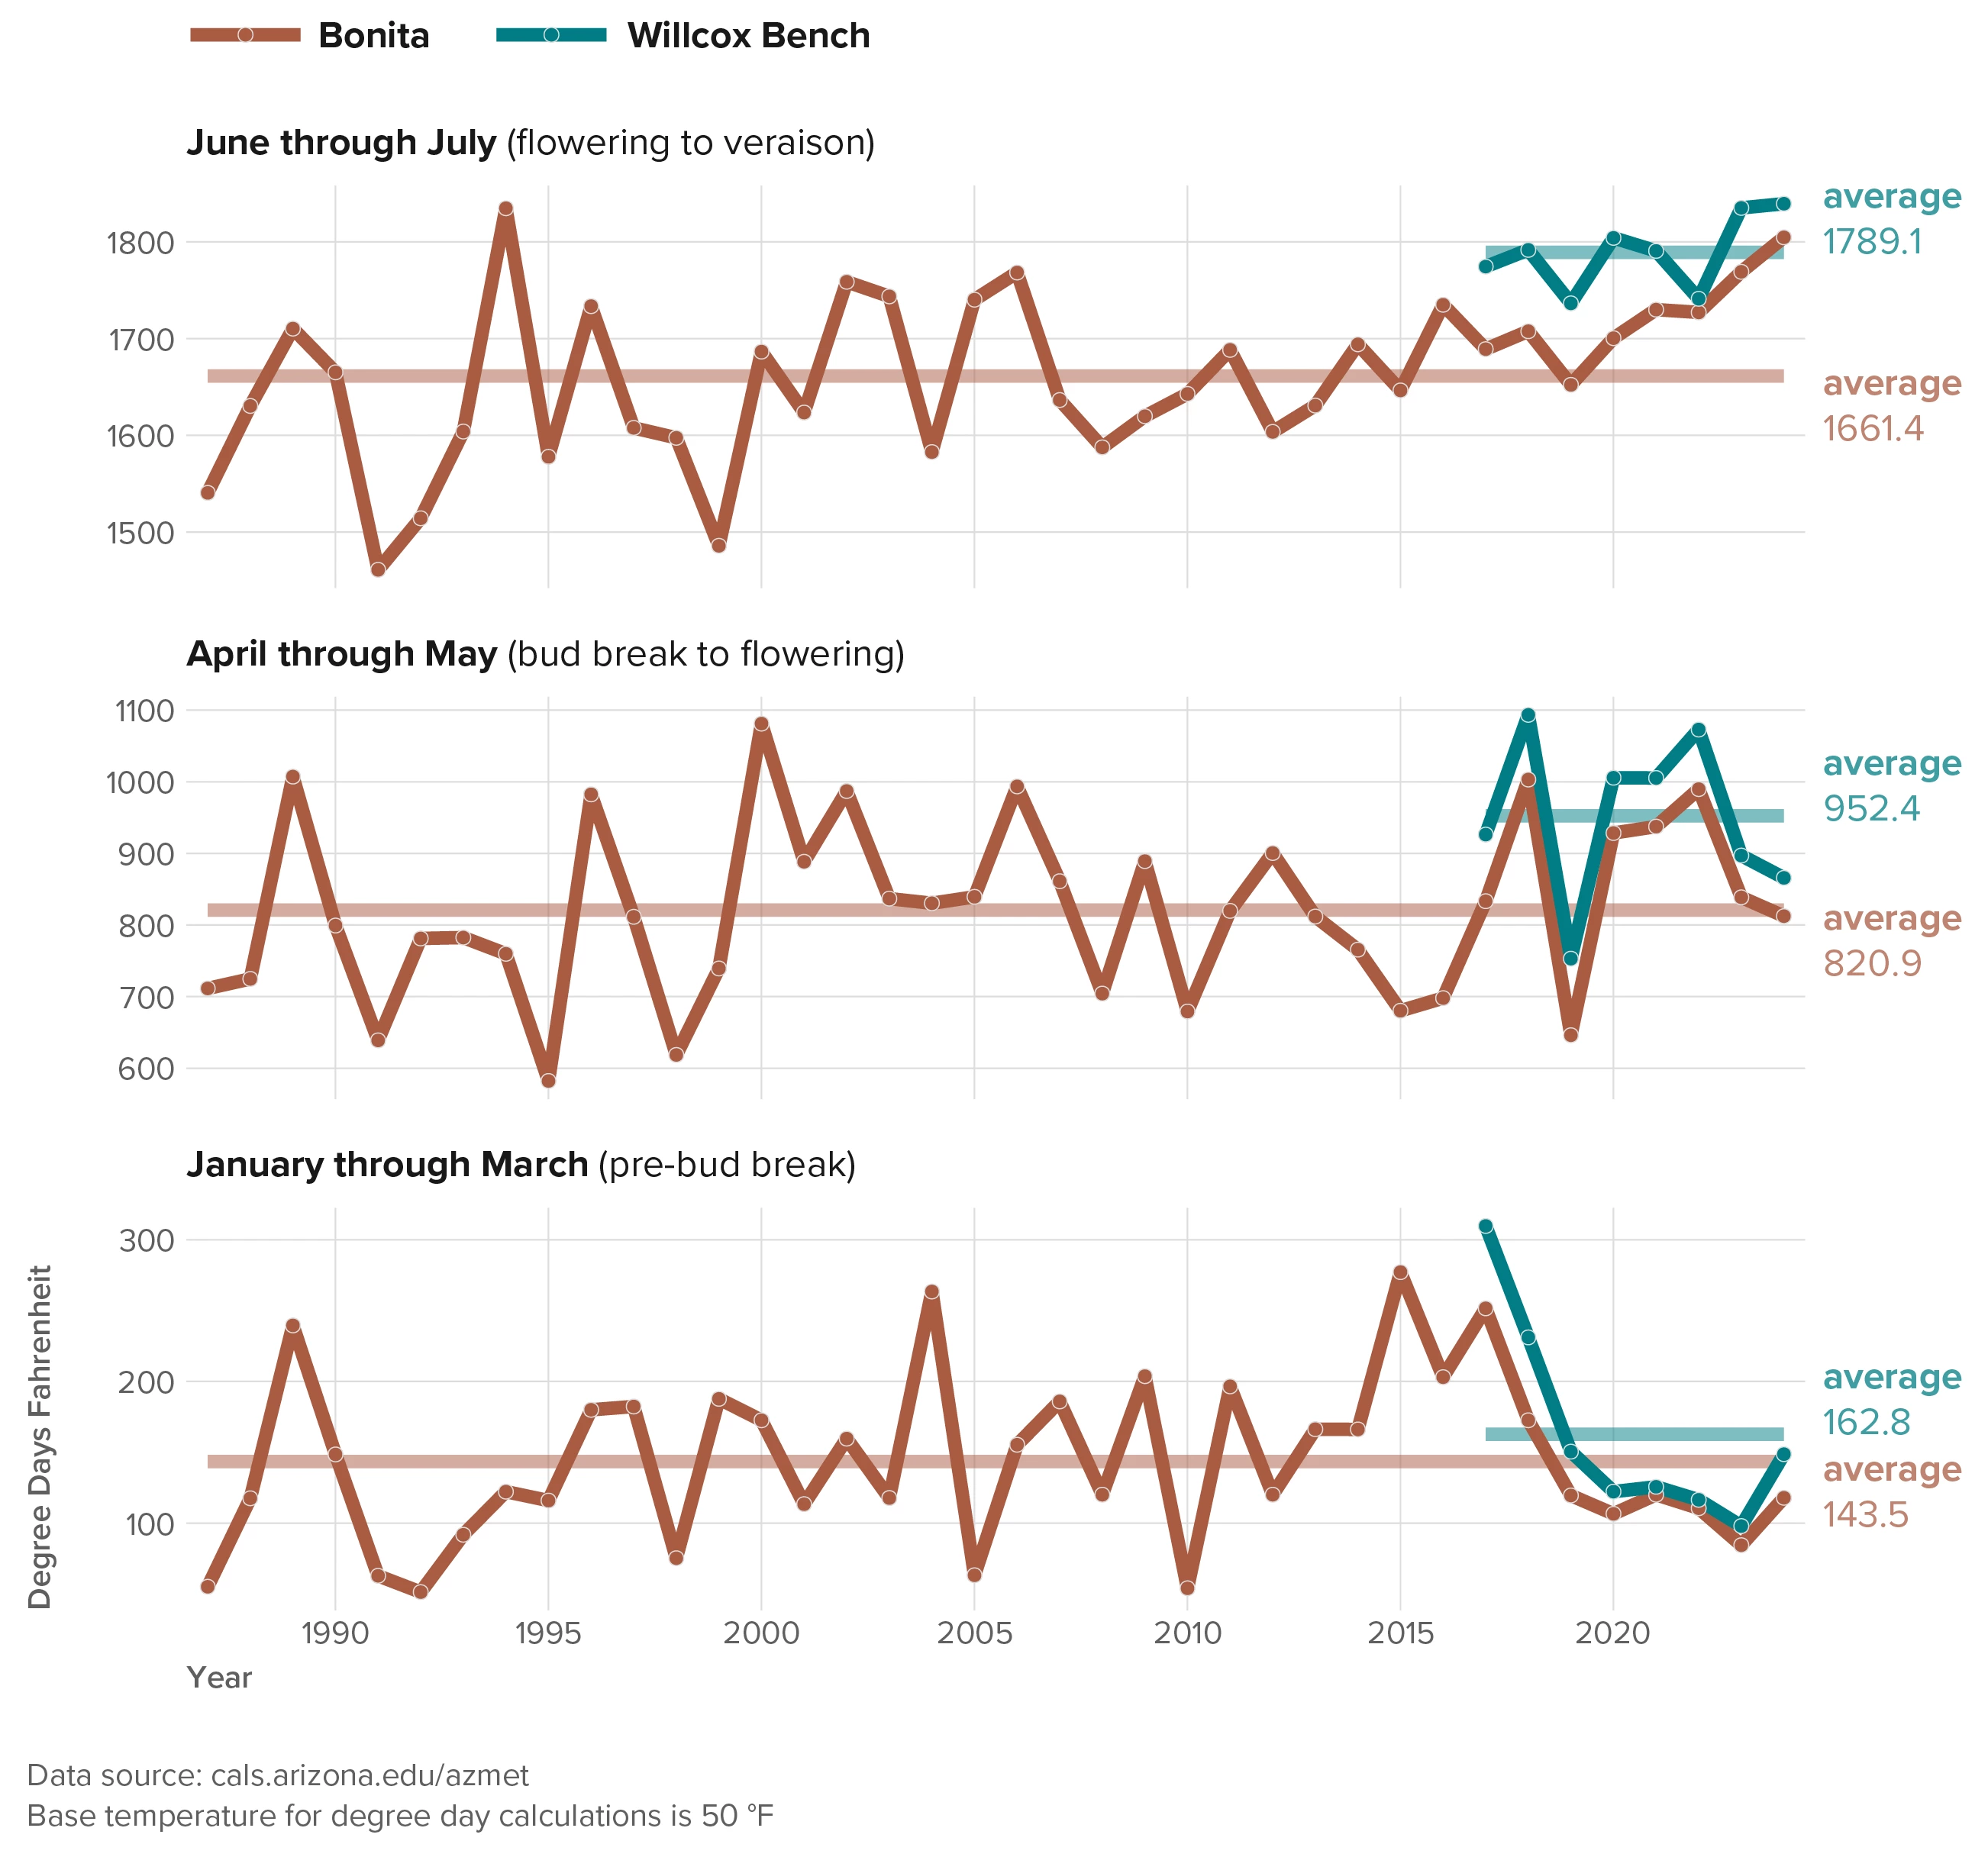
As one of our first steps, we’ve summarized the seasonal accumulation of growing degree days with a base temperature of 50 °F. This variable is a common measure for tracking heat accumulation in the context of plant phenology. For seasons, we simply refer here to January through March as pre-bud break (bottom chart in figure), April through May as bud break to flowering (middle chart in figure), and June through July as flowering to veraison (top chart in figure). Data are from the AZMet Bonita and Willcox Bench stations in the Willcox AVA, with respective starts to values of 1987 and 2017.
One thing to note from the figure is that heat accumulation typically is greater at Willcox Bench (aqua lines on charts) than Bonita (brown lines on charts), regardless of season but perhaps more notably from April through May and from June through July. This is not surprising, as the former station is located in a warmer part of the Willcox AVA.
A second thing to note is that heat accumulation varies from year to year for a given season (variable lines on charts). For values from January through March, for example, those in the mid-2010s are above average (horizontal lines on charts) whereas those more recent are near to below average. Of the three seasons, one might suggest less variability and more trend towards greater heat accumulation in recent vintages from June through July.
As some of our next steps, we’ll begin to process phenology data, with one output being an early-to-late ordering of varieties when it comes to bud break, flowering, and veraison. We’ll also start analysis of phenology and climate data, with a focus on bud break and updates in spring newsletter issues.
Jeremy Weiss
Extra Notes
The next viticulture symposium presented by Cooperative Extension will be December 4, 2024 at the University of Arizona Controlled Environment Agriculture Center in Tucson. Topics will include soils and fertility, integrative pest management, pathology, weather and climate, and the industry’s impact on tourism. Continuing education credits will be offered for licensed applicators. In addition, the Arizona Wine Growers Association will sponsor lunch and there will be a ‘Growing Season in Review’ workshop. Registration is $20 and required, as space is limited to 55 attendees. Please contact Matt Halldorson with any questions.
Odds are 57 % for La Niña conditions to develop during the October-through-December period, with the expectation that they persist through the January-through-March period. This forecast also indicates a weak La Niña event of short duration, which implies that the typical below-normal totals of seasonal precipitation resulting from this ENSO phase may be less likely.
For those of you in southeastern Arizona, including the Sonoita and Willcox AVAs, Cooperative Extension manages an email listserv in coordination with the Tucson forecast office of the National Weather Service to provide information in the days leading up to agriculturally important events, like cold-air outbreaks and the occasional winter storm. Please contact us if you'd like to sign up.
And for those of you in north-central and northeastern Arizona, including the Verde Valley AVA, Cooperative Extension also now manages an email listserv in coordination with the Flagstaff forecast office of the National Weather Service to provide similar information for this part of the state. Please contact us if you'd like to sign up.
Undergraduate students in the College of Agriculture and Life Sciences at the University of Arizona are looking for internships with businesses and companies in the viticulture and winery industries. Please contact Danielle Buhrow, Senior Academic Advisor and Graduate Program Coordinator in the Department of Agricultural and Resource Economics, for more information.
Please feel free to give us feedback on this issue of the Climate Viticulture Newsletter, suggestions on what to include more or less often, and ideas for new topics.
Did someone forward you this newsletter? Please contact us to subscribe.
Have a wonderful December!
With current and past support from:
