< Back to Climate Viticulture Newsletter
Hello, everyone!
This is the May 2024 issue of the Climate Viticulture Newsletter – a quick look at some timely climate topics relevant to wine grape growing in Arizona.
IN THIS ISSUE
- A Recap of April Temperature and Precipitation
- The Outlook for May Temperature and Precipitation
- Vine Dormancy and the Start of the Growing Season
- A Review of the 2023-2024 Dormant Season
- Extra Notes
A Recap of April Temperature and Precipitation
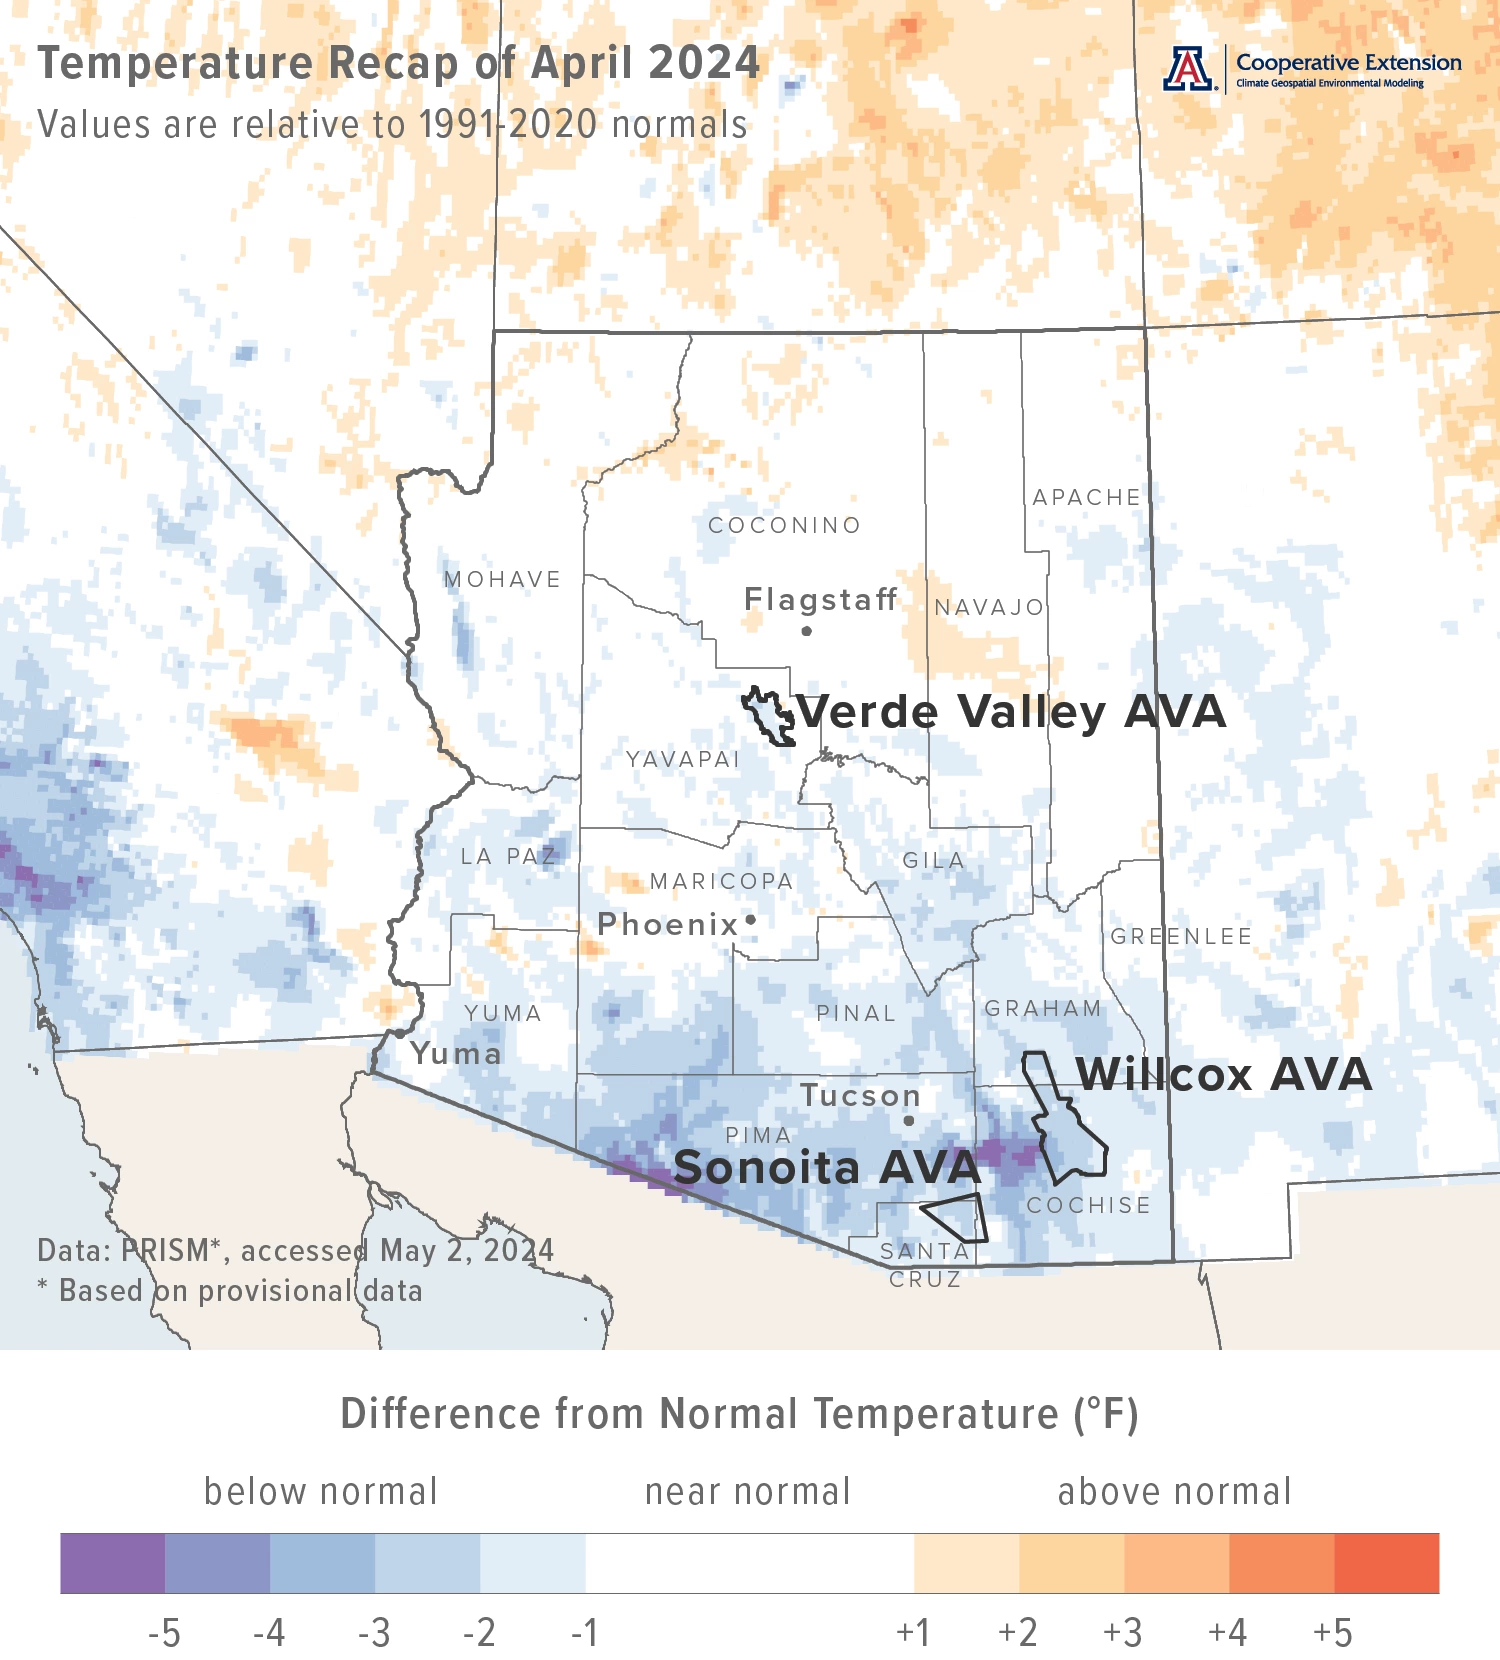
Monthly average temperatures were 1 to 4 °F below the 1991-2020 normal for much of the southern half of Arizona (light blue, blue, and dark blue areas on map), including all three Arizona AVAs. Much of the rest of the state saw near-normal temperatures (white areas on map). For reference, monthly average temperatures in April last year were within 2 °F of normal for almost all of the state.
Area-average maximum and minimum temperatures during April 2024 were 71.3 and 40.3 °F for the Sonoita AVA, 73.6 and 42.3 °F for the Verde Valley AVA, and 73.7 and 40.2 °F for the Willcox AVA. Respective April normals are 73.5 and 41.9 °F, 75.5 and 42.6 °F, and 76.7 and 42.0 °F.
Temperature last month ranged between 87.3 and 28.0 °F at the AZMet Bonita station and between 87.8 and 29.7 °F at the AZMet Willcox Bench station.
Jeremy Weiss
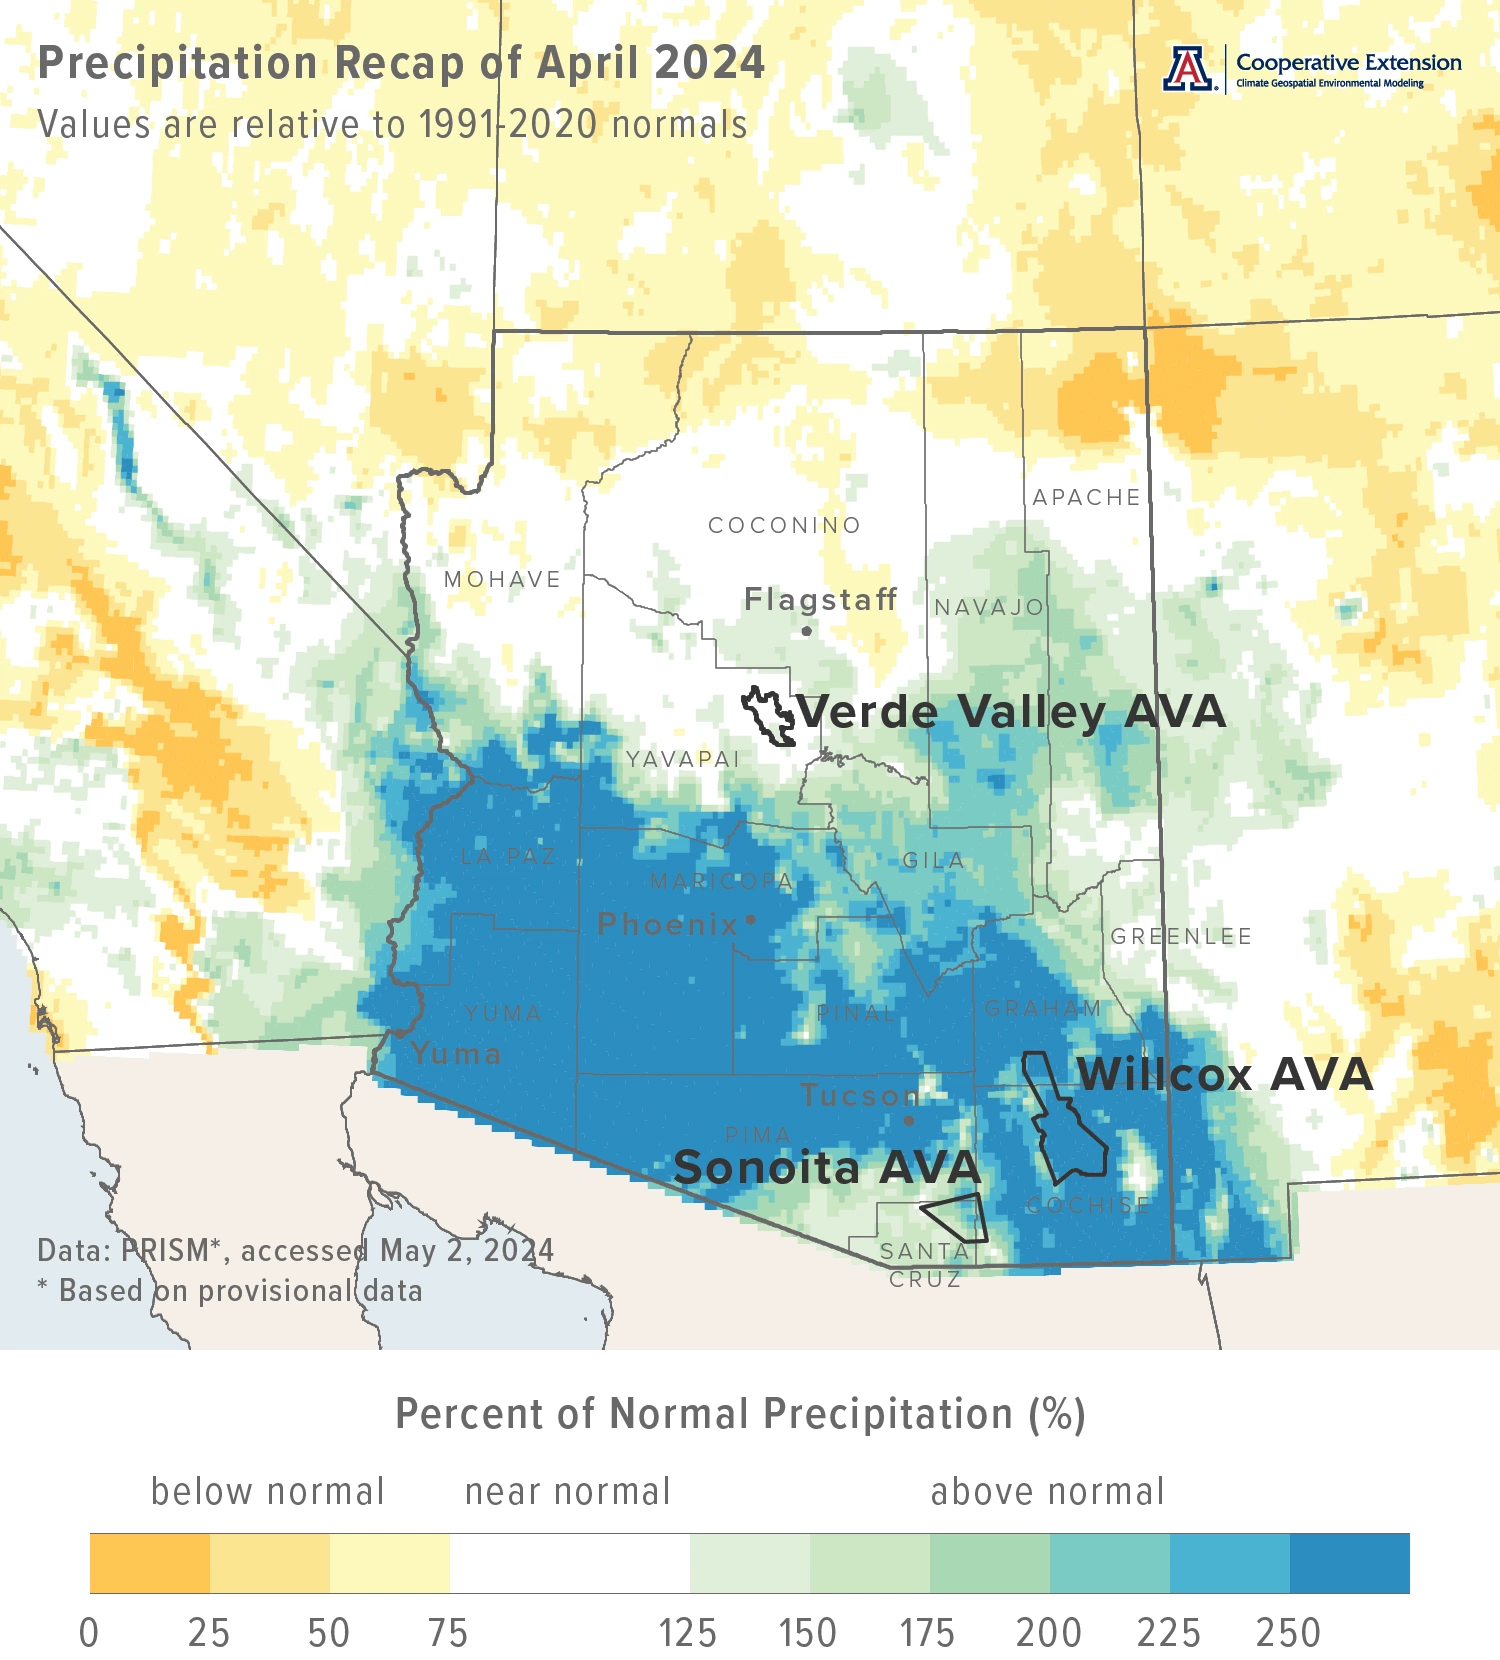
Monthly precipitation totals were more than 200 % of normal for much of the southern half of the state (dark aqua, blue, and dark blue areas on map), including the Willcox AVA and part of the Sonoita AVA. Of course, April is a relatively dry month, and it doesn’t take much precipitation to make such high percentages. These areas of above-normal amounts transition to mostly near-normal ones in much of the northern half of Arizona (white areas on map), including the Verde Valley AVA, which transition to totals below 75 % of normal (light yellow and yellow areas on map) across the northern tier. Precipitation during April 2023 was less than 25 % of normal for almost all of Arizona.
Area-average total precipitation in April 2024 was 0.66 inches for the Sonoita AVA, 0.57 inches for the Verde Valley AVA, and 0.70 inches for the Willcox AVA. Respective April normals are 0.38, 0.55, and 0.25 inches.
Total precipitation last month was 0.18 and 0.42 inches at the AZMet Bonita and Willcox Bench stations, respectively.
Dig further into daily weather summaries for the AZMet Bonita and Willcox Bench stations in the Willcox AVA
Learn more about PRISM climate data
Jeremy Weiss
The Outlook for May Temperature and Precipitation
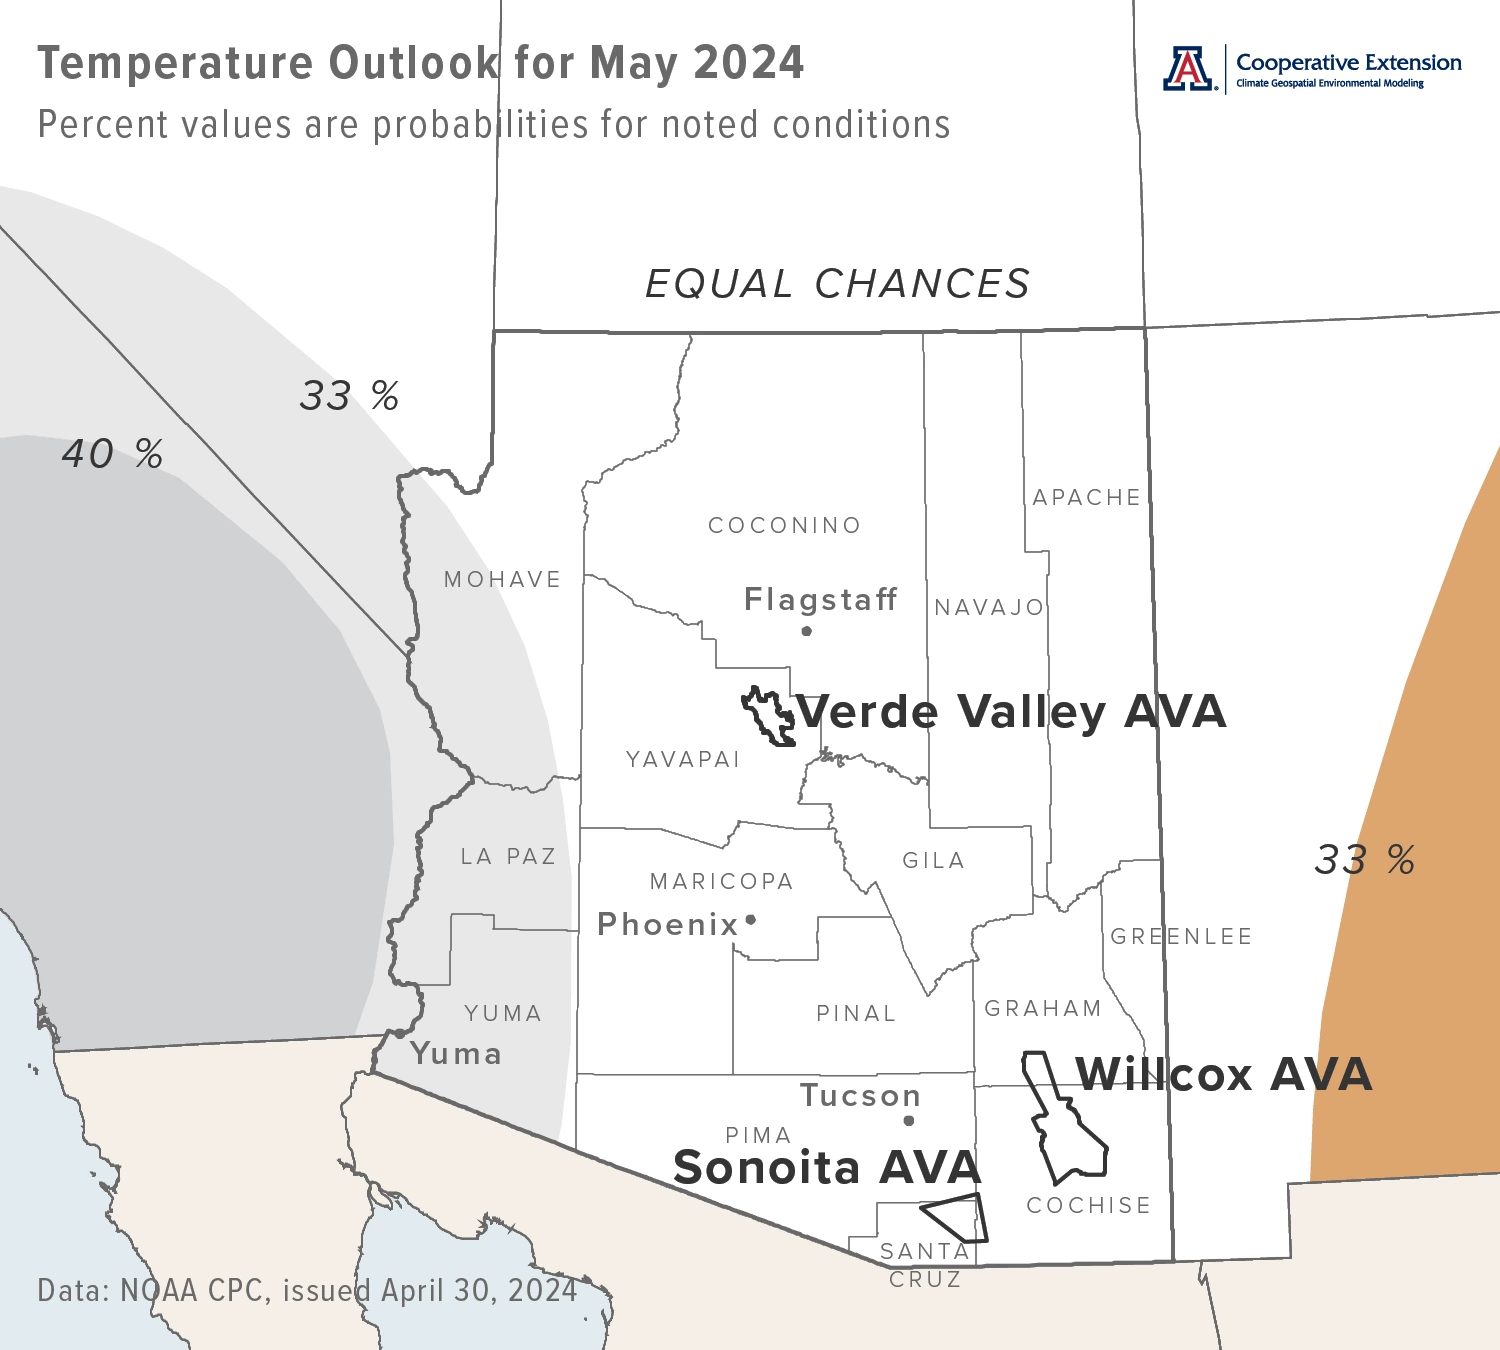
Temperatures over the course of this month have equal chances for being below, near, or above the 1991-2020 normal across all of Arizona, except for the extreme western part of the state (white area on map), where there is a slight increase in chances for near-normal temperatures (light gray area on map). Monthly average temperatures in May last year were within 2 °F of normal for almost all of the state.
Area-average maximum and minimum temperatures during May 2023 were 80.7 and 46.8 °F for the Sonoita AVA, 84.6 and 49.8 °F for the Verde Valley AVA, and 83.4 and 48.0 °F for the Willcox AVA. Respective May normals are 81.7 and 49.6 °F, 84.5 and 50.0 °F, and 84.8 and 48.9 °F.
Temperature in May last year ranged between 89.8 and 34.7 °F at the AZMet Bonita station and between 90.9 and 34.2 °F at the AZMet Willcox Bench station.
Jeremy Weiss
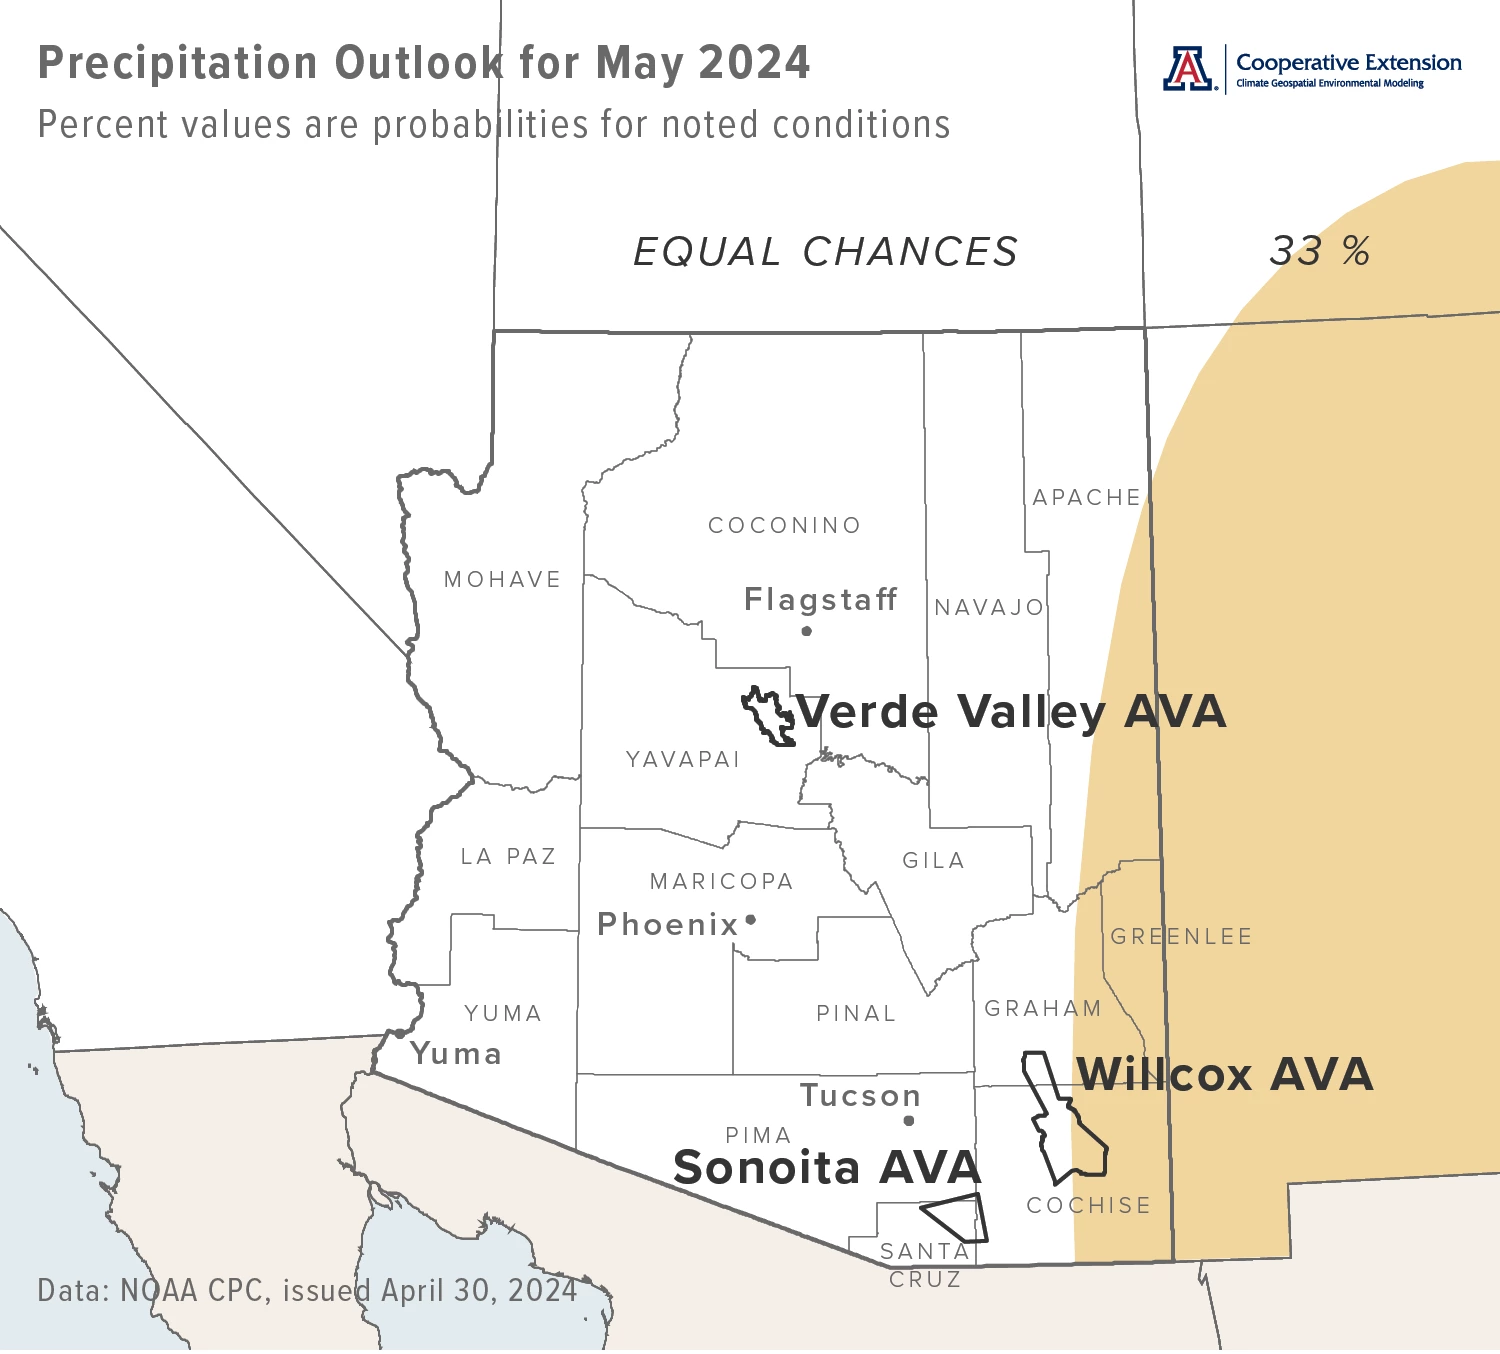
Precipitation totals for this month have equal chances for being below, near, or above normal across all of Arizona (white area on map), except for the extreme eastern part of the state, where there is a slight increase in chances for below-normal amounts (light tan area on map). Precipitation during May 2023 was more than 150 % of normal for many areas in the west-central and southeastern parts of the state. Otherwise, and apart from much of the southwestern and south-central parts of the state that measured amounts below 50 % of normal, monthly totals mostly were near normal.
Area-average precipitation totals in May 2023 were 0.22 inches for the Sonoita AVA, 0.71 inches for the Verde Valley AVA, and 0.43 inches for the Willcox AVA. Respective May normals are 0.22, 0.44, and 0.29 inches.
Total precipitation in May last year was 0.06 and 0.17 inches at the AZMet Bonita and Willcox Bench stations, respectively.
To stay informed of long-range temperature and precipitation possibilities beyond the coverage of a standard weather forecast, check in, too, with the six-to-ten-day outlook and eight-to-fourteen-day outlook issued daily by NOAA’s Climate Prediction Center.
Jeremy Weiss
Vine Dormancy and the Start of the Growing Season
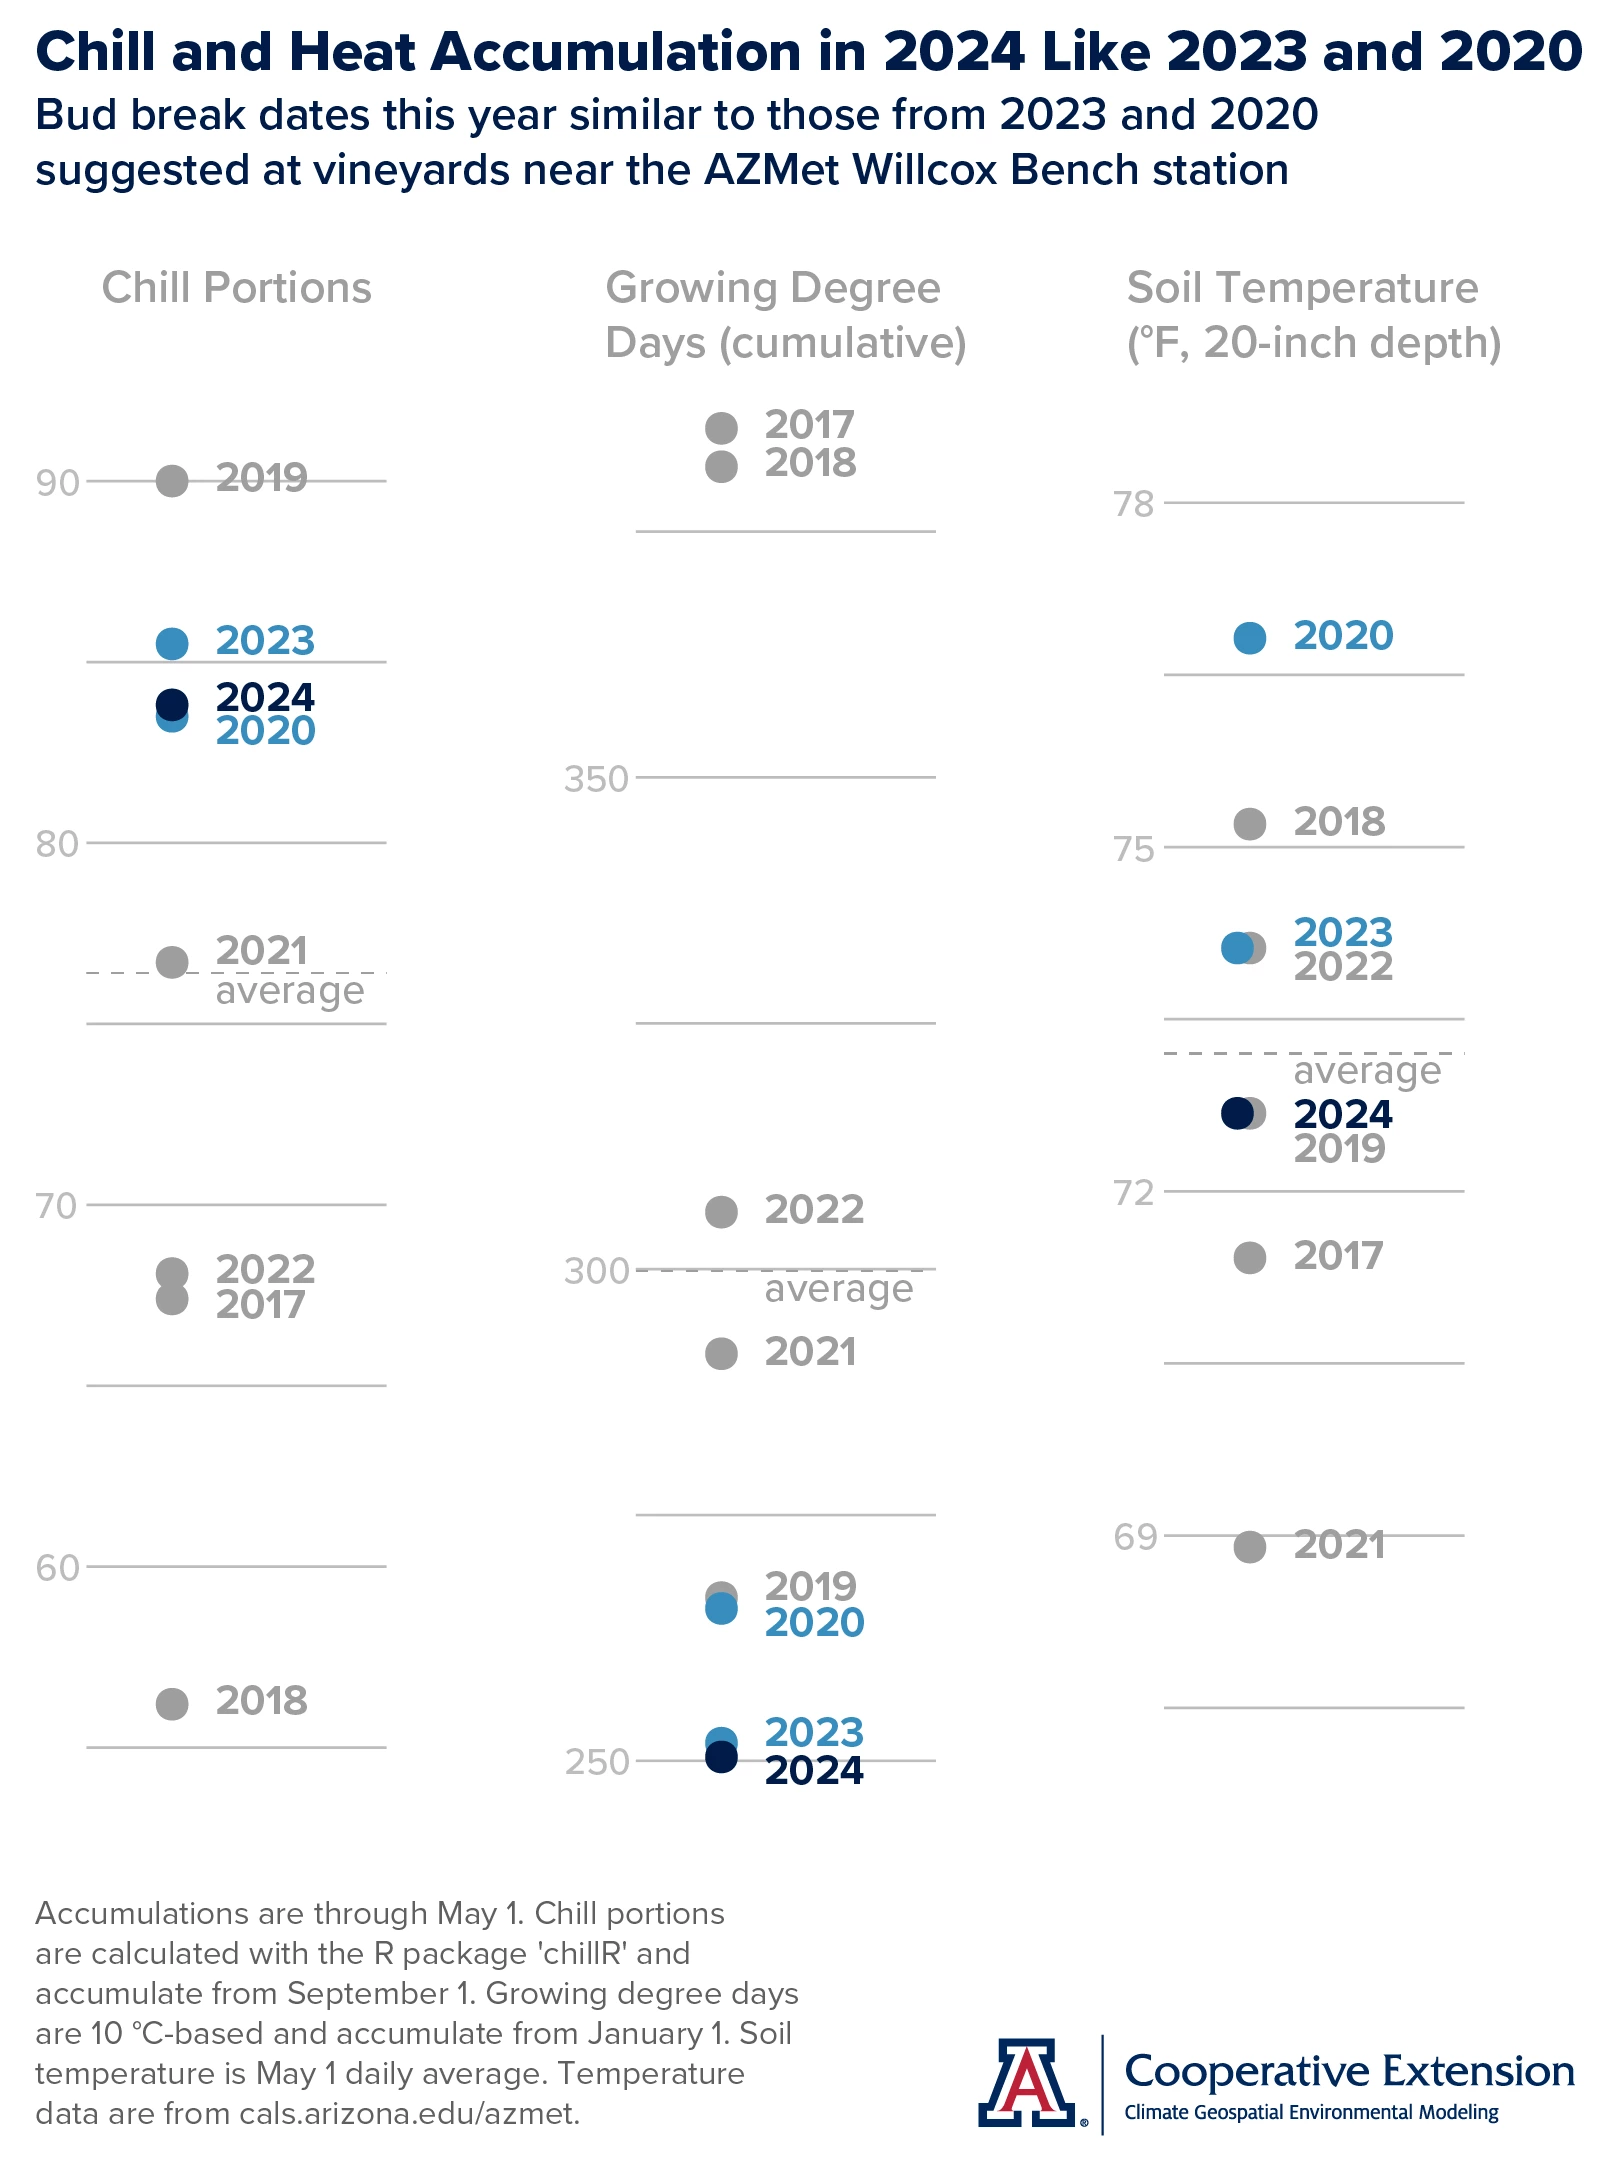
With bud break likely done in perhaps all but the latest varieties and coolest growing areas in the state, we’ll take one last look at chill and heat accumulations influencing the start of the growing season this year. As we only use temperature data here from the AZMet Willcox Bench station, our assessment is most applicable to the south-central part of the Willcox AVA.
Temperatures in April maintained what we observed in the newsletter issue last month, which is similar chill and heat accumulations in 2024 and 2020 (dark blue and blue dots on graph, respectively). But, as temperature variability in the weeks leading up to bud break influence bud break dates, conditions this year also are like those last year at this point on the calendar. Using the lens of deacclimation kinetics and past ‘analog’ years, this suggests a start date for the 2024 growing season in the range of those from 2023 and 2020. Granted, something that might upend this estimate for this year and for some varieties is the overnight low temperatures of 29.7 and 31.3 °F on April 7 and April 16, respectively.
Chill portion accumulation through May 1 this year is above the station average (dark blue dot and gray dotted line, respectively, in left graph), with higher values only in 2019 and 2023. Heat accumulation is below average (dark blue dot and gray dotted line, respectively, in middle graph), and the lowest value of the past eight years. As soil temperature sometimes is part of the discussion about the start of the growing season, we show those data, as well. The daily average on May 1 this year is near average (dark blue dot and gray dotted line, respectively, in right graph).
Jeremy Weiss
A Review of the 2023-2024 Dormant Season
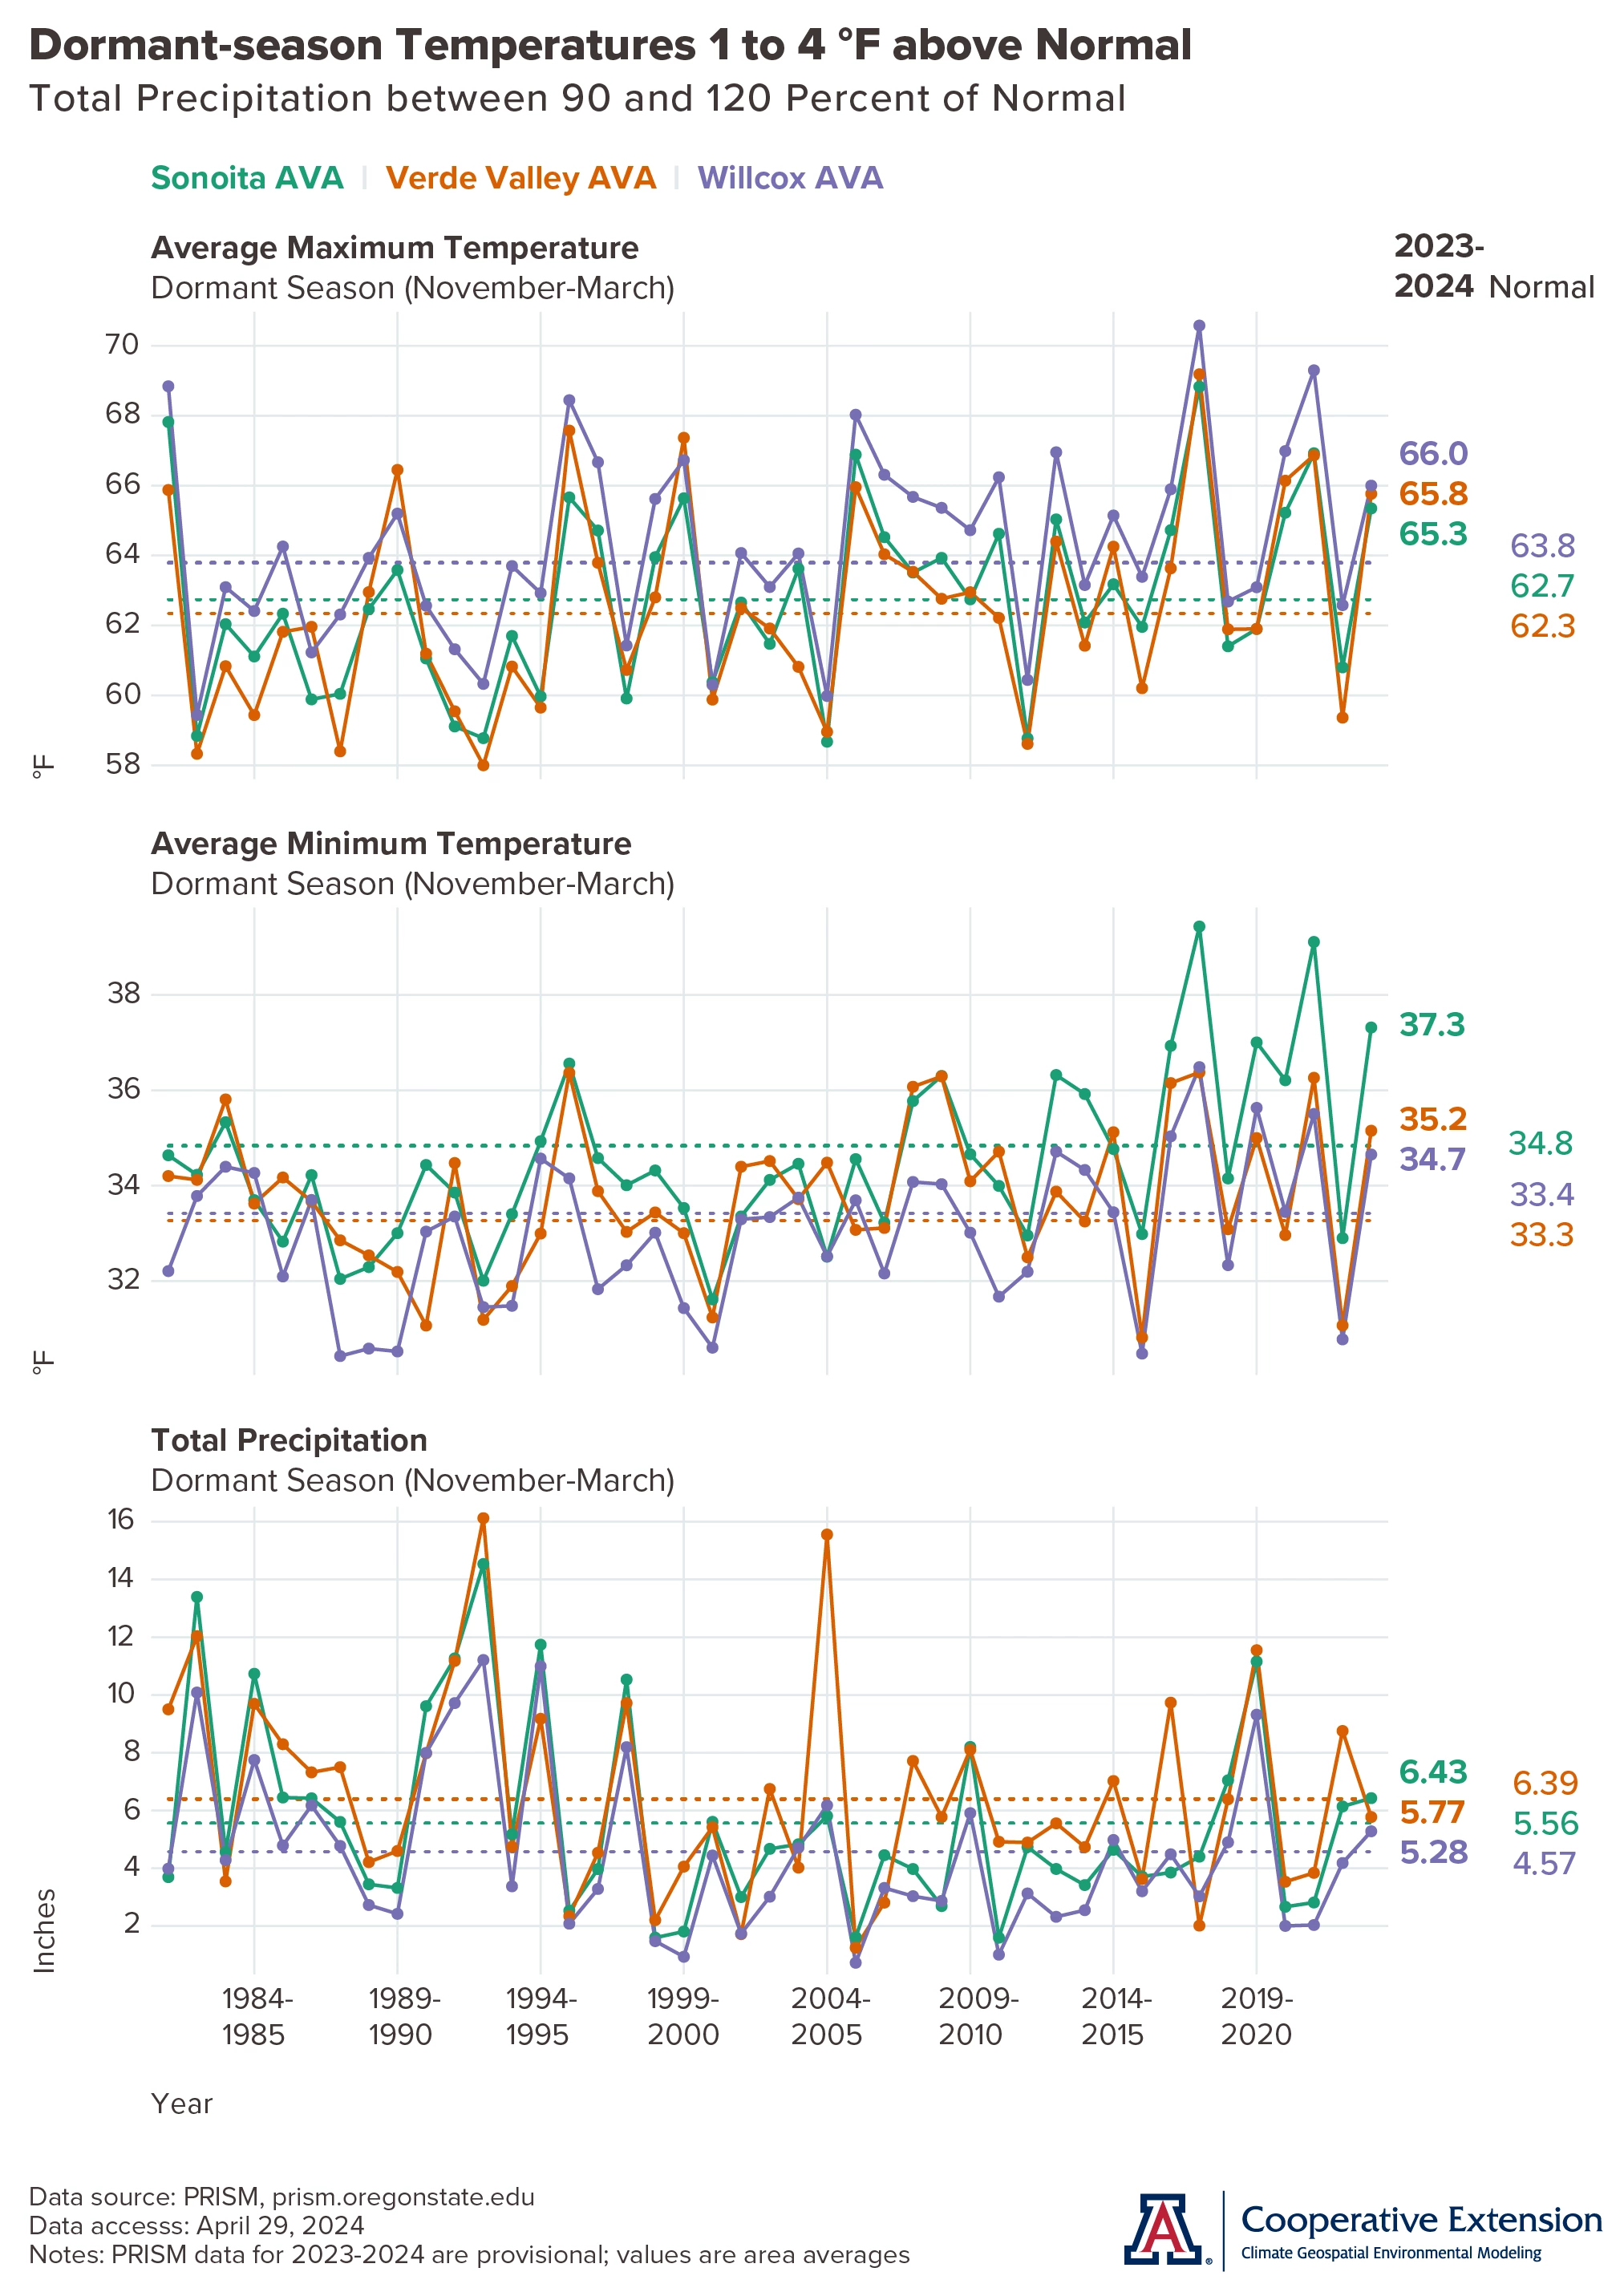
With the start of the 2024 growing season, it’s time to review this past dormant season. Much like the recent reviews of the 2023 growing season in the January and February newsletter issues, we focus on average maximum and minimum temperatures (top and middle graphs, respectively) as well as total precipitation (bottom graph) in the three Arizona AVAs. We also add some statistics from the AZMet Bonita and Willcox Bench stations in the Willcox AVA at the end of this section.
Average maximum temperatures during the period from November through March were above the 1991-2020 normal (dashed horizontal lines on graphs) for all three Arizona AVAs. For the Sonoita and Willcox AVAs (green and purple lines on graphs, respectively), these differences were about 2 to 3 °F, whereas it was about 3 to 4 °F for the Verde Valley AVA (orange lines on graphs). One need not go back far in the data to find similar anomalies, only to the dormant seasons in 2020-2021 and 2021-2022.
Average minimum temperatures during this past dormant season also were above the 1991-2020 normal for all three Arizona AVAs. For the Verde Valley and Willcox AVAs these differences were about 1 to 2 °F, whereas it was about 2 to 3 °F for the Sonoita AVA. Once again, similar anomalies occurred in the 2020-2021 and 2021-2022 dormant seasons.
Precipitation totals from November through March were between 110 and 120 % of normal for the Sonoita and Willcox AVAs, with amounts between 5 and 7 inches. Similar past dormant seasons include 2018-2019 and last year. For the Verde Valley AVA, total precipitation during the past five months was about 90 % of normal, between 5 and 6 inches and less than last year. Similar past dormant seasons include 2018-2019.
Average daily maximum and minimum temperatures during this past dormant season were 63.3 and 34.0 °F at the AZMet Bonita station, with the highest temperature of 85.5 °F on November 5, 2023 and the lowest of 18.7 °F on January 9, 2024. Total precipitation and evapotranspiration was 4.30 and 14.89 inches, respectively. Respective values for the AZMet Willcox Bench station were 64.7 and 33.8 °F, 86.9 °F on November 5, 2023 and 17.8 °F on January 9, 2024, and 4.21 and 15.28 inches.
Jeremy Weiss
Extra Notes
Dr. Markus Keller, the keynote speaker at the Arizona Viticulture Summit in March 2023, will present on recent irrigation research at the May 30 WAVEx webinar sponsored by the Washington State Wine Commission and Washington State University. Topics include comparisons between varieties, deficit irrigation, heat stress, and ripening. Sign up here to attend for free.
A new Extension bulletin on the recent statewide commercial viticulture needs assessment is now available. Based on input from viticulturists and vineyard managers and owners, priority topics include irrigation, pest and insect management, disease management, soil fertility, weather, and weed management.
The new AZMet (Arizona Meteorological Network) website recently moved from its staging area to its production one, and now is at azmet.arizona.edu. So far, we've rebuilt and reorganized many pieces of the legacy website. Coming up, we'll continue its evolution with new features and tools. Please give it a look next time you're online for AZMet data and information.
It’s once again wildland fire season in the Southwest. Given recent and current conditions, there is an above-normal potential for significant wildland fires across the southeastern part of Arizona in May. Otherwise across the state, the outlook from the National Interagency Fire Center shows potential as normal for the month.
The current El Niño event continues to weaken rapidly, with an 85 % chance that it concludes during the April-through-June timeframe. Odds are 60 % that La Niña conditions take hold across the tropical Pacific Ocean during the June-through-August period.
For those of you in southeastern Arizona, including the Sonoita and Willcox AVAs, Cooperative Extension manages an email listserv in coordination with the Tucson forecast office of the National Weather Service to provide information in the days leading up to agriculturally important events, like spring freezes and high-wind days. Please contact us if you'd like to sign up.
And for those of you in north-central and northeastern Arizona, including the Verde Valley AVA, Cooperative Extension also now manages an email listserv in coordination with the Flagstaff forecast office of the National Weather Service to provide similar information for this part of the state. Please contact us if you'd like to sign up.
Undergraduate students in the College of Agriculture and Life Sciences at the University of Arizona are looking for internships with businesses and companies in the viticulture and winery industries. Please contact Danielle Buhrow, Senior Academic Advisor and Graduate Program Coordinator in the Department of Agricultural and Resource Economics, for more information.
Please feel free to give us feedback on this issue of the Climate Viticulture Newsletter, suggestions on what to include more or less often, and ideas for new topics.
Did someone forward you this newsletter? Please contact us to subscribe.
Have a wonderful May!
With current and past support from: