Using geospatial technologies to understand dryland dynamics
![]() No.
51, May/June 2002
No.
51, May/June 2002
Using geospatial technologies to understand dryland
dynamics
by Heike Klock and Peter Udluft
|
"The regionalization of groundwater discharge and recharge by use of remotely sensed surface mapping gives a groundwater availability figure that is more reliable than the mean value of any number of point data. Thus, the technique allows more accurate balancing of the water availability against the current extraction amount." |
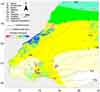
Introduction(Back to top) The Kalahari catchment of northeastern Namibia(Back to top) |
|
|
The climate is semiarid with summer rainfall. Mean
annual precipitation ranges from a high of 600 millimeters per annum (mm/a)
in the north to 300 mm/a in the central and southern parts. Potential
pan evaporation increases from 2700 mm/a in the north to 3200 mm/a in
the south. The main recharge mechanism is direct recharge from rainfall.
Groundwater recharge rates for this catchment have
been determined by the chloride balance method (1)
in the saturated zone of the groundwater divide (Klock, Külls and
Udluft 2001). The results show that recharge rates depend both on the
precipitation and on surface materials: often, areas covered by sandy
soils receive less than 1 mm/a while recharge rates in karstified hardrock
areas are locally as high as 100 mm/a. Testing three data sources for surface mapping(Back to top) The geological maps were scanned and a single map was compiled by digitizing. From this vector file all areas marked as "pre-Kalahari hardrocks" were transformed into a raster file at a very detailed scale so that scale effects were of minor importance. |
|
|
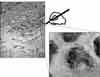
Aerial photographs can be interpreted either subjectively or objectively. A subjective tool would assign the property "hardrock" to areas showing both the characteristic colors (darkest grey tones) and one of the characteristic landforms (e.g. ridges) that hardrock tends to form. However, the spatial extent of each such feature might be interpreted quite differently depending on the user. |
|
|
For this reason, subjective interpretation was not used for this study; rather, we relied on a more objective and reproducible technique. Each aerial photograph to be evaluated was scanned, digitized and imported into a Geographic Information System (GIS) as raster format. Raster format assigns a greyscale value to every cell (or pixel) in the image (0 representing black and 255 representing white). Since hardrocks produce the darkest grey tones in aerial photographs, a threshold value was assigned, below which the feature "hardrock" was assumed. From these threshold values a binary raster image file was obtained with yes (1) or no (0) allocated to the feature "hardrock." |
|
|
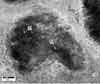
Satellite images were classified by a feature mapping procedure. This process is intended to map a specific feature of interest for a given region. (This is significantly quicker than supervised classification of an entire satellite image.) The basis for any feature mapping is the appropriate location of the sample points. Thus georeferencing of the satellite images was checked very carefully against the GPS coordinates of know localities (e.g. farm houses or road junctions) from fieldtrips to the research area. For each of the satellite scenes the bands 1, 2, 3, 4, 5 and 7 were selected to be the basis of the feature mapping and the geographic positions of known hardrock outcrops were designated as sample points. The range of reflectance intensity covered by these sample points was selected and the GIS was used to search for all points falling within the given limits. The resulting image was checked against known localities of hardrock that had not been used as sample points, and by checking that points known to be other features had not been selected as hardrock during the GIS search. The resulting image was accepted and transformed into a new raster map called "hardrock." |
|
|
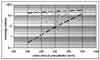
For the three Tsumkwe training-sites (Aha, Dobe and Makuri) it was found that the spatial extent of the surface features defined as "hardrock" was consistently highest with geological maps (Aha 33.4%, Dobe 60.6% and Makuri 83.4%) followed by aerial photographs (Aha 27.8%, Dobe 12% and Makuri 11.2%) and then satellite images (Aha 17.7%, Dobe 7.7% and Makuri 9.3% of the total area). For some regions the results differed even more significantly; for example, for the area of Lister, the geological map indicates 99.5% hardrock surface whereas the satellite images indicate less than 8% hardrock. Given these consistent results, we concluded that the geological maps always exaggerated the actual surface outcroppings of hardrock areas as they do not take account of thin soil cover overlying the hardrock. This is, of course, a result of the purpose for such maps are made: they must explain the invisible subsurface. Geological maps are often used to regionalise groundwater recharge, but it is clear from our comparison that they are an inappropriate tool for regionalisation of recharge in this research area. We next determined that areas classified as hardrock in the digitized aerial photographs were larger than those in the satellite images because the grayscale values assumed to indicate hardrock in the photographs might actually be indicating areas of thick vegetation. It is often impossible to distinguish between these two surface features in aerial photographs except by their shape. This makes aerial photographs difficult to handle in the automatic classification schemes which are, in fact, required for large drylands catchments. Satellite images scan the earth's surface reflectance in several spectral ranges and have a high resolution (e.g. Landsat TM 5 with 30 x 30 m pixel size). The combination of several bands allows different types of surface features to be distinguished from each other on the basis of the spectral reflectance alone. Thus, we chose satellite images as the basis for our study. However, we also recommend that, as with this study, any recharge regionalisation should involve a comparison of the reliability of potential data sources, before a particular data source is selected as the basis for further mapping. Mapping groundwater recharge zones(Back to top) Although recharge in the soil-covered areas is several orders of magnitude smaller than in the major recharge areas (hardrock terrain), such soil-covered areas comprise the largest part of the catchment and also have to be taken into account. Therefore we calculated recharge data for the soil-covered areas based on the relationship between mean annual precipitation data and the recharge data set from the chloride mass balance. It turns out that the hardrock recharge zones are very heterogeneously spread throughout the catchment. In total the hardrock areas cover only about 6,000 km², or about 3.8%, of the 160,000 km² study area. The recharge amount from these areas to the catchment is 180,000,000 to 390,000,000 m³/a. Approximately 60 % of this amount is produced in the Otavi area, which showed the largest point recharge data and is characterised by karstifed limestones. Total recharge for the entire study area was estimated as 250,000,000 to 800,000,000 m³/a, with approximately half being produced in hardrock areas. This is equal to a recharge amount of 1.5 to 5 mm/a assuming an equal distribution over the entire catchment. By comparison, the mean recharge value calculated from point recharge data (chloride mass balance) is significantly higher, 15.6 mm/a (Klock, Külls and Udluft 2001). This indicates that mean values of point recharge data give unreliable results at the catchment scale and that detailed surface mapping is an essential step for recharge regionalisation in drylands. Groundwater discharge zones(Back to top) For purposes of this study, evaporation values from the Great Artesian Basin (GAB) in southern Australia were adjusted to the Kalahari climate, and it was assumed that the evaporation from very shallow groundwater (that is, groundwater occurring at depths less than 5 m) in the Namibian Kalahari is about 80 - 100 mm/a. Hence groundwater discharge rates of 80 - 100 mm/a were assigned to all zones of very shallow groundwater in the study area. (2) Within the research area only 16 wells are reported with very shallow depths to groundwater (that is, dtw < 5 m). Half of these wells are restricted to a single region (Grootfontein). Only two small occurrences of very shallow groundwater are associated with ephemeral rivers. Based on these data, we estimated that the areas of very shallow groundwater, where evaporation is assumed to take place, cover only approximately 340 km² of the research area. Assuming an annual evaporation rate from the soil of 80 - 100 mm, we calculated an evaporation loss of 27,000,000 to 34,000,000 m³/a for the entire research area. Groundwater loss due to transpiration by plants also has a significant effect on the water balance in drylands as plants may draw water not only from the unsaturated zone but also from the deeper saturated zone. While Acacia with roots deeper than 50 m have been reported very locally in the Kalahari (Canadell et al. 1996), it is assumed that in general trees transpire groundwater from a maximum depth of 20 m. This might result in local groundwater loss on the order of 20 - 30 mm/a (De Vries, Selaolo and Beekman 2000). However for areas with depths to groundwater 5 to 20 m, we wanted to attempt to verify whether transpiration occurs from the groundwater zone. Therefore, based on the Landsat TM 5 images used for this study, we determined the Transformed Vegetation Index (TVI) for the end of the dry season for the entire research area. The TVI for each area with depth to groundwater of 5 - 20 m was then compared with the TVI of the surrounding area with groundwater levels at more than 20 m (an area of approximately the same width as the area with shallow groundwater was considered for the comparison); for those areas with an increased TVI, transpiration was assumed. Discharge rates of 20 - 30 mm/a were estimated for these areas. In all, 18 regions in the study area show depths to groundwater between 5 and 20 m. Their size varies significantly from only a few km² to a very large area near Grootfontein. In the field, this large area appears to be characterised by Makalani palms. The presence of these palms indicates that the water is saltier than in the areas dominated by Acacia; this is consistent with the effects that would be caused by the predicted amounts of both evaporation and transpiration. While five of the areas in question are not significantly vegetated, many were found to be at least partly densely vegetated. The mapped transpiration area covers approximately 2700 km² of the study area; by extrapolation, groundwater loss by transpiration is estimated as 53,000,000 to 80,000,000 m³/a for the entire study area. During the observation of TVI for the entire study area we also found that areas with very shallow groundwater are mostly less vegetated than the areas with shallow groundwater. However, from the combination of the TVI and the depth to groundwater it turned out that zones of evaporation are not necessarily bordered by zones of transpiration, but that this combination occurs fairly often in the Kalahari. Using the maximum assumed evaporation and transpiration values of 100 and 30 mm/a, a total evapotranspiration loss for the research area from shallow and very shallow groundwater was calculated as 110,000,000 m³/a. Using the lower assumed values (80 and 20 mm/a for evaporation and transpiration, respectively) a total evapotranspiration loss for the research area of 79,000,000 m³/a was calculated. Approximately two thirds of the evapotranspiration loss from shallow and very shallow groundwater in the research area occurs from transpiration and only one third from evaporation. |
|
|
Calculating the groundwater balance(Back to top) Overall, an estimated groundwater balance of 140,000,000 to 730,000,000 m³/a was calculated. This amount is equivalent to 0.9 to 4.5 mm/a assuming an equal distribution to the entire catchment. In the minimum case (minimum recharge, maximum evapotranspiration) 45% of the potentially available recharge is lost during the subsequent flow in the groundwater system, while in the maximum case (maximum recharge, minimum evapotranspiration) the loss makes up only 10%. Conclusions(Back to top) With the Landsat TM 5 data used for this study, it is possible to define the major recharge zones and, consequently, to indicate areas that are most sensitive to any land use changes. Furthermore this approach promotes better understanding of dryland hydrological systems as it is possible to map the small-scale sub-systems, including evapotranspiration estimates. Our study also indicates how important the appropriate selection of the source data for groundwater recharge regionalisation is. As satellite images become more readily and cheaply available (e.g. data from the TERRA mission) remote sensing-based surface mapping is emerging as a tool for the future that should result in more appropriate groundwater resource management in drylands. However, field observations are also required for this approach; thus, it combines both "old-fashioned" techniques and modern tools. This project is of course academic and other projects might not have time or money for such detailed studies. Nevertheless it is important to remember how spatially variable recharge is, and to understand how important the selection of appropriate source data is to the development of regional plans for sustainable water management. Lacking such understanding, inappropriate decisions may be made, leading to potentially serious negative consequences for both local populations and for the environment as a whole. Endnotes(Back to top) The chloride mass balance method in the unsaturated zone has been largely used for arid areas (e.g. Allison and Hughes 1978) as the assumptions have proved to be largely valid there, making this an attractive method particularly because it is simple and inexpensive to use. The chloride mass balance method can also be applied in the saturated zone if the lateral groundwater inflow component is quantifiable. This is only possible at the groundwater divide. return to text (2) We used data from the GAB (Ullman, 1985; Allison and Barnes, 1986) as no data are available for the Kalahari and from all available data the climatic conditions in the GAB are most similar to the Kalahari. However, as the potential evaporation in the GAB is higher than in the study area, we used slightly smaller values. return to text References(Back to top) Allison, G.B. and M.W. Hughes. 1978. The use of environmental tritium and chloride to estimate total local recharge to an unconfined aquifer. Australian Journal of Soil Sciences 16:181-195. Canadell, J., R.B. Jackson, J.R. Ehleringer, H.A. Mooney, O.E. Sala, and E.-D. Schulz. 1996. Maximum rooting depth of vegetation types at the global scale. Oecologia 108:583-595. De Vries, J.J., E. Selaolo, and H.E. Beekman. 2000. Groundwater recharge in the Kalahari, with reference to paleo-hydrologic conditions. Journal of Hydrology 238:110-123. Gieske, A. 1992. Dynamics of groundwater recharge - a case study in semi-arid eastern Botswana. Amsterdam: Free University Amsterdam. Klock, H., C. Külls, and P. Udluft. 2001. Estimating recharge values using hydrochemical and geological data: a case study from the semiarid Kalahari catchment of northern Namibia. In Impact of Human Activity on Groundwater Dynamics, ed. H. Gehrels, N.E. Peters, E. Hoehn, K. Jensen, C. Leibundgut, J. Griffioen, B. Webb, and W.J. Zaadnoordijk. IAHS Publication no. 269. Külls, C. 2000. Groundwater of the north-western Kalahari, Namibia - Estimation of recharge and quantification of the flow system. Wuerzburg: University of Wuerzburg. Miller, R.M. and K.E.L. Schalk. 1980. Geological Map of Namibia. Windhoek: Geological Survey of Namibia. Ullman, W.J. 1985. Evaporation from a salt pan: Estimation from chemical profiles near surface groundwater. Journal of Hydrology 79:365-373. |
![]()
(Back to top)
Heike Klock is a Post-doctoral researcher at the LFB Hydrogeology in Wuerzburg,
Germany. She is working in close co-operation with the Department of Water Affairs
in Windhoek, Namibia. You can contact her as follows:
Heike Klock
LFB Hydrogeology
Pleicherwall 1
97070 Wuerzburg
Germany
Tel. ++49-931-312678
Fax ++49-931-53436
Email: heike.klock@mail.uni-wurzburg.de
Peter Udluft is the head of the LFB Hydrogeology in Wuerzburg. You can reach him at udluft@mail.uni-wuerzburg.de
Department of Hydrogeology and Environment University of Würzburg,
Germany
http://www.uni-wuerzburg.de/hydrogeologie/index_e.html
International Association of Hydrological Sciences
http://www.cig.ensmp.fr/~iahs/
Department of Civil Engineering, Stellenbosch University, South Africa
http://www.civeng.sun.ac.za
About the Arid Lands Newsletter