< Back to Climate Viticulture Newsletter
Hello, everyone!
This is the May 2025 issue of the Climate Viticulture Newsletter – a quick look at some timely climate topics relevant to wine grape growing in Arizona.
IN THIS ISSUE
- A Recap of April Temperature and Precipitation
- The Outlook for May Temperature and Precipitation
- A Review of the 2024-2025 Dormant Season
- Timing of Bud Break at Buhl Memorial Vineyard
- Extra Notes
A Recap of April Temperature and Precipitation
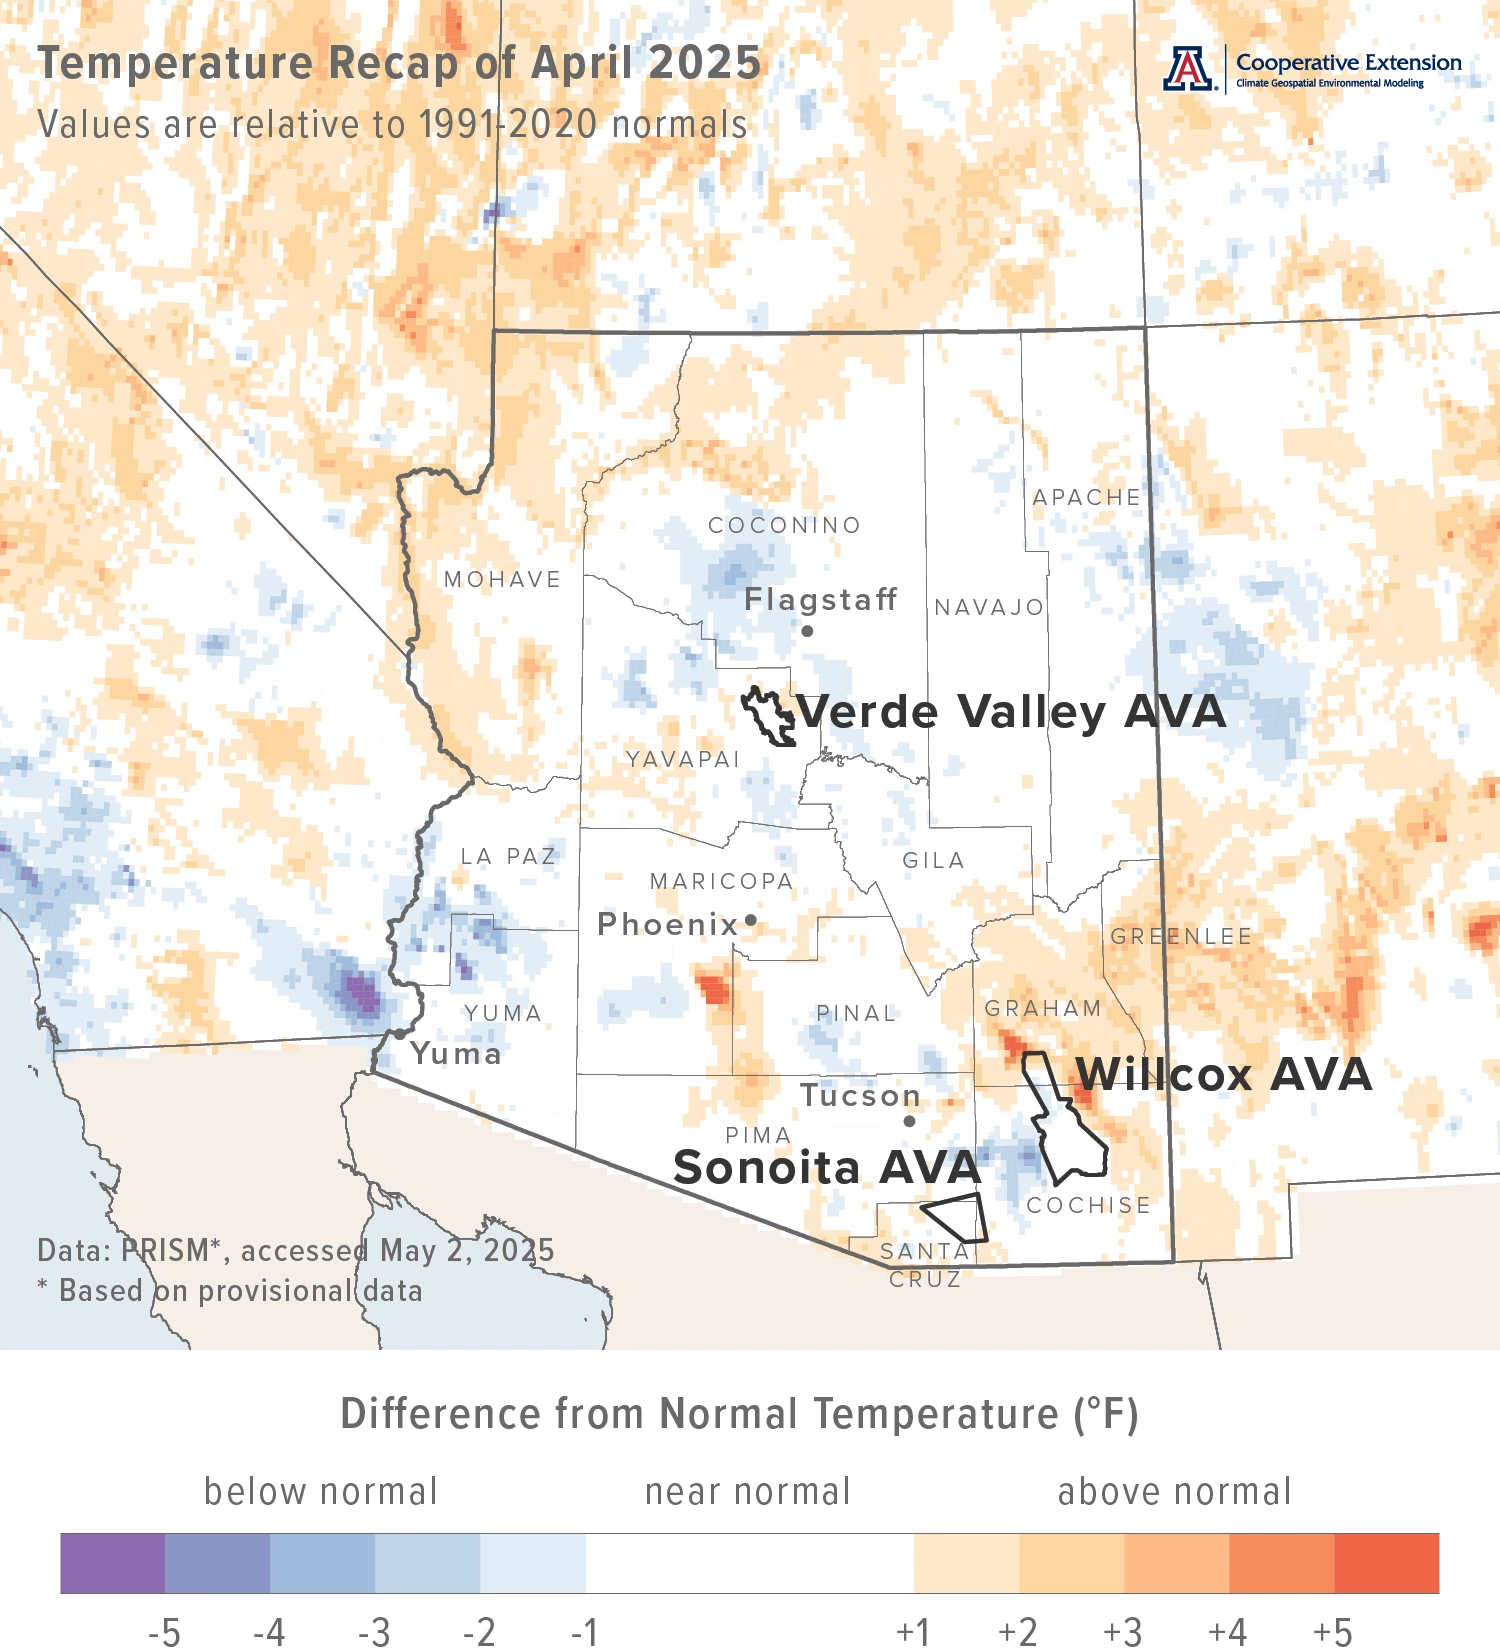
Monthly average temperatures were within 2 °F of the 1991-2020 normal for almost all of Arizona (light blue, white, and light orange areas on map), including all three Arizona AVAs. For reference, monthly average temperatures in April last year were 1 to 4 °F below normal for much of the southern half of Arizona, and near normal for much of the rest of the state.
Area-average maximum and minimum temperatures during April 2025 were 73.4 and 42.2 °F for the Sonoita AVA, 75.5 and 42.7 °F for the Verde Valley AVA, and 76.9 and 41.7 °F for the Willcox AVA. Respective April normals are 73.5 and 41.9 °F, 75.5 and 42.6 °F, and 76.7 and 42.0 °F.
Temperature last month ranged between 92.7 and 32.4 °F at the AZMet Bonita station and between 93.4 and 29.1 °F at the AZMet Willcox Bench station.
Jeremy Weiss
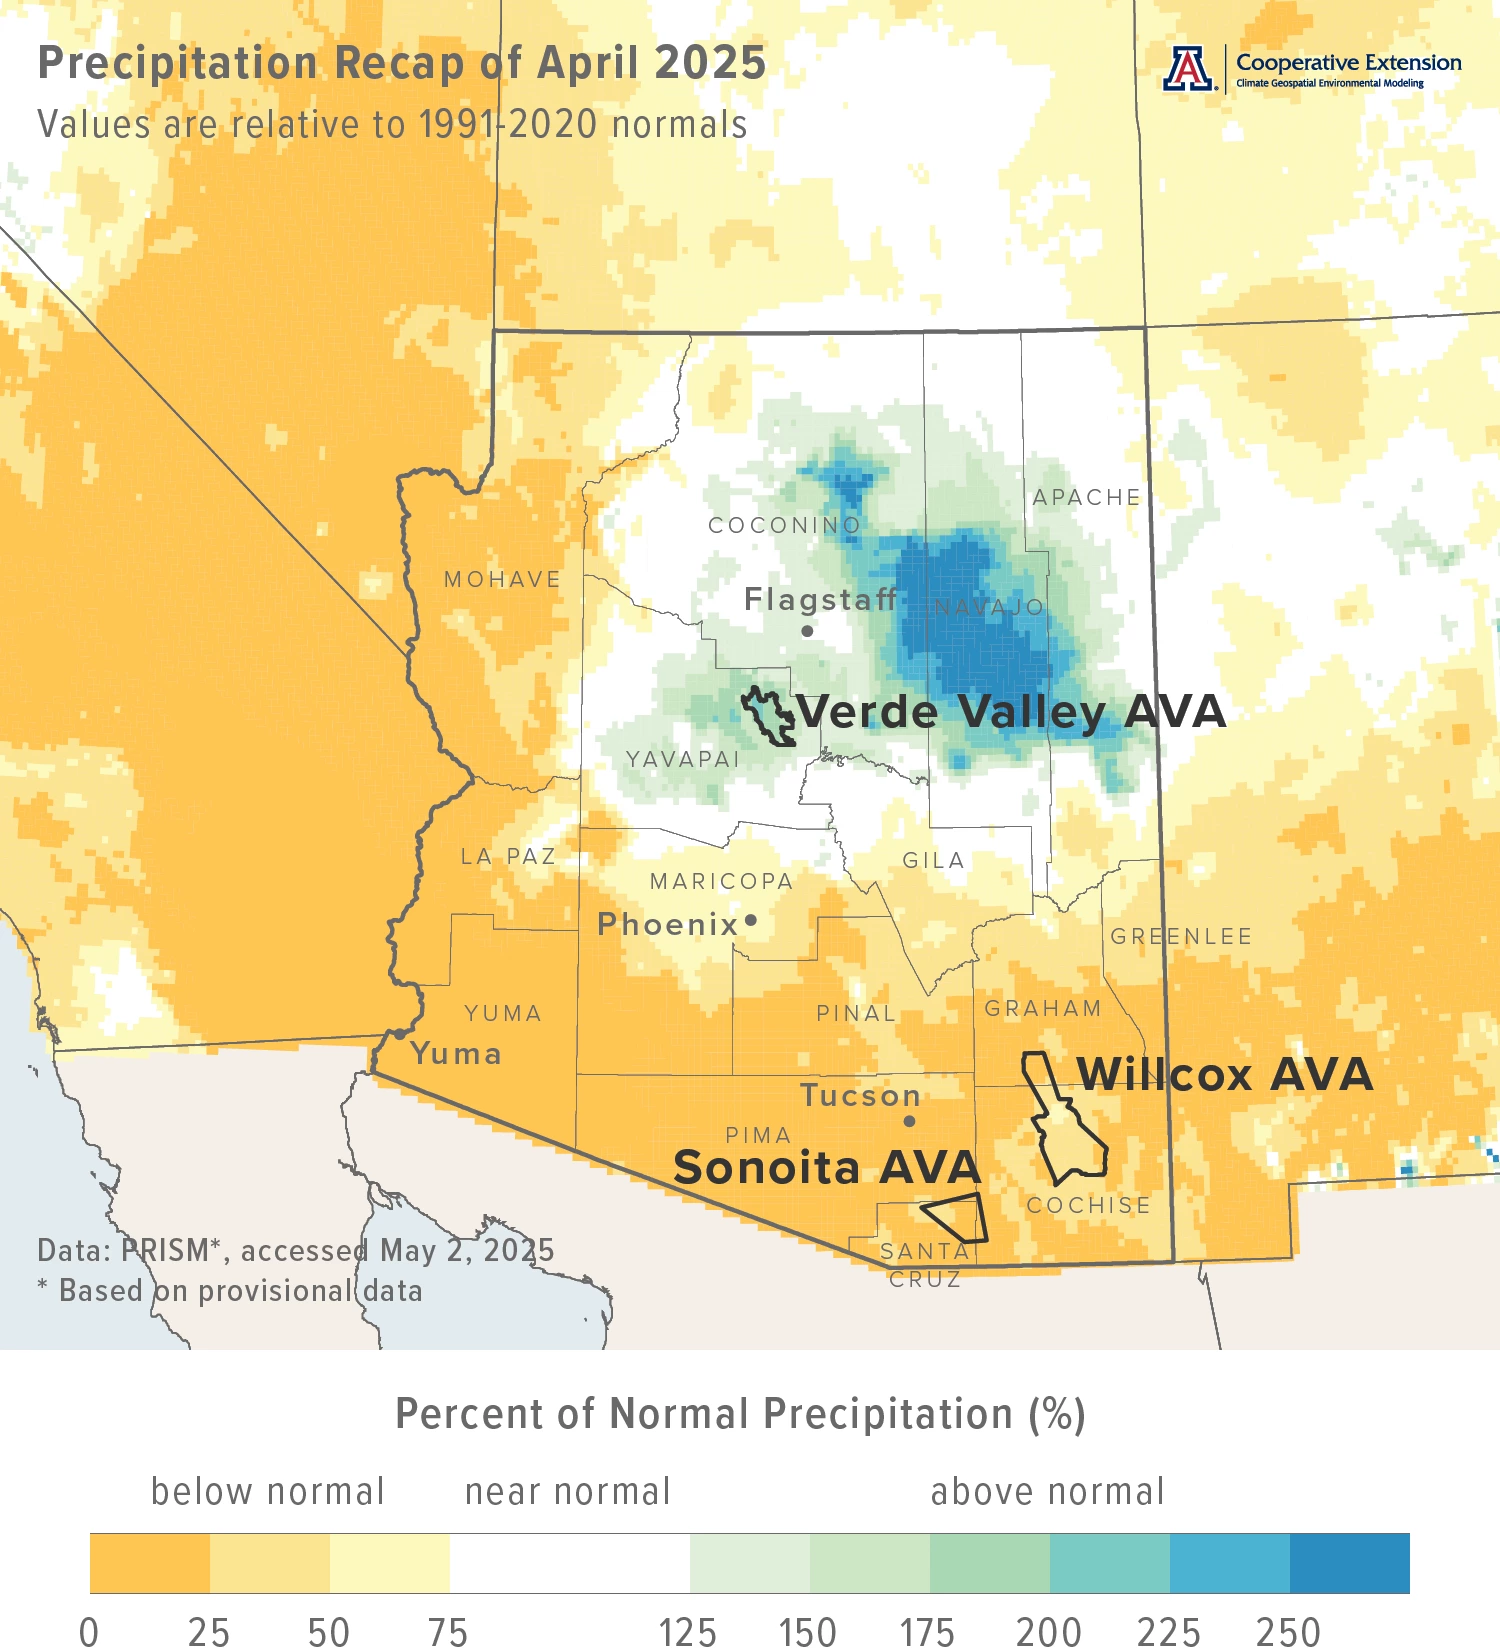
Monthly precipitation totals were less than 50 % of normal for much of western and southern Arizona (yellow and dark yellow areas on map), including the Sonoita and Willcox AVAs. These areas transitioned to one in north-central and northwestern parts of the state where amounts were greater than 125 % of normal (various aqua and blue areas on map), including the Verde Valley AVA. Otherwise, totals were near normal (white areas on map). Precipitation during April 2024 was more than 200 % of normal for much of the southern half of Arizona. These areas of above-normal amounts transitioned to near-normal ones in much of the northern half.
Area-average total precipitation in April 2025 was 0.09 inches for the Sonoita AVA, 0.99 inches for the Verde Valley AVA, and 0.08 inches for the Willcox AVA. Respective April normals are 0.38, 0.55, and 0.25 inches.
Total precipitation last month was 0.00 and 0.01 inches at the AZMet Bonita and Willcox Bench stations, respectively.
Dig further into daily weather summaries for the AZMet Bonita and Willcox Bench stations in the Willcox AVA
Learn more about PRISM climate data
Jeremy Weiss
The Outlook for May Temperature and Precipitation
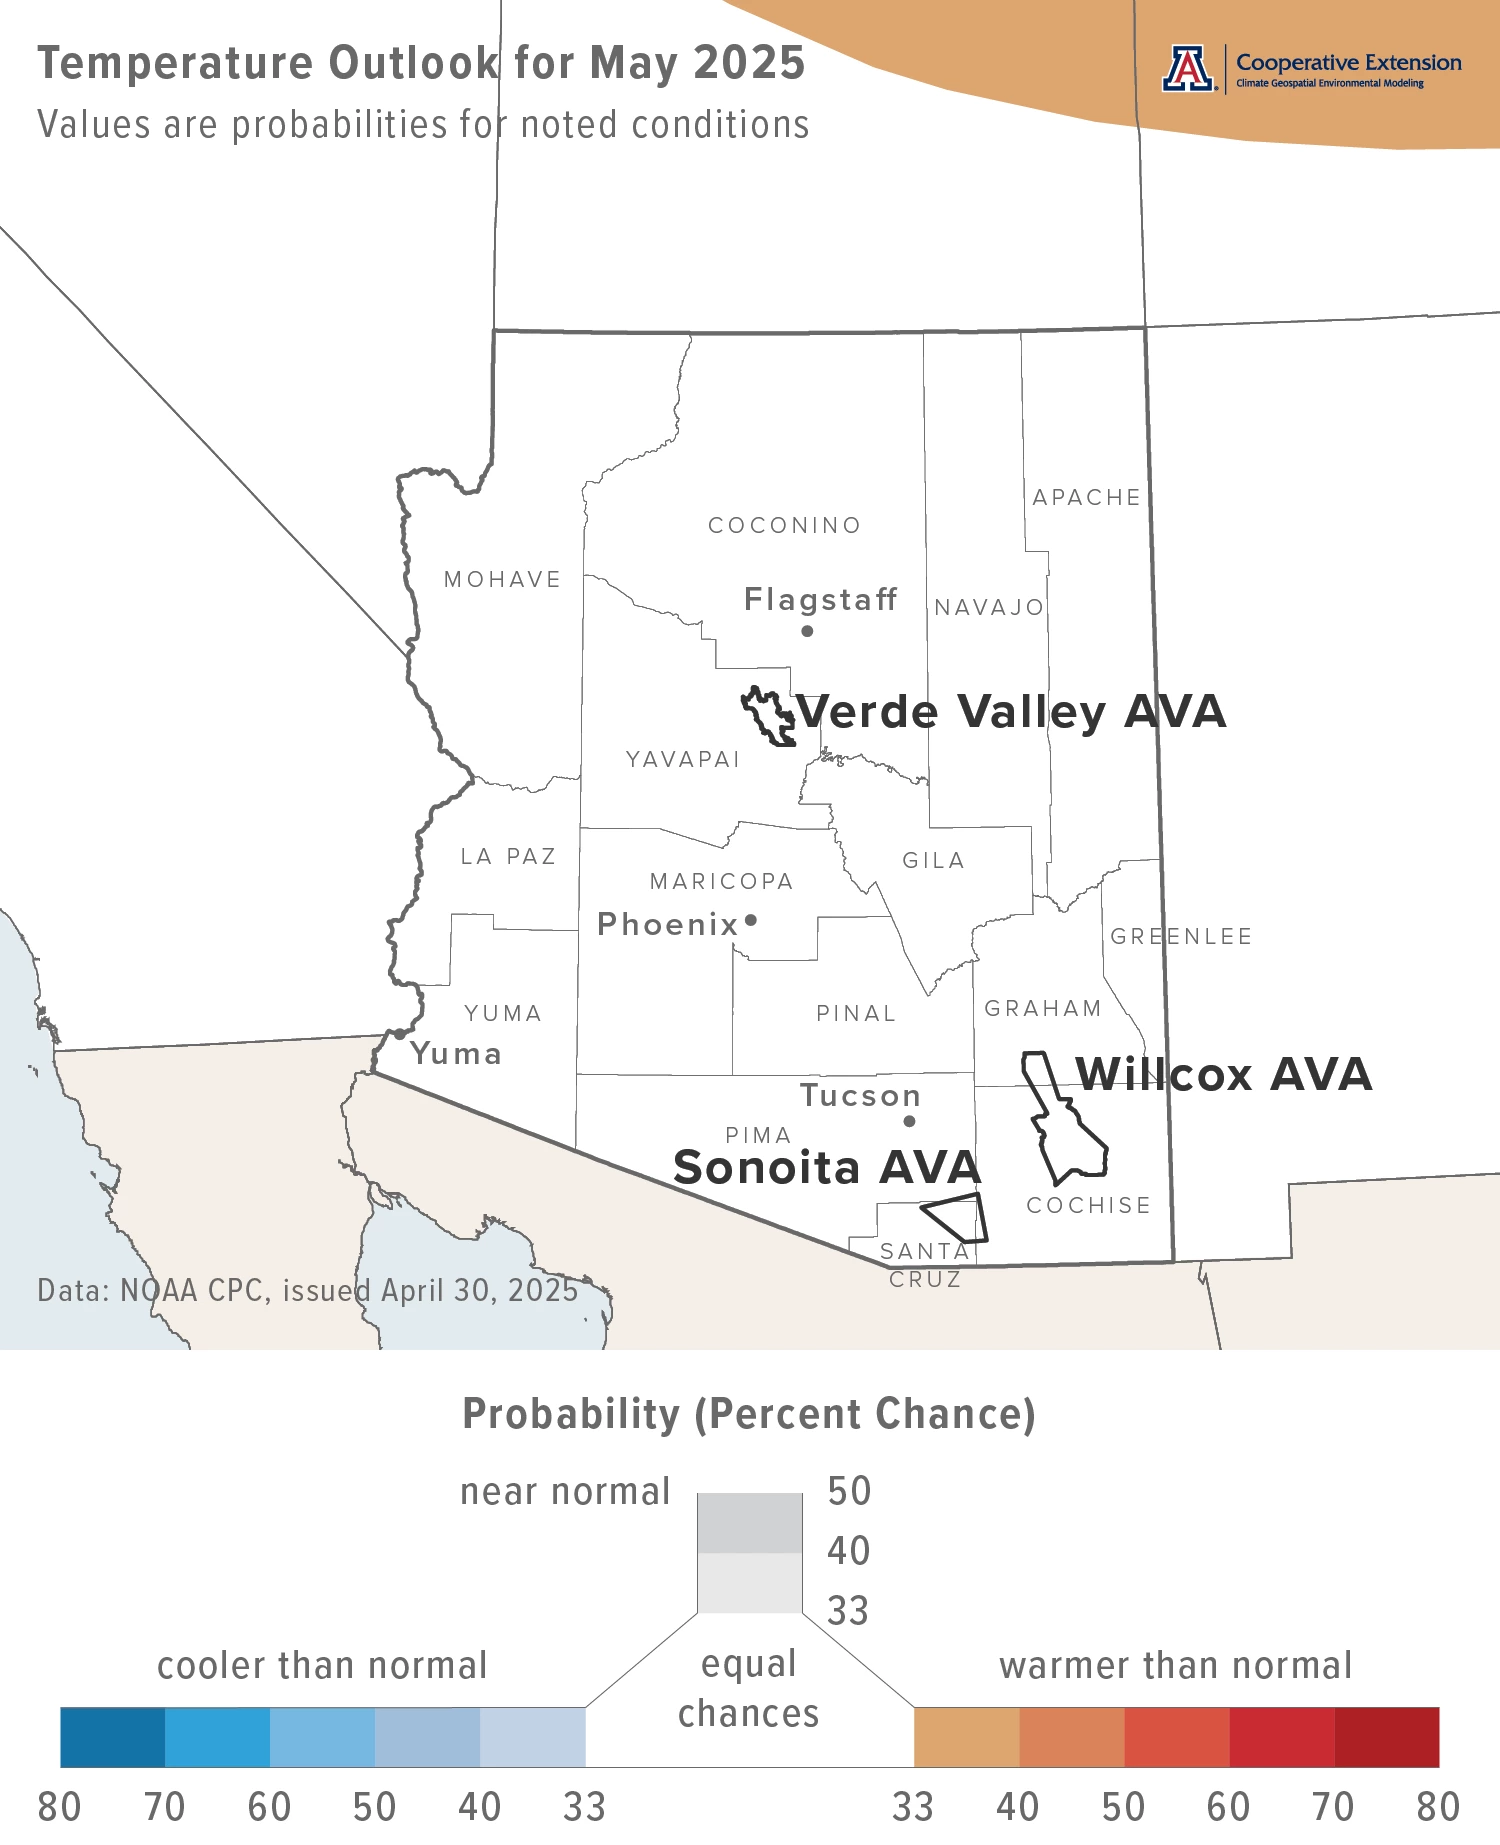
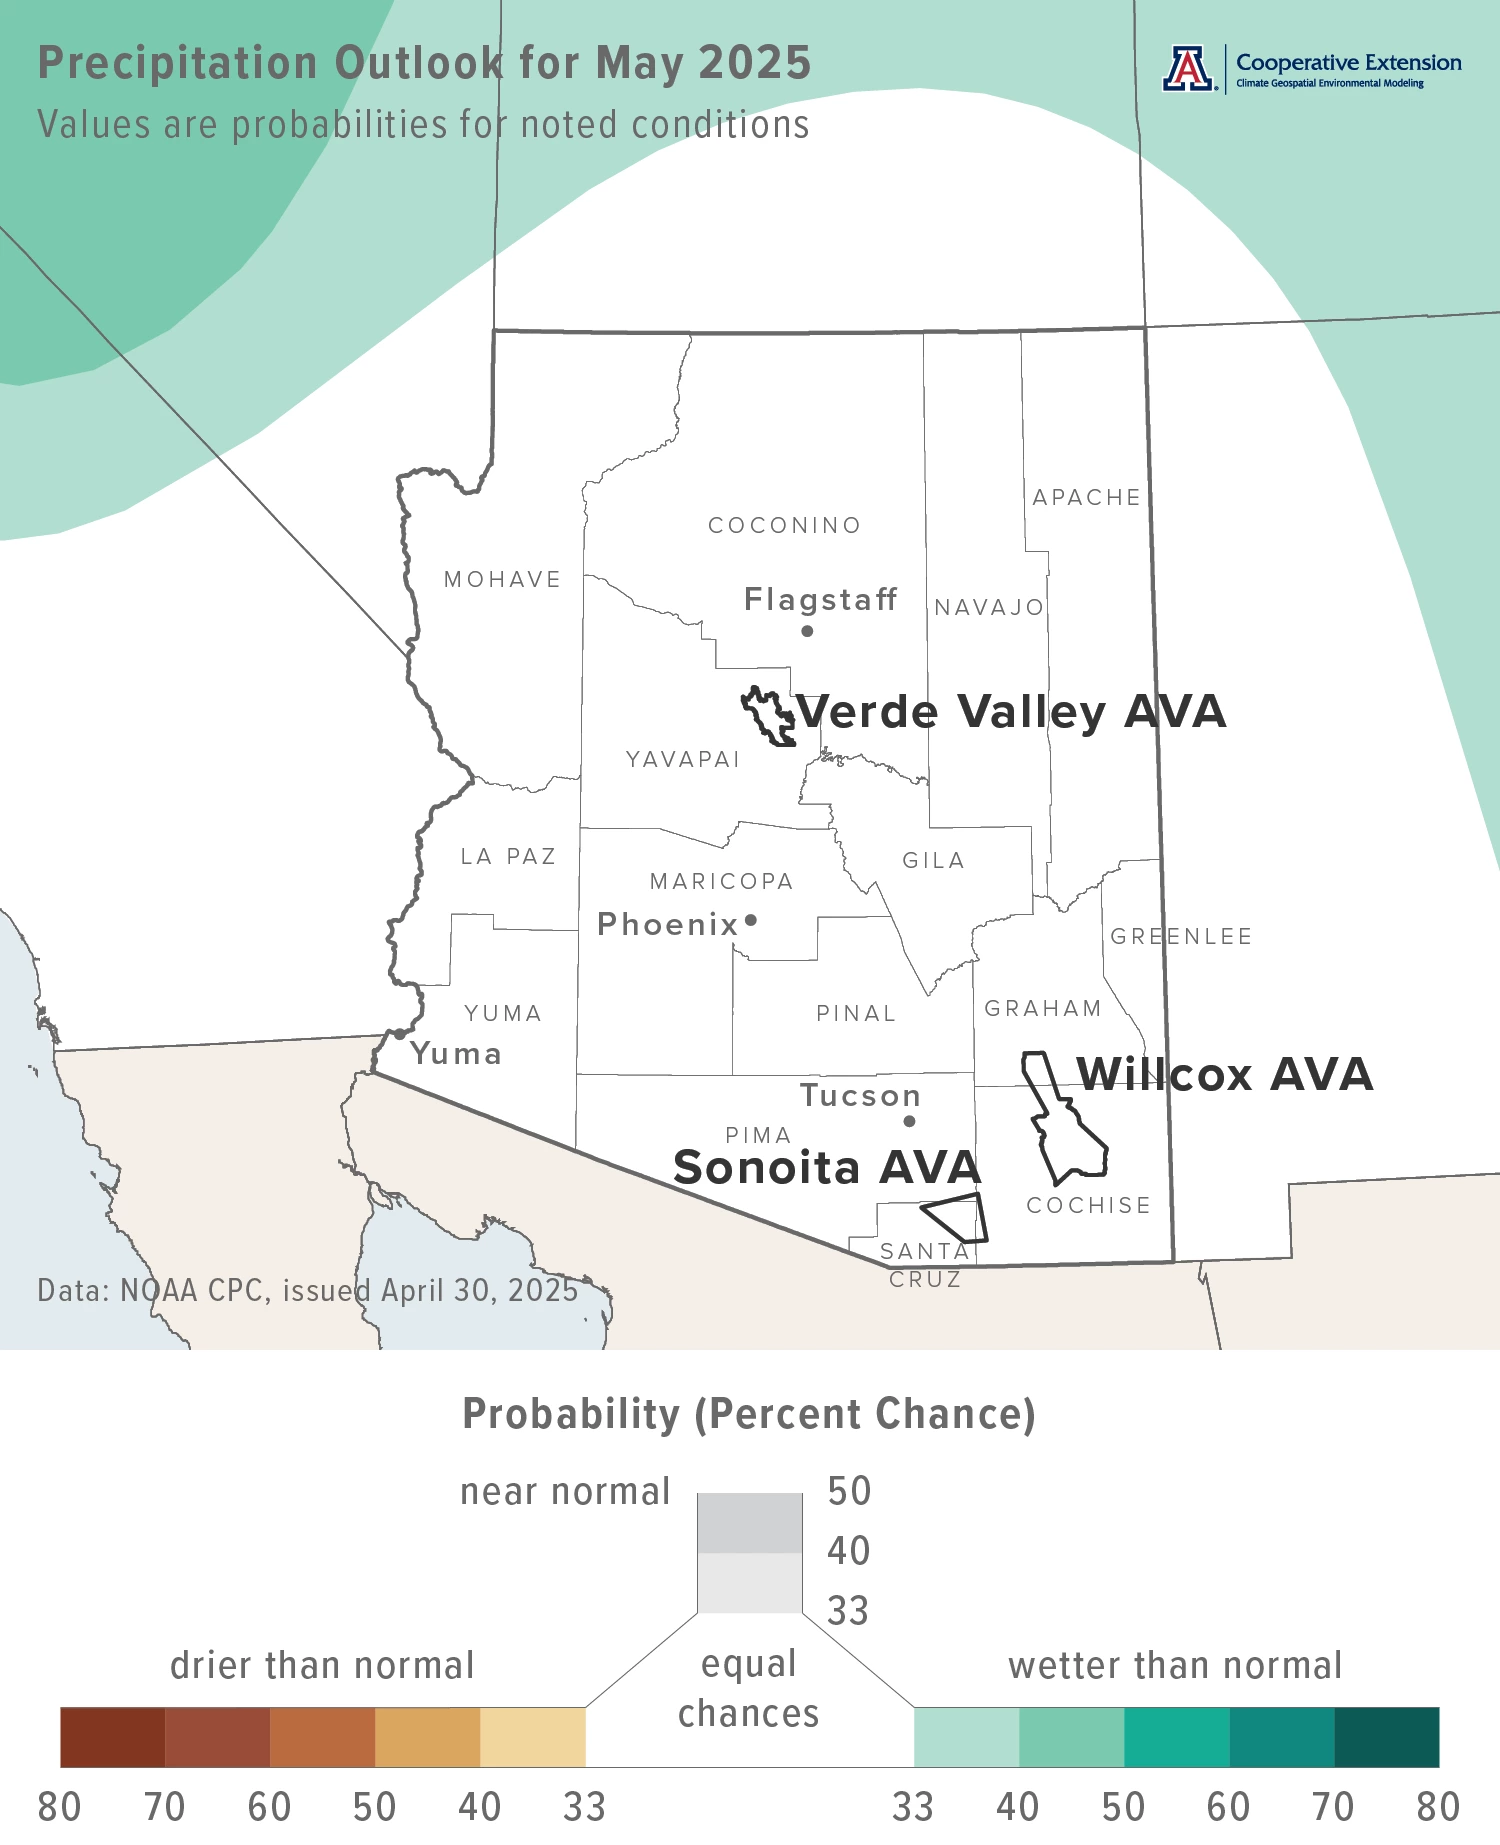
Temperatures over the course of this month have equal chances for being below, near, or above the 1991-2020 normal across all of Arizona (white area on map). Monthly average temperatures in May last year were within 2 °F of normal for almost all of the state.
Area-average maximum and minimum temperatures during May 2024 were 81.6 and 47.7 °F for the Sonoita AVA, 85.1 and 49.1 °F for the Verde Valley AVA, and 84.1 and 47.4 °F for the Willcox AVA. Respective May normals are 81.7 and 49.6 °F, 84.5 and 50.0 °F, and 84.8 and 48.9 °F.
Temperature in May last year ranged between 94.3 and 37.6 °F at the AZMet Bonita station and between 96.4 and 38.5 °F at the AZMet Willcox Bench station.
Jeremy Weiss
Precipitation totals for this month have equal chances for below-, near-, or above-normal totals (white area on map). Precipitation during May 2024 was less than 25 % of normal for almost all of Arizona.
Area-average precipitation totals in May 2024 were 0.00 inches for the Sonoita AVA, 0.00 inches for the Verde Valley AVA, and 0.00 inches for the Willcox AVA. Respective May normals are 0.22, 0.44, and 0.29 inches.
Total precipitation in May last year was 0.00 and 0.00 inches at the AZMet Bonita and Willcox Bench stations, respectively.
To stay informed of long-range temperature and precipitation possibilities beyond the coverage of a standard weather forecast, check in, too, with the six-to-ten-day outlook and eight-to-fourteen-day outlook issued daily by NOAA’s Climate Prediction Center.
Jeremy Weiss
A Review of the 2024-2025 Dormant Season
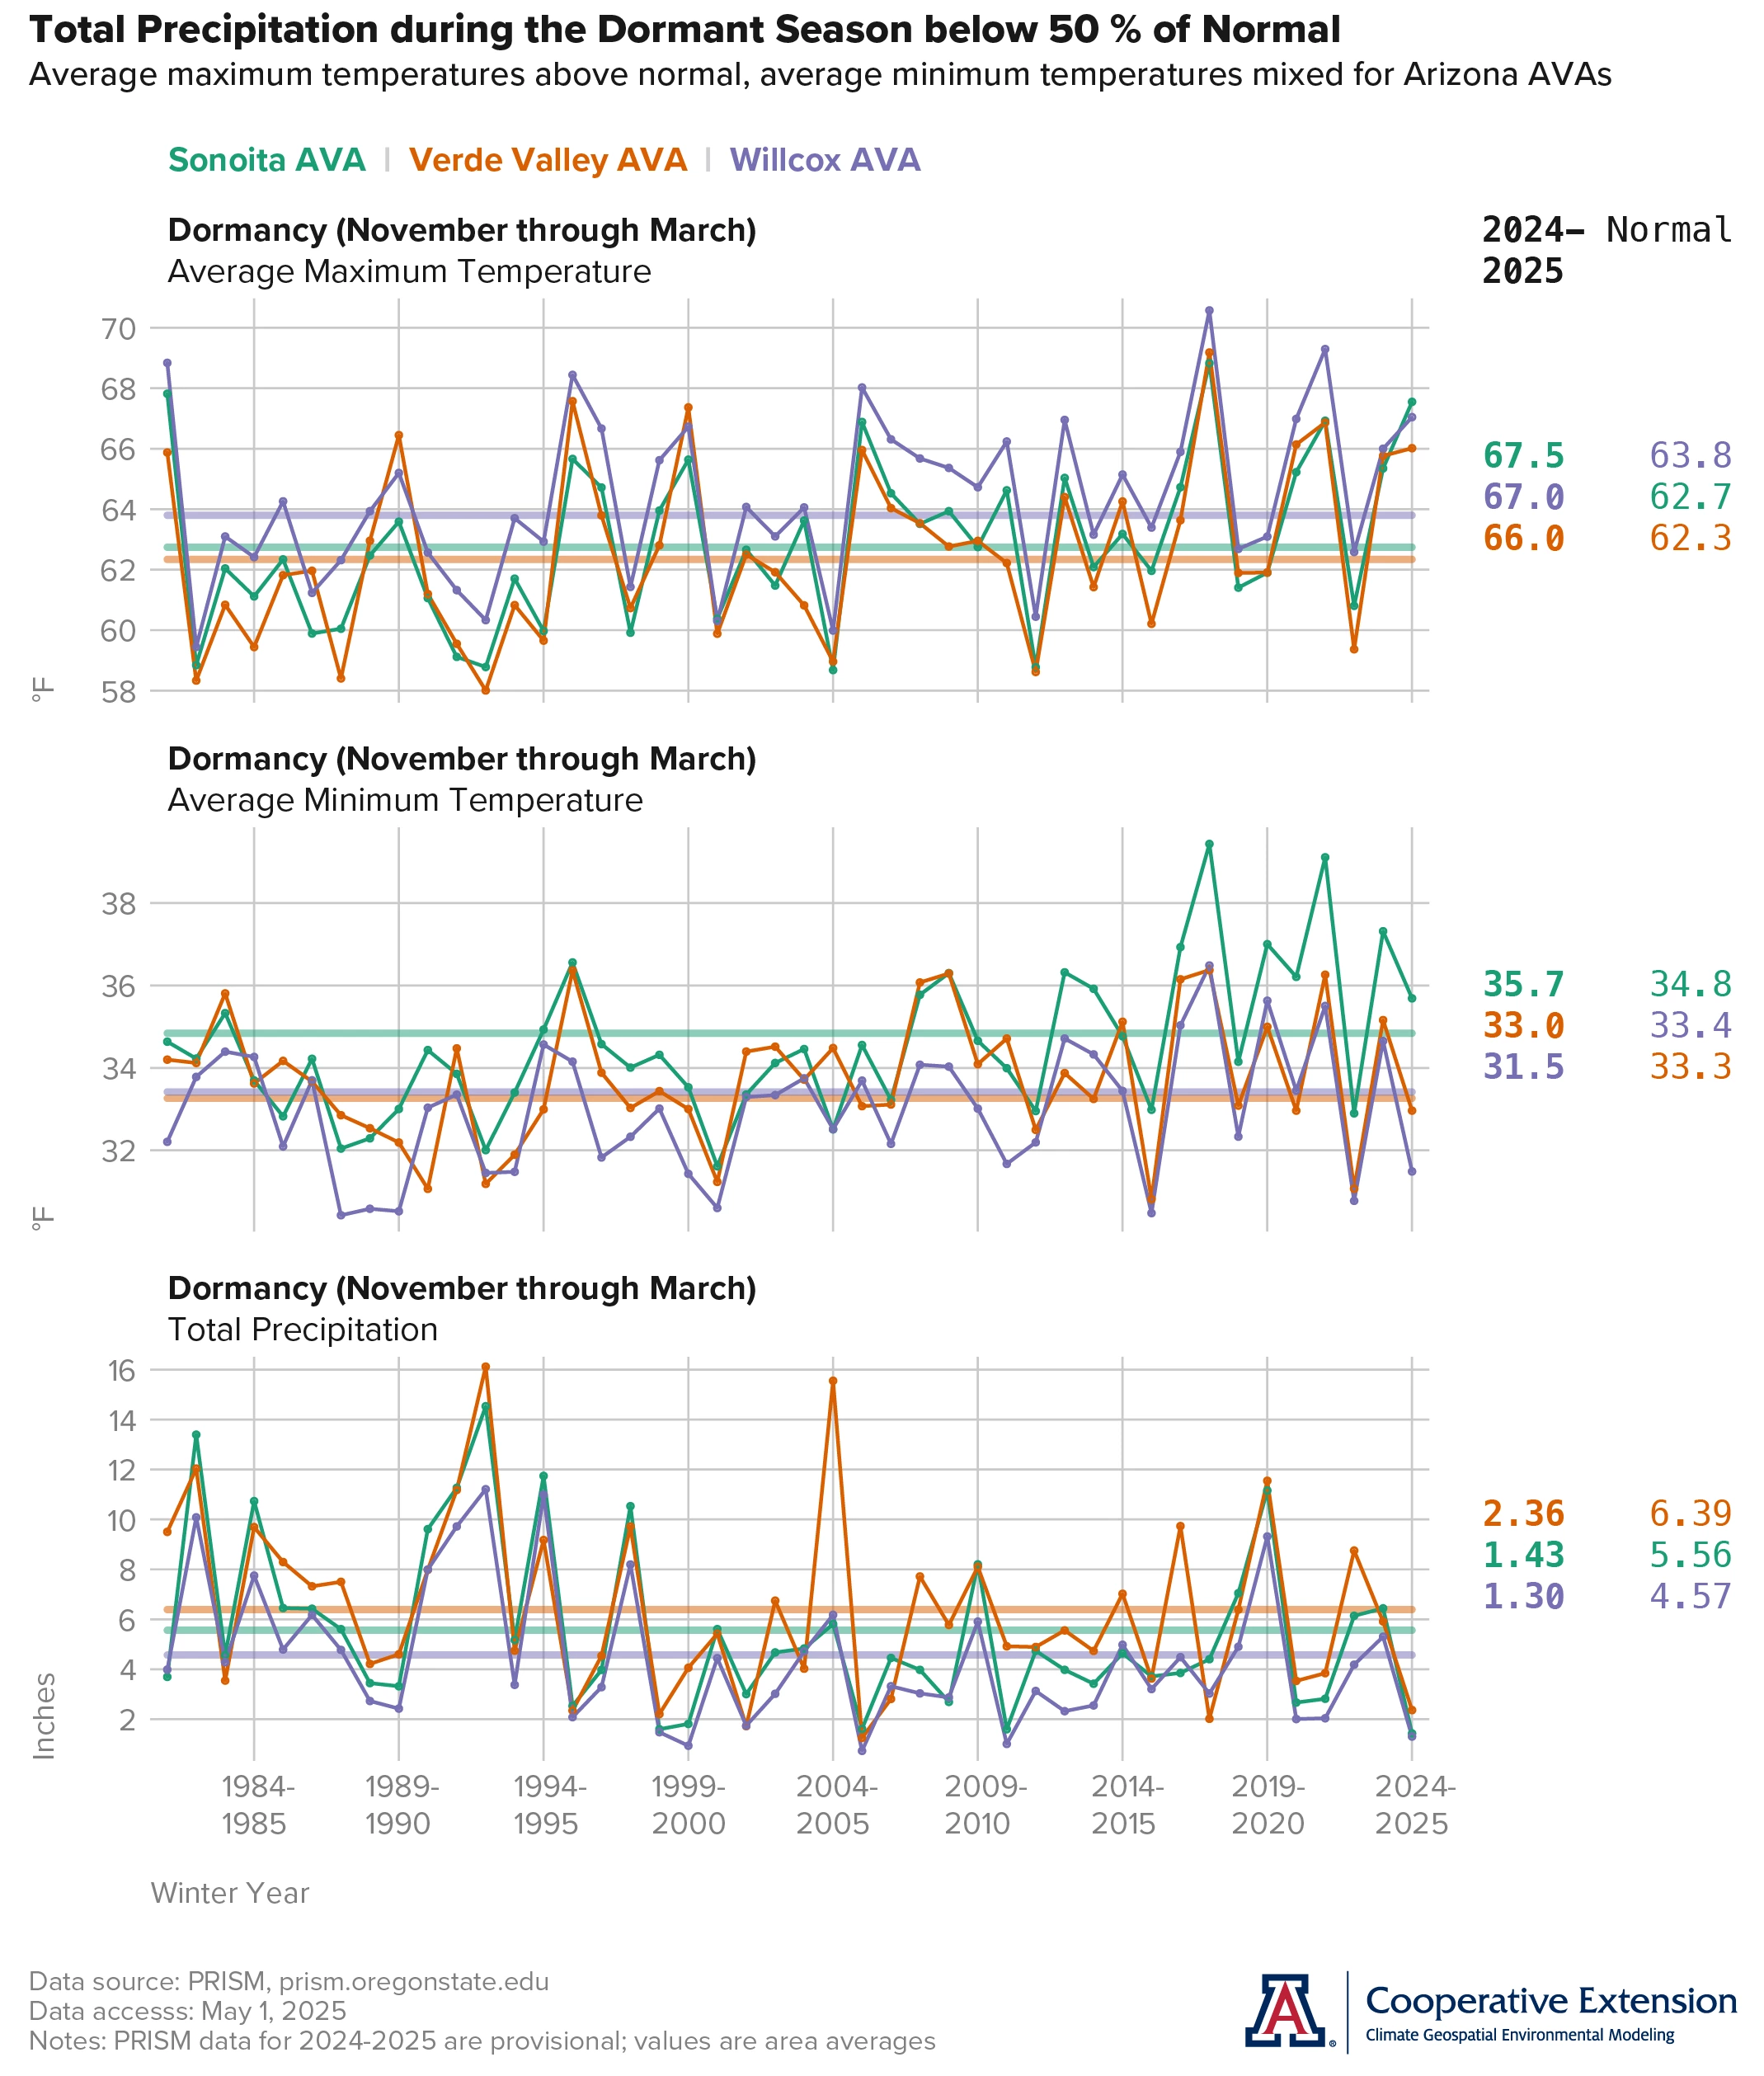
With the start of the 2025 growing season, it’s time to review this past dormant season. Much like the recent reviews of the 2024 growing season in the January and February newsletter issues, we focus on average maximum and minimum temperatures (top and middle graphs, respectively) as well as total precipitation (bottom graph) in the three Arizona AVAs. We also add some statistics from the AZMet Bonita and Willcox Bench stations in the Willcox AVA at the end of this section.
Average maximum temperatures during the period from November through March were above the 1991-2020 normal (horizontal, colored lines on graphs) for all three Arizona AVAs (values to the right of the graphs). For the Verde Valley and Willcox AVAs (orange and purple lines and values, respectively), these differences were 3 to 4 °F, while 4 to 5 °F for the Sonoita AVA (green lines and values). One only needs to go back to the 2023-2024 November-through-March period to find similar anomalies.
Average minimum temperatures during this past dormant season were mixed relative to normal for the three Arizona AVAs. Values were about 1 °F above normal for the Sonoita AVA, near normal for the Verde Valley AVA, and about 2 °F below normal for the Willcox AVA. Regardless, the average minimum temperature over this four-month period for all three areas is near freezing.
Precipitation totals from November through March were below 50 % of normal for all three Arizona AVAs. Normal amounts range from near 4.50 inches in the Willcox AVA to almost 6.50 inches in the Verde Valley AVA. Amounts this past dormant season ranged from 1.30 inches in the Willcox AVA to 2.36 inches in the Verde Valley AVA. Recent and similar past dormant seasons include 2021-2022 and 2020-2021.
Average daily maximum and minimum temperatures during this past dormant season were 66.2 and 31.5 °F at the AZMet Bonita station, with the highest temperature of 86.2 °F on March 25, 2025, and the lowest of 14.2 °F on January 22, 2025. Total precipitation and evapotranspiration was 1.34 and 17.27 inches, respectively. Respective values for the AZMet Willcox Bench station were 67.7 and 31.0 °F, 86.7 °F on March 25, 2025, 12.4 °F on January 24, 2025, and 0.94 and 17.76 inches.
Jeremy Weiss
Timing of Bud Break at Buhl Memorial Vineyard
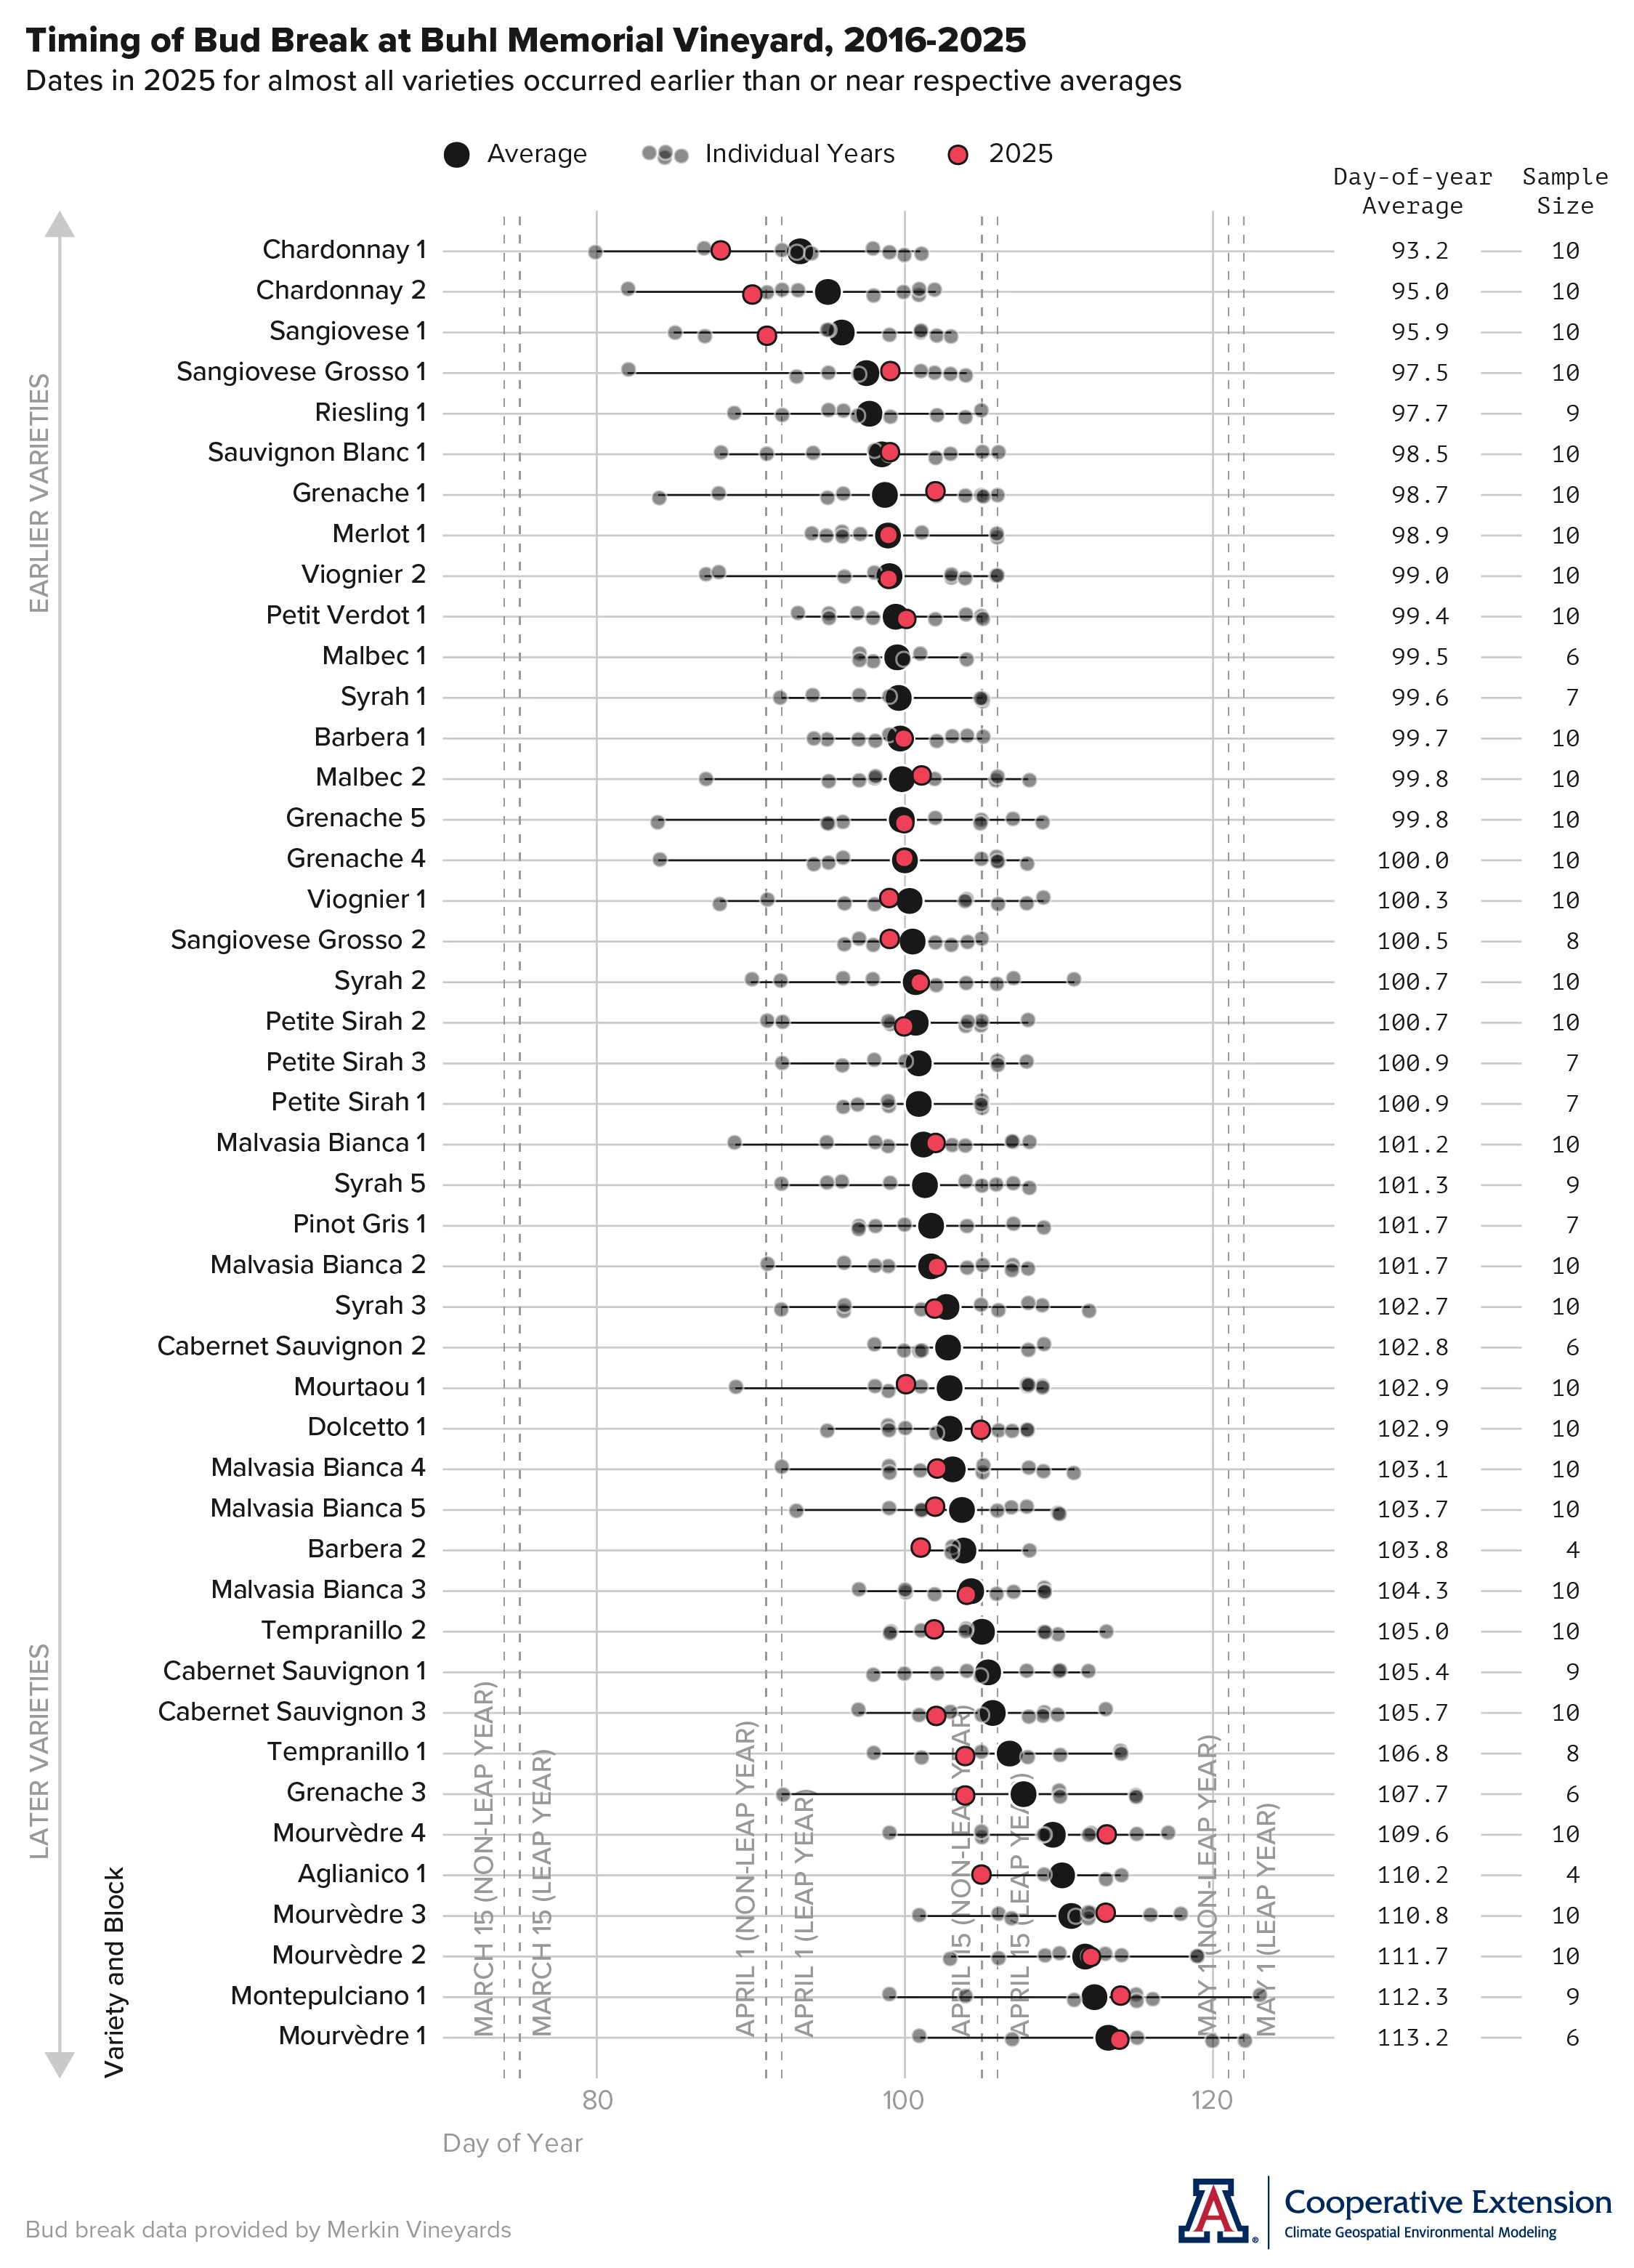
With the start of the 2025 growing season, it’s also time to return to the initial phenology data set we’re analyzing for our new project about the effects of Arizona climate on the timing of wine grape growth stages. Dates for bud break in 2025 are in from Buhl Memorial Vineyard near the AZMet Willcox Bench station and in the south-central Willcox AVA, and we’ve added them here to the infographic we first showed in March.
Before describing the various parts of the infographic, a few points based on the new data. Dates for bud break in 2025 for almost all variety blocks occurred earlier than or near respective averages (red and black data points, respectively), a result suggested by chill and heat accumulation at the beginning of March and April. The largest differences for varieties with earlier-than-average dates for bud break this year are on the order of three to five days. Earlier-than-average dates appear to cluster at the beginning of bud break for the vineyard in late March with the earliest variety blocks and during the second week of April with some of the later variety blocks. Values for day-of-year averages and sample sizes are updated with 2025 data (number columns to the right of the graph).
Now, a description of the various parts of the infographic, which might help one in adding to the list of take-away points from these data. Varieties and their respective blocks are along the vertical axis of the graph, ordered from top to bottom by increasing average day of year of bud break, that is, from earlier to later. Direction of ordering also appears along the far left of the infographic, as the gray line with arrow end points. Day-of-year averages for each variety and block are the larger black points in the graph, and day of year of bud break for individual years are the smaller semi-transparent points. Day of year for bud break dates in 2025 are the red points. Black lines underlying these points extend from the earliest day of year of bud break to the latest for each variety and block, representing the range of bud-break dates. Day-of-year values are along the horizontal axis of the graph. Conversion of these values to corresponding month and day appear as dashed gray vertical lines, with text near the bottom of the graph. Day-of-year average values for each variety and block are the left column of numbers at the right of the graph, with corresponding sample sizes in the right column.
If you have growth-stage dates for different varieties in your vineyard that you’d like to add to this analysis and the overall project, please let us know.
Jeremy Weiss
Extra Notes
Given recent and current conditions, there is an above-normal potential for significant wildland fires across the central, east-central, and southeastern parts of Arizona in May. Otherwise across the state, the outlook from the National Interagency Fire Center shows potential as normal for the month.
There is a new online resource for the most recent 15-minute data from stations across the Arizona Meteorological Network, AZMet in Real-time, including the Bonita and Willcox Bench stations in the Willcox AVA.
Although we’re at the time of year when forecast accuracy is relatively low for El Niño and La Niña events, expectations favor ENSO-neutral conditions this summer, with a greater than 50 % chance of persisting through the August-through-October 2025 period.
For those of you in southeastern Arizona, including the Sonoita and Willcox AVAs, Cooperative Extension manages an email listserv in coordination with the Tucson forecast office of the National Weather Service to provide information in the days leading up to agriculturally important events, like late spring freezes and high-wind days. Please contact us if you'd like to sign up.
And for those of you in north-central and northeastern Arizona, including the Verde Valley AVA, Cooperative Extension also now manages an email listserv in coordination with the Flagstaff forecast office of the National Weather Service to provide similar information for this part of the state. Please contact us if you'd like to sign up.
Undergraduate students in the College of Agriculture and Life Sciences at the University of Arizona are looking for internships with businesses and companies in the viticulture and winery industries. Please contact Danielle Buhrow, Senior Academic Advisor and Graduate Program Coordinator in the Department of Agricultural and Resource Economics, for more information.
Please feel free to give us feedback on this issue of the Climate Viticulture Newsletter, suggestions on what to include more or less often, and ideas for new topics.
Did someone forward you this newsletter? Please contact us to subscribe.
Have a wonderful May!
With current and past support from: