< Back to Climate Viticulture Newsletter
Hello, everyone!
This is the April 2025 issue of the Climate Viticulture Newsletter – a quick look at some timely climate topics relevant to wine grape growing in Arizona.
IN THIS ISSUE
- A Recap of March Temperature and Precipitation
- The Outlook for April Temperature and Precipitation
- Vine Dormancy and the Start of the Growing Season
- Conditions for Bud Break at Buhl Memorial Vineyard
- Extra Notes
A Recap of March Temperature and Precipitation
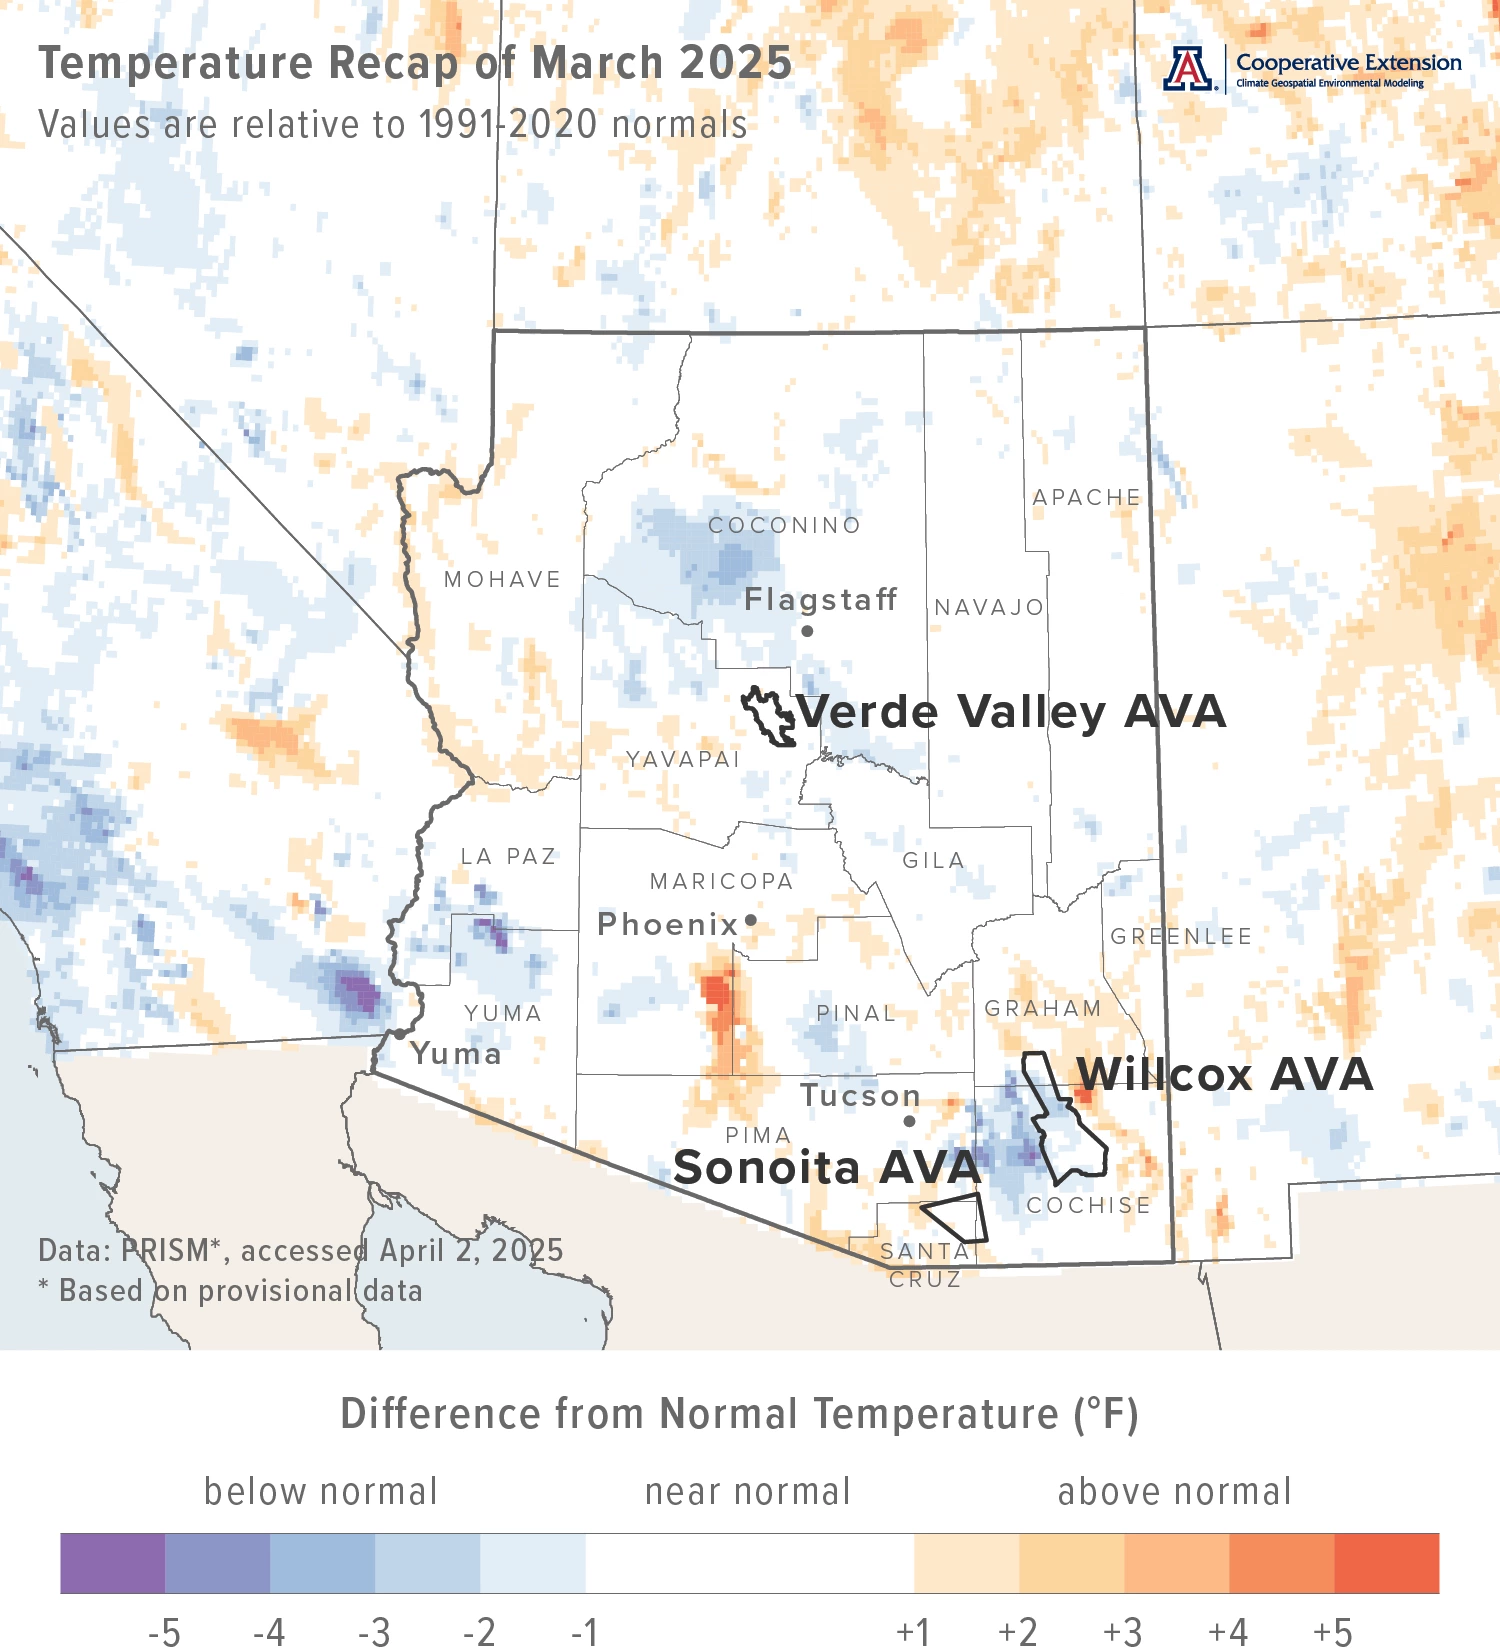
Monthly average temperatures were near the 1991-2020 normal for much of Arizona (white areas on map), including the Sonoita and Verde Valley AVAs. Otherwise, scattered areas posted values either 1 to 3 °F above normal (light orange and orange areas on map) or 1 to 3 °F below normal (light blue and blue areas on map), including parts of the Willcox AVA. For reference, monthly average temperatures in March last year were 1 to 4 °F below normal for almost all of the state.
Area-average maximum and minimum temperatures during March 2025 were 67.4 and 37.0 °F for the Sonoita AVA, 67.8 and 38.2 °F for the Verde Valley AVA, and 68.5 and 35.8 °F for the Willcox AVA. Respective March normals are 67.1 and 36.9 °F, 68.0 and 37.6 °F, and 69.4 and 37.1 °F.
Temperature last month ranged between 86.2 and 27.3 °F at the AZMet Bonita station and between 86.7 and 25.5 °F at the AZMet Willcox Bench station.
Jeremy Weiss
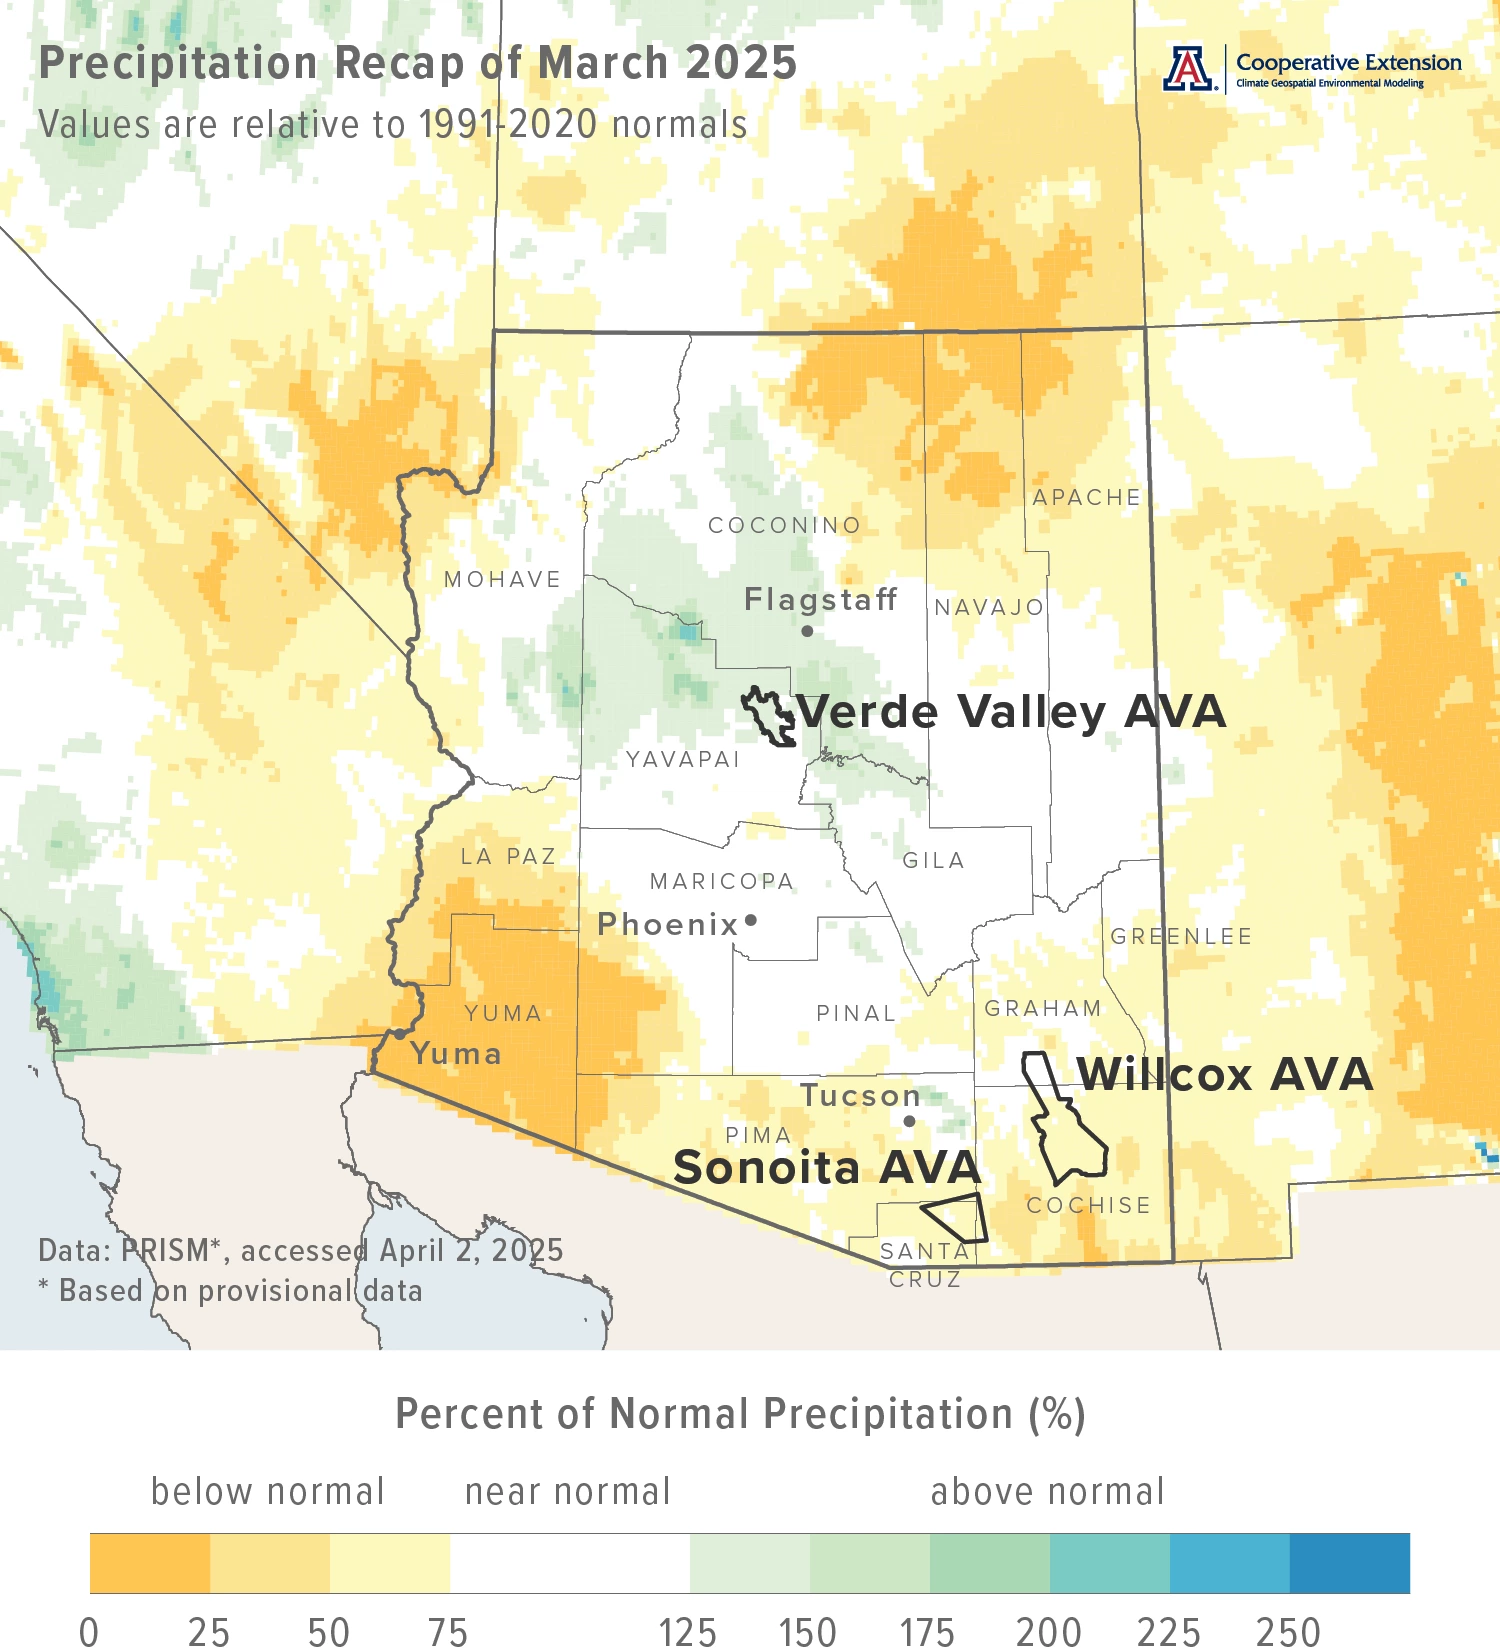
Monthly precipitation totals were less than 75 % of normal for the northeastern, southeastern, southwestern, and northwestern parts of the state (light yellow, yellow, and dark yellow areas on map), including the Sonoita and Willcox AVAs. In contrast, amounts were 125 to 200 % above normal for an area in north-central Arizona (light aqua, aqua, and dark aqua areas on map), including the Verde Valley AVA. Elsewhere across the state, totals were near normal (white areas on map). Precipitation during March 2024 was more than 125 % of normal for much of the northern half of Arizona and some of the south-central and southeastern parts of the state. Otherwise, and except for extreme southwestern Arizona, totals were near normal.
Area-average total precipitation in March 2025 was 0.66 inches for the Sonoita AVA, 1.68 inches for the Verde Valley AVA, and 0.51 inches for the Willcox AVA. Respective March normals are 0.97, 1.31, and 0.76 inches.
Total precipitation last month was 0.92 and 0.25 inches at the AZMet Bonita and Willcox Bench stations, respectively.
Dig further into daily weather summaries for the AZMet Bonita and Willcox Bench stations in the Willcox AVA
Learn more about PRISM climate data
Jeremy Weiss
The Outlook for April Temperature and Precipitation
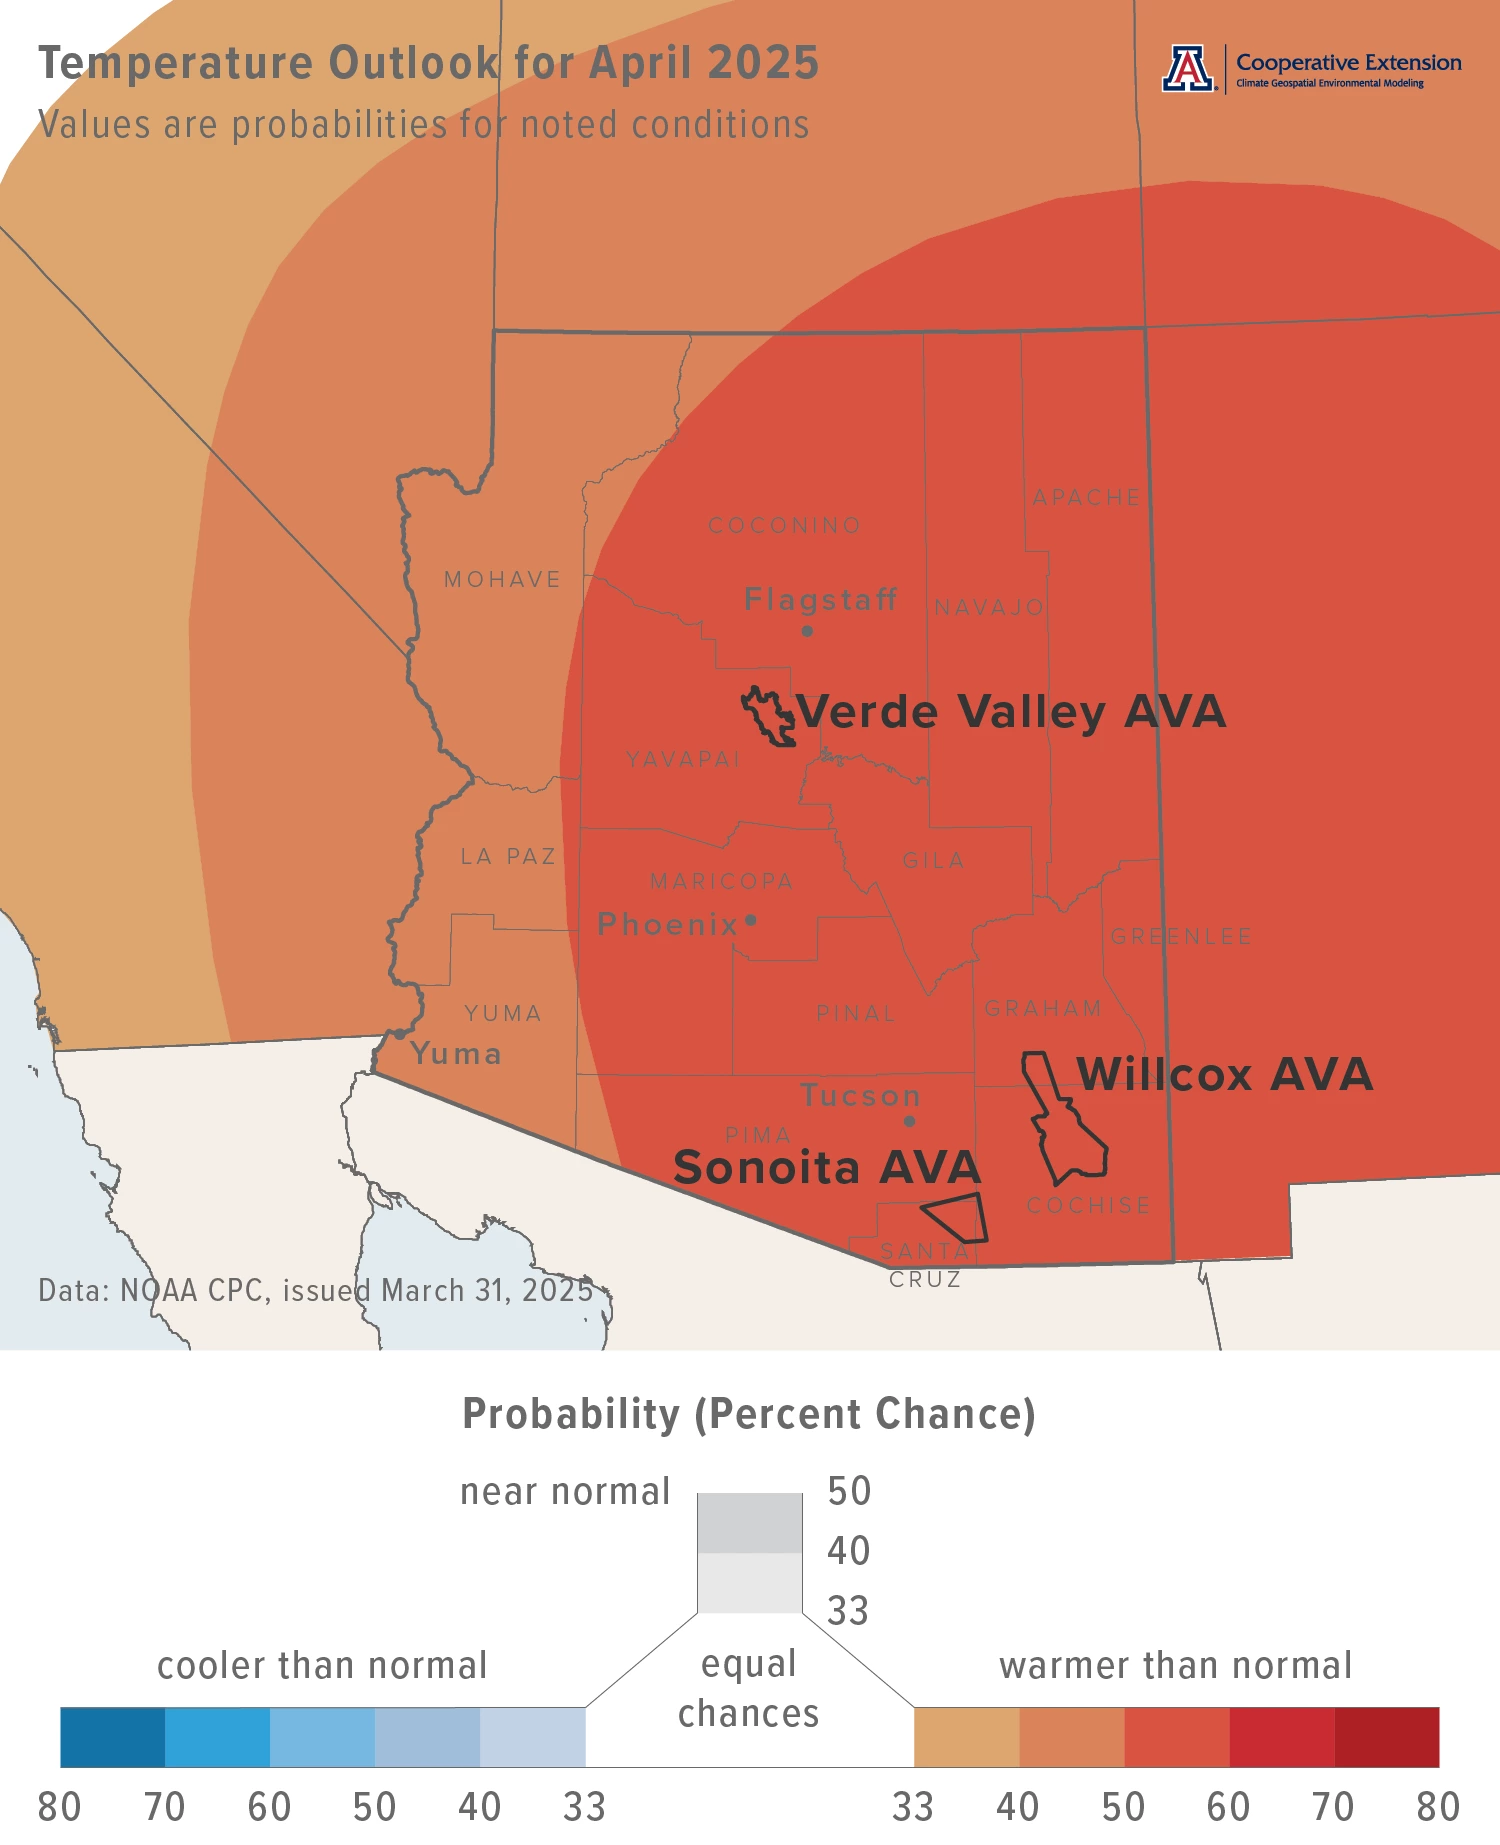
Temperatures over the course of this month have a moderate increase in chances for being above the 1991-2020 normal across the eastern three-quarters of Arizona (dark orange area on map). For the western one-quarter, there is a slight increase in chances for above-normal temperatures (orange area on map). Monthly average temperatures in April last year were 1 to 4 °F below normal for much of the southern half of Arizona, and near normal for much of the rest of the state.
Area-average maximum and minimum temperatures during April 2024 were 71.1 and 40.5 °F for the Sonoita AVA, 74.5 and 42.8 °F for the Verde Valley AVA, and 74.6 and 39.6 °F for the Willcox AVA. Respective April normals are 73.5 and 41.9 °F, 75.5 and 42.6 °F, and 76.7 and 42.0 °F.
Temperature in April last year ranged between 87.3 and 28.0 °F at the AZMet Bonita station and between 87.8 and 29.7 °F at the AZMet Willcox Bench station.
Jeremy Weiss
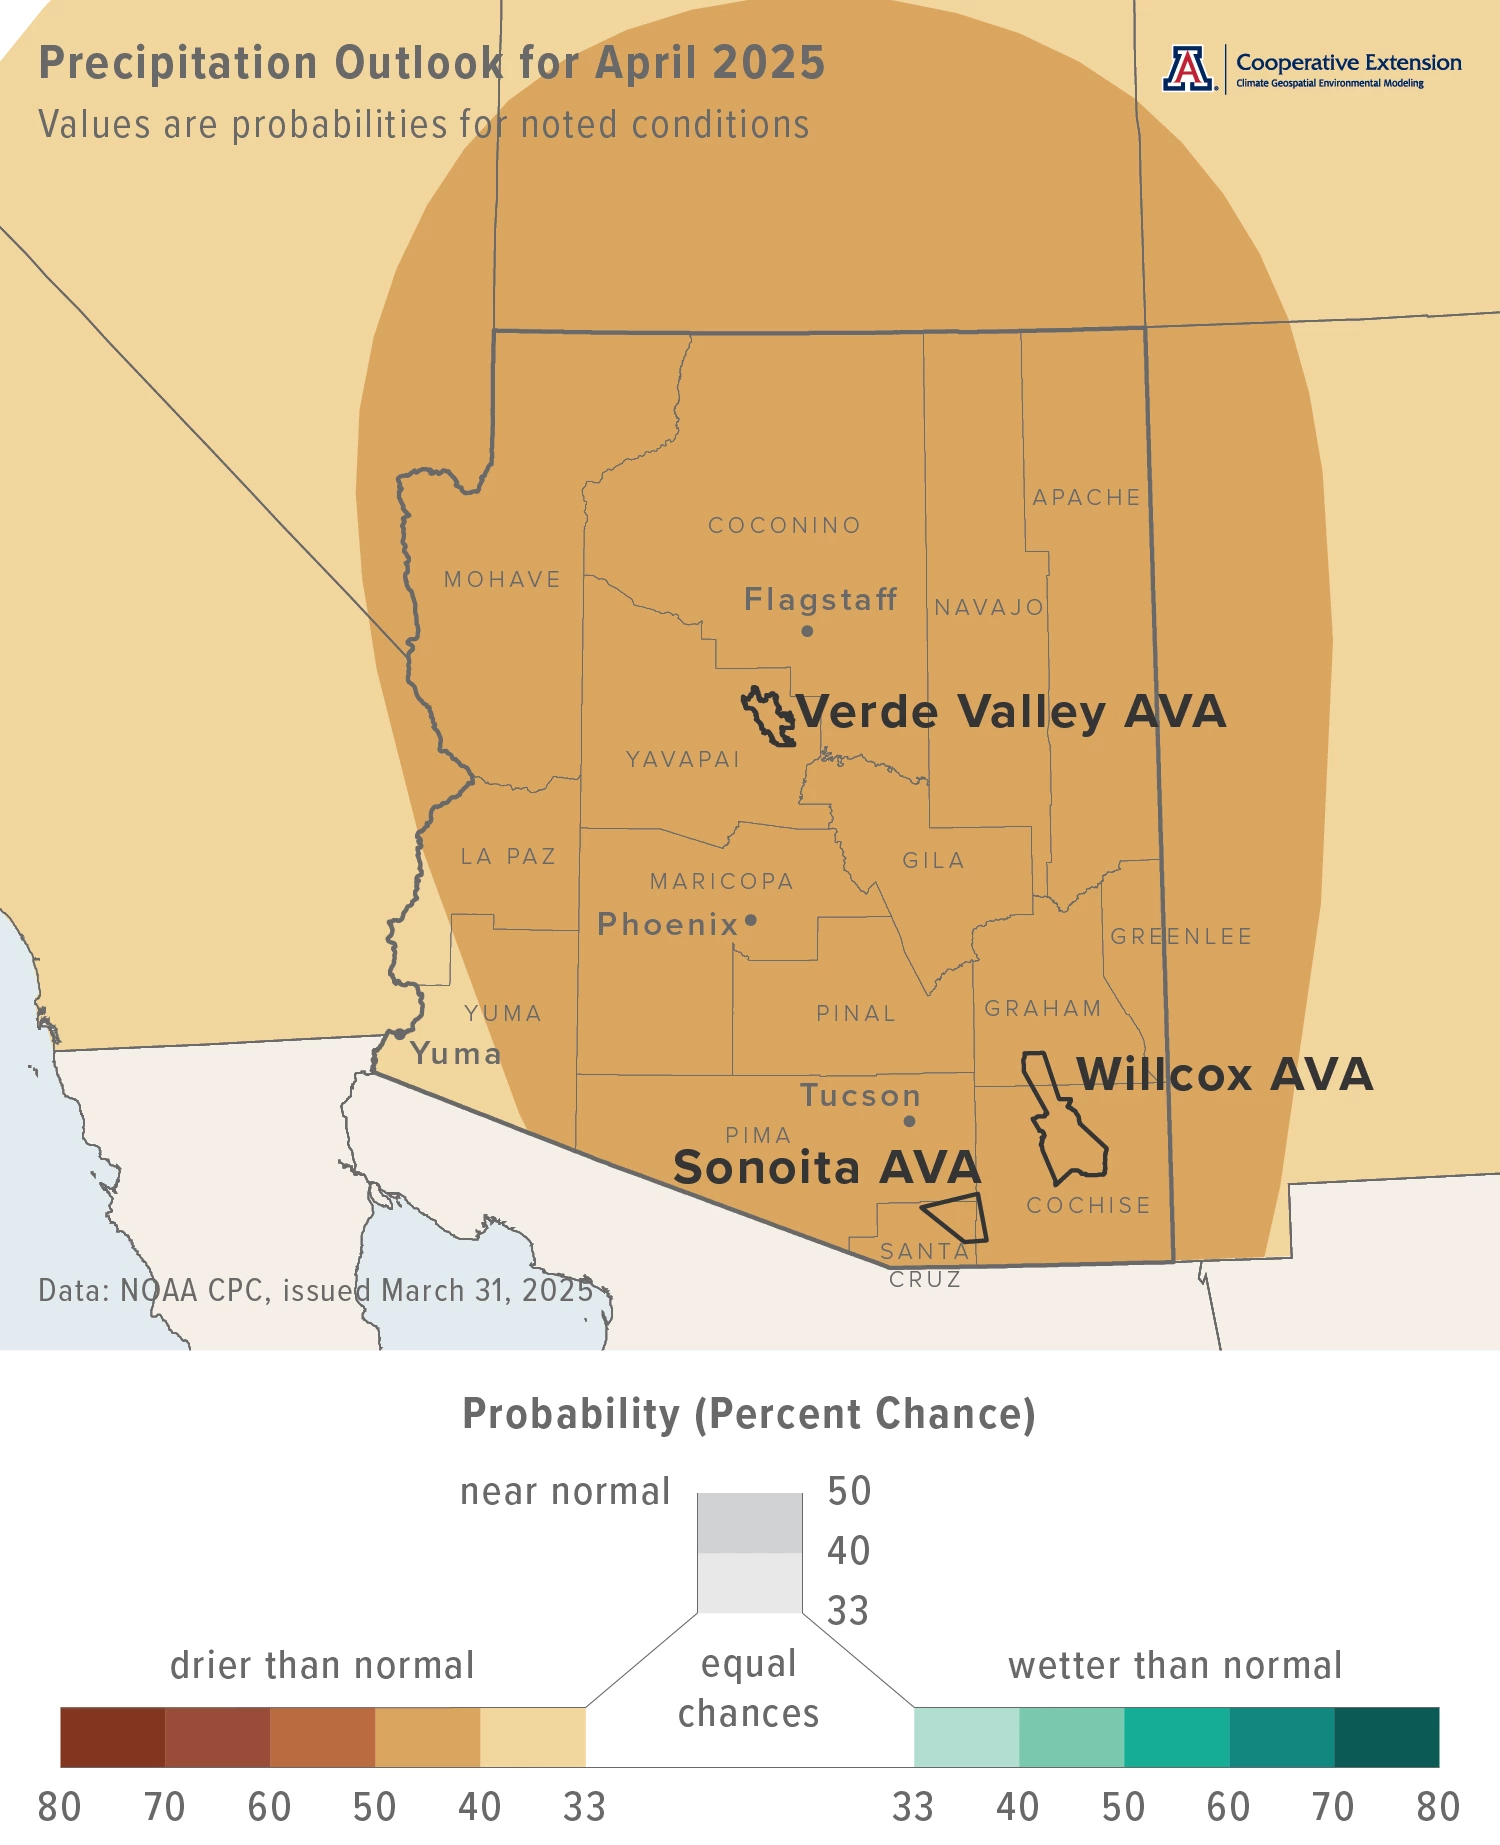
Precipitation totals for this month have a slight increase in chances for being below normal across the entire state (light tan and tan areas on map). Precipitation during April 2024 was more than 200 % of normal for much of the southern half of Arizona. These areas of above-normal amounts transitioned to near-normal ones in much of the northern half.
Area-average precipitation totals in April 2024 were 0.75 inches for the Sonoita AVA, 0.58 inches for the Verde Valley AVA, and 0.70 inches for the Willcox AVA. Respective April normals are 0.38, 0.55, and 0.25 inches.
Total precipitation in April last year was 0.18 and 0.42 inches at the AZMet Bonita and Willcox Bench stations, respectively.
To stay informed of long-range temperature and precipitation possibilities beyond the coverage of a standard weather forecast, check in, too, with the six-to-ten-day outlook and eight-to-fourteen-day outlook issued daily by NOAA’s Climate Prediction Center.
Jeremy Weiss
Vine Dormancy and the Start of the Growing Season
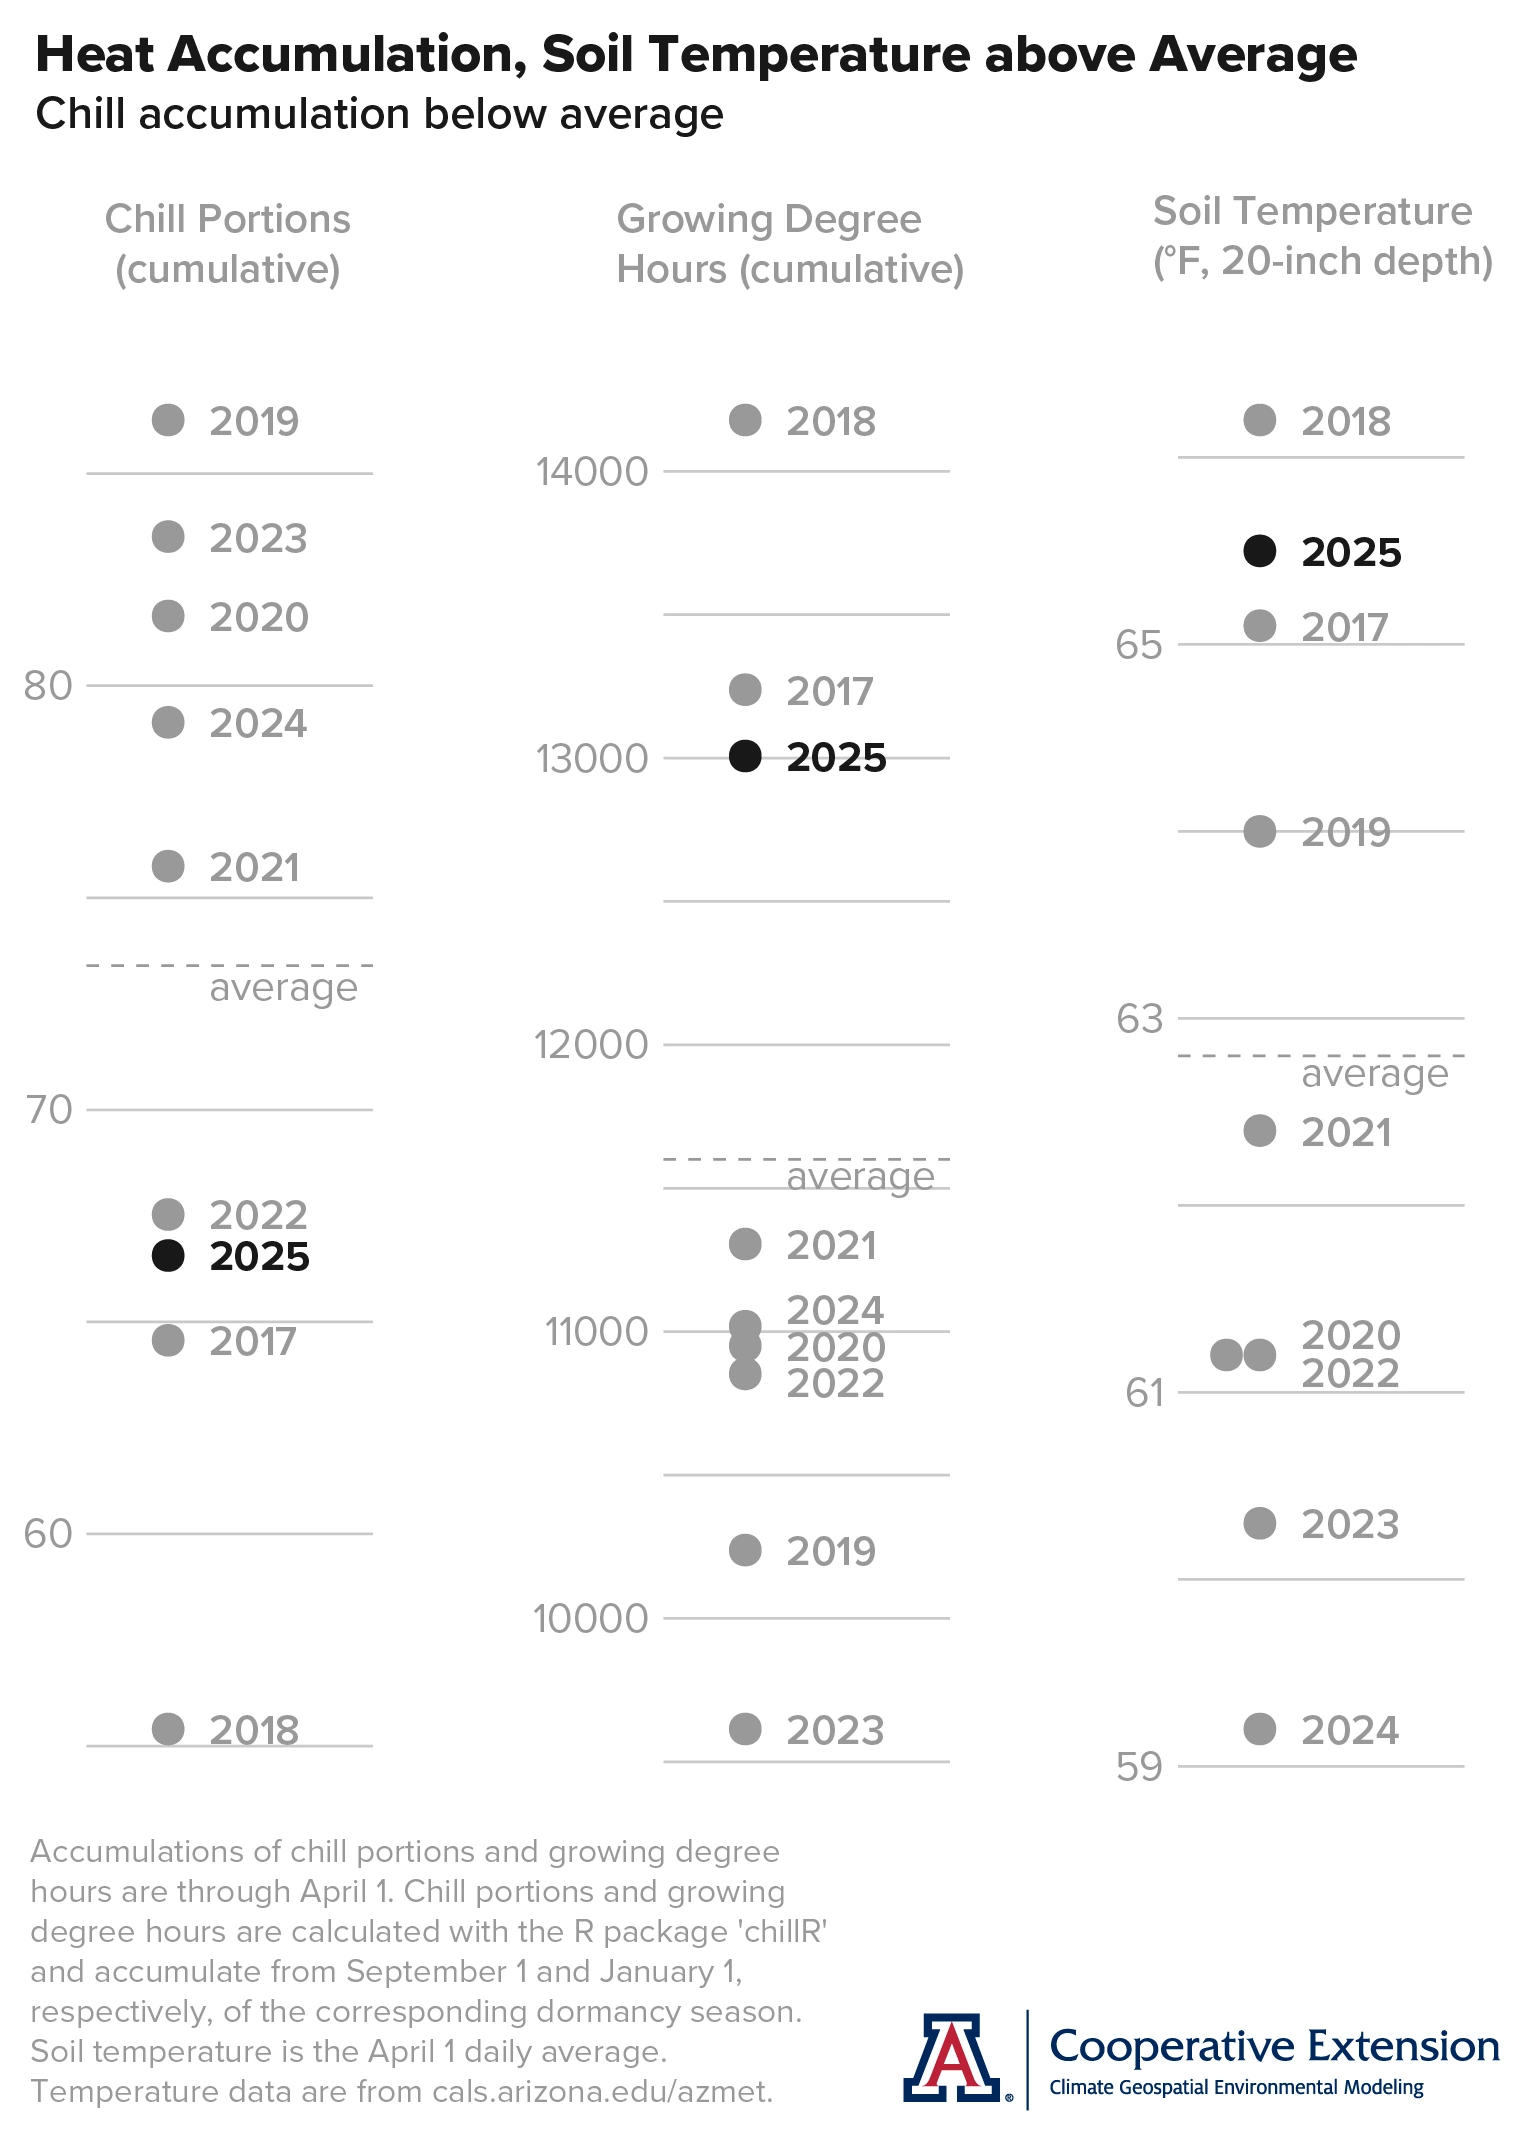
With below-to-near-normal temperatures last month in the south-central part of the Willcox AVA, chill accumulation between this year and that of 2017, 2018, and 2022 remained similar, as they were at the start of March (black and gray dots, respectively, on left graph). Values for all these years are below average (dashed horizontal gray line). Similarities of heat accumulation between 2025 and that of 2017 and 2018 also remained since the start of last month (black and gray dots, respectively, on middle graph). Values for these three years are above average. In the context of past ‘analog’ years and phenology data from Buhl Memorial Vineyard near the AZMet Willcox Bench station, current chill and heat accumulation suggests an early-to-near-average start to this growing season.
As soil temperature sometimes is part of the discussion about the start of the growing season, we show those data, as well. The daily average on April 1 this year is above average (black dot and gray dotted line, respectively, on right graph), and like that in 2017 and 2018.
Jeremy Weiss
Conditions for Bud Break at Buhl Memorial Vineyard
By coupling phenology data from Buhl Memorial Vineyard with chill and heat accumulation based on temperature data from the nearby AZMet Willcox Bench station in the south-central part of the Willcox AVA, we can begin to define empirically how much chill and heat accumulation is tied to bud break for individual varieties.
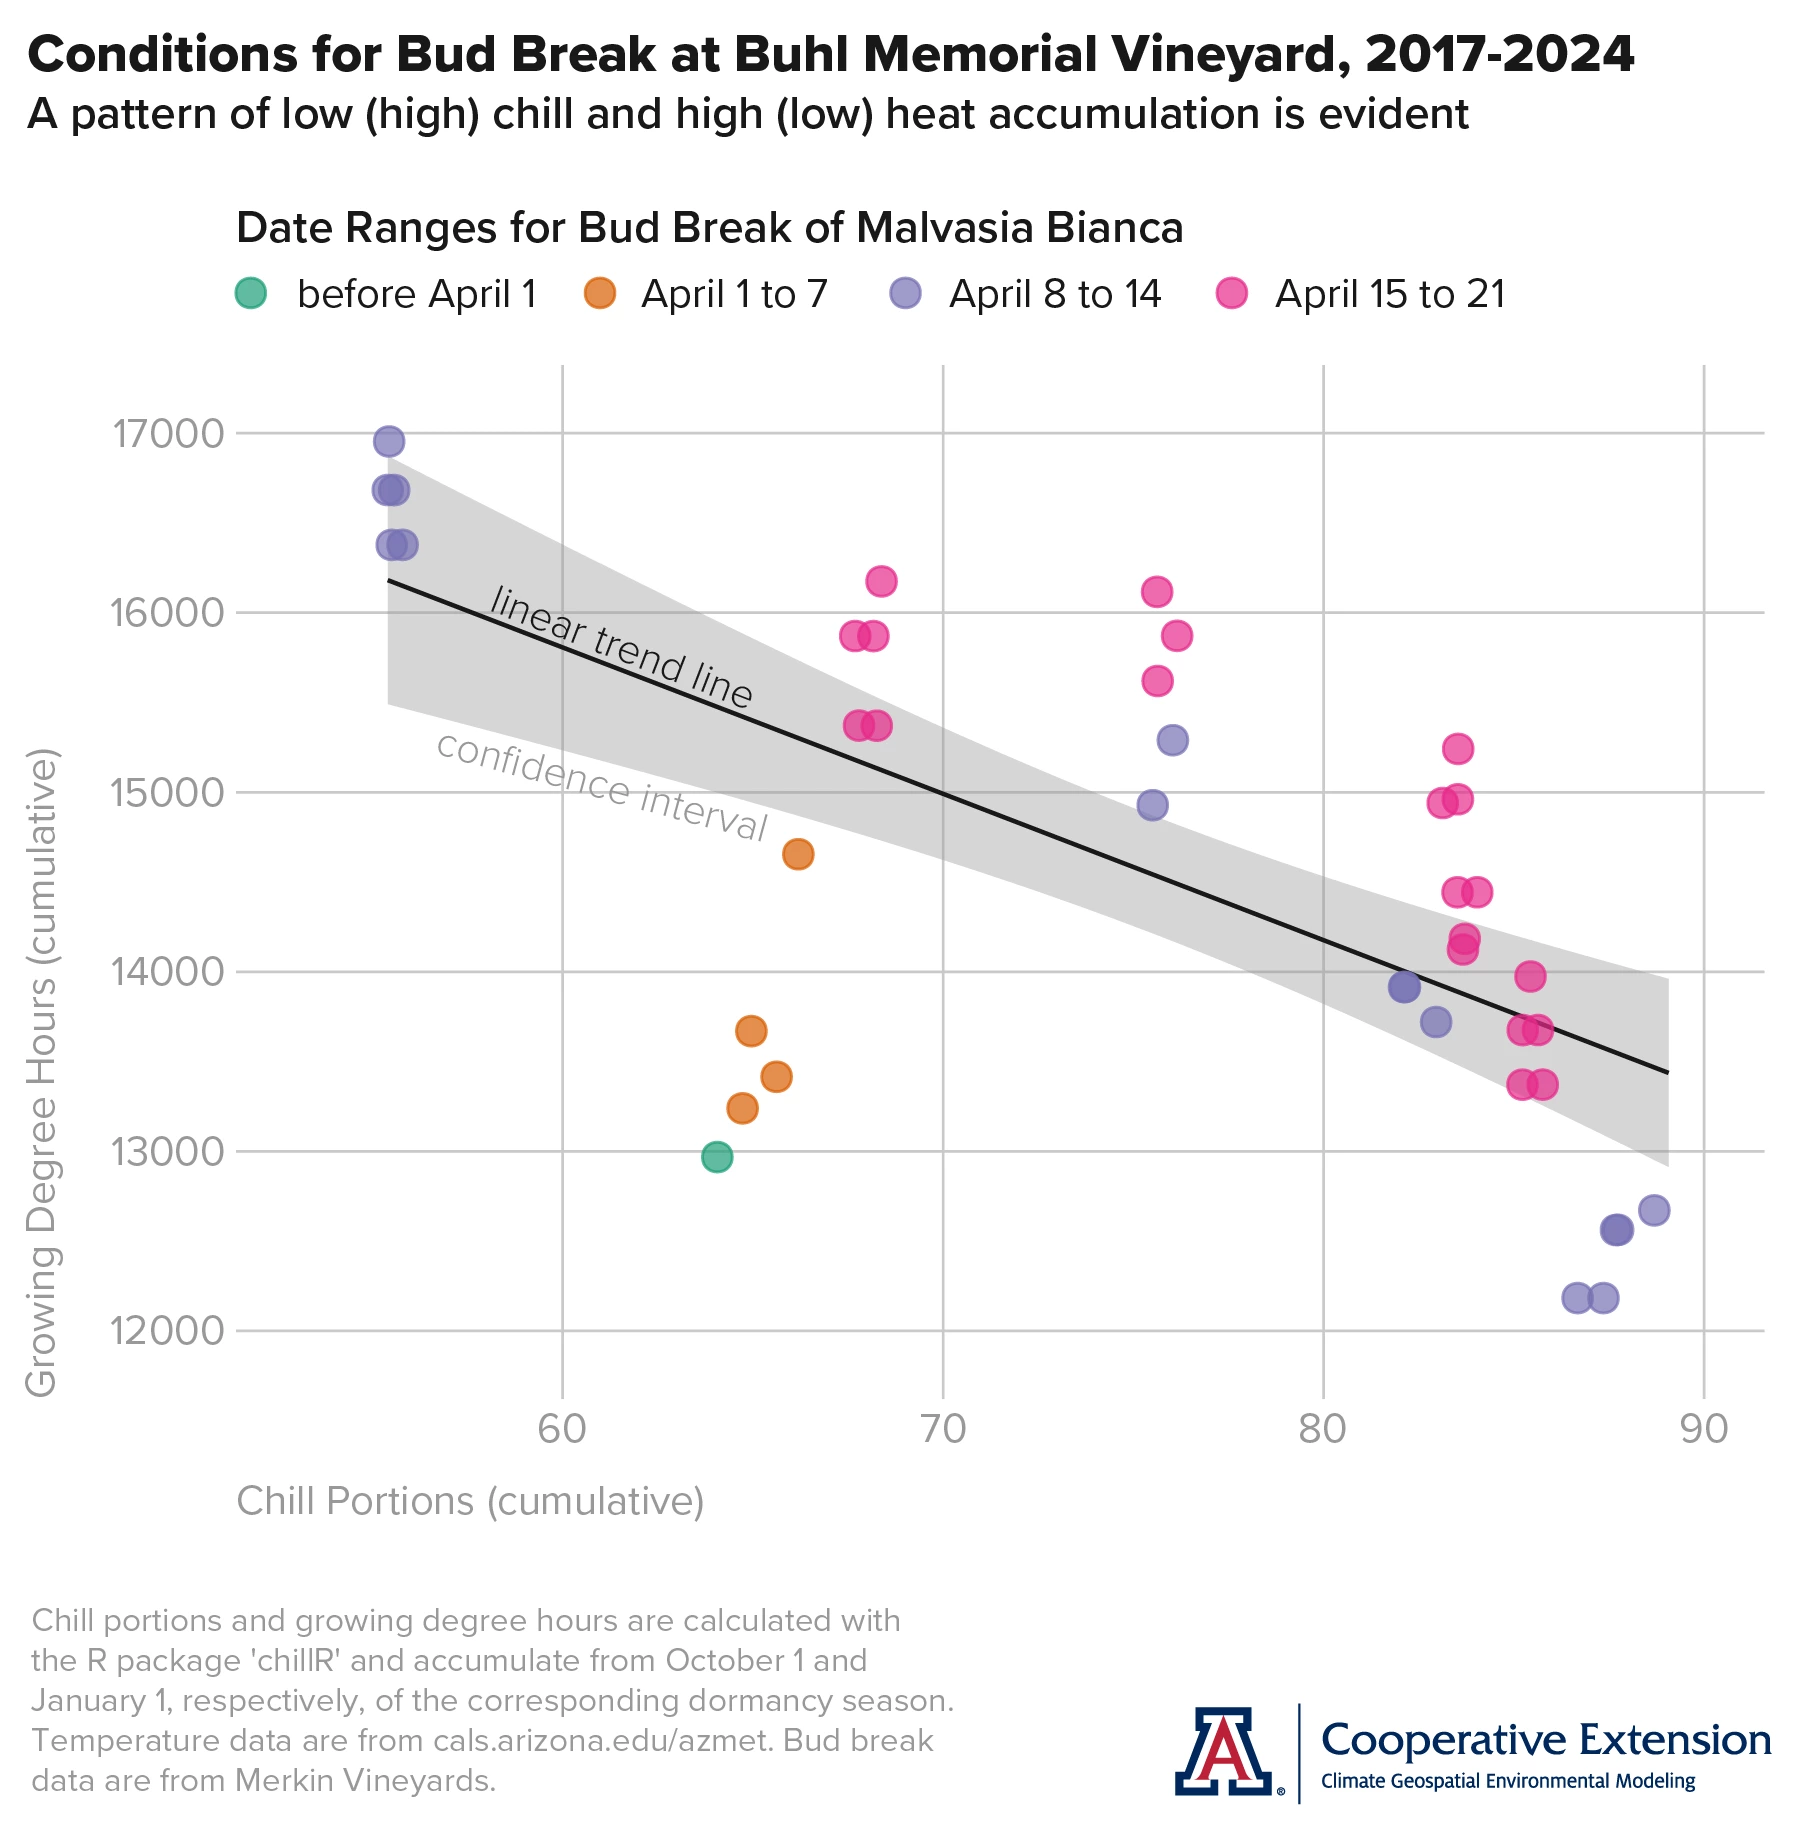
In this example, chill accumulation is along the horizontal axis of the graph, heat accumulation is along the vertical axis, and bud break dates for Malvasia Bianca are represented by the dots, placed on the graph by coincident chill and heat accumulation and color-coded by weekly date ranges. We use this variety here, as it had the largest sample in the phenology data set: 45 total observations across five different blocks over nine growing seasons, from 2017 through 2024.
A pattern of low (high) chill and high (low) heat accumulation on bud break dates for Malvasia Bianca is evident (downward linear trend line on graph). An explanation for this pattern may be deacclimation kinetics and its relation to how chill accumulation, dormancy state, and temperature affect the loss of cold hardiness and timing of bud break in grape vines. Consideration of both chill and heat accumulation appears necessary to explain bud break dates at this vineyard.
Consideration in this case of just heat accumulation to explain bud break dates, which is typical in viticulture, appears less optimal. On bud break dates for Malvasia Bianca during just the second week of April (purple dots on graph), cumulative growing degree hours are almost as low as 12,000 and as high as 17,000, a range of almost 5,000. The daily average of growing degree hours in April at the AZMet Willcox Bench station is 265. That range thus equates to about 19 days.
Also is evident on the graph is that apart from bud break dates in 2017 (aqua and orange dots on graph), the start of the growing season for Malvasia Bianca was during the second and third weeks of April (purple and pink dots on graph). In addition, one might suggest a non-linear relationship between chill and heat accumulation on bud break dates for Malvasia Bianca, one in which a trend line declines more rapidly when chill portions surpass 80. We’ll keep this in mind as more data come in and we continue these analyses.
Jeremy Weiss
Extra Notes
Given recent and current conditions, there is an above-normal potential for significant wildland fires across the central, east-central, and southeastern parts of Arizona in April. Otherwise across the state, the outlook from the National Interagency Fire Center shows potential as normal for the month.
Expectations are that the still-weakening La Niña event will transition to ENSO-neutral conditions in the coming month, with the latter having a 62 % chance of persisting through the July-through-September 2025 period.
For those of you in southeastern Arizona, including the Sonoita and Willcox AVAs, Cooperative Extension manages an email listserv in coordination with the Tucson forecast office of the National Weather Service to provide information in the days leading up to agriculturally important events, like spring freezes and high-wind days. Please contact us if you'd like to sign up.
And for those of you in north-central and northeastern Arizona, including the Verde Valley AVA, Cooperative Extension also now manages an email listserv in coordination with the Flagstaff forecast office of the National Weather Service to provide similar information for this part of the state. Please contact us if you'd like to sign up.
Undergraduate students in the College of Agriculture and Life Sciences at the University of Arizona are looking for internships with businesses and companies in the viticulture and winery industries. Please contact Danielle Buhrow, Senior Academic Advisor and Graduate Program Coordinator in the Department of Agricultural and Resource Economics, for more information.
Please feel free to give us feedback on this issue of the Climate Viticulture Newsletter, suggestions on what to include more or less often, and ideas for new topics.
Did someone forward you this newsletter? Please contact us to subscribe.
Have a wonderful April!
With current and past support from: