
< Back to Climate Viticulture Newsletter
Hello, everyone!
This is the July 2025 issue of the Climate Viticulture Newsletter – a quick look at some timely climate topics relevant to wine grape growing in Arizona.
IN THIS ISSUE
- A Recap of June Temperature and Precipitation
- The Outlook for July Temperature and Precipitation
- Heat Accumulation during the Growing Season
- Timing of Flowering at Buhl Memorial Vineyard
- Extra Notes
A Recap of June Temperature and Precipitation
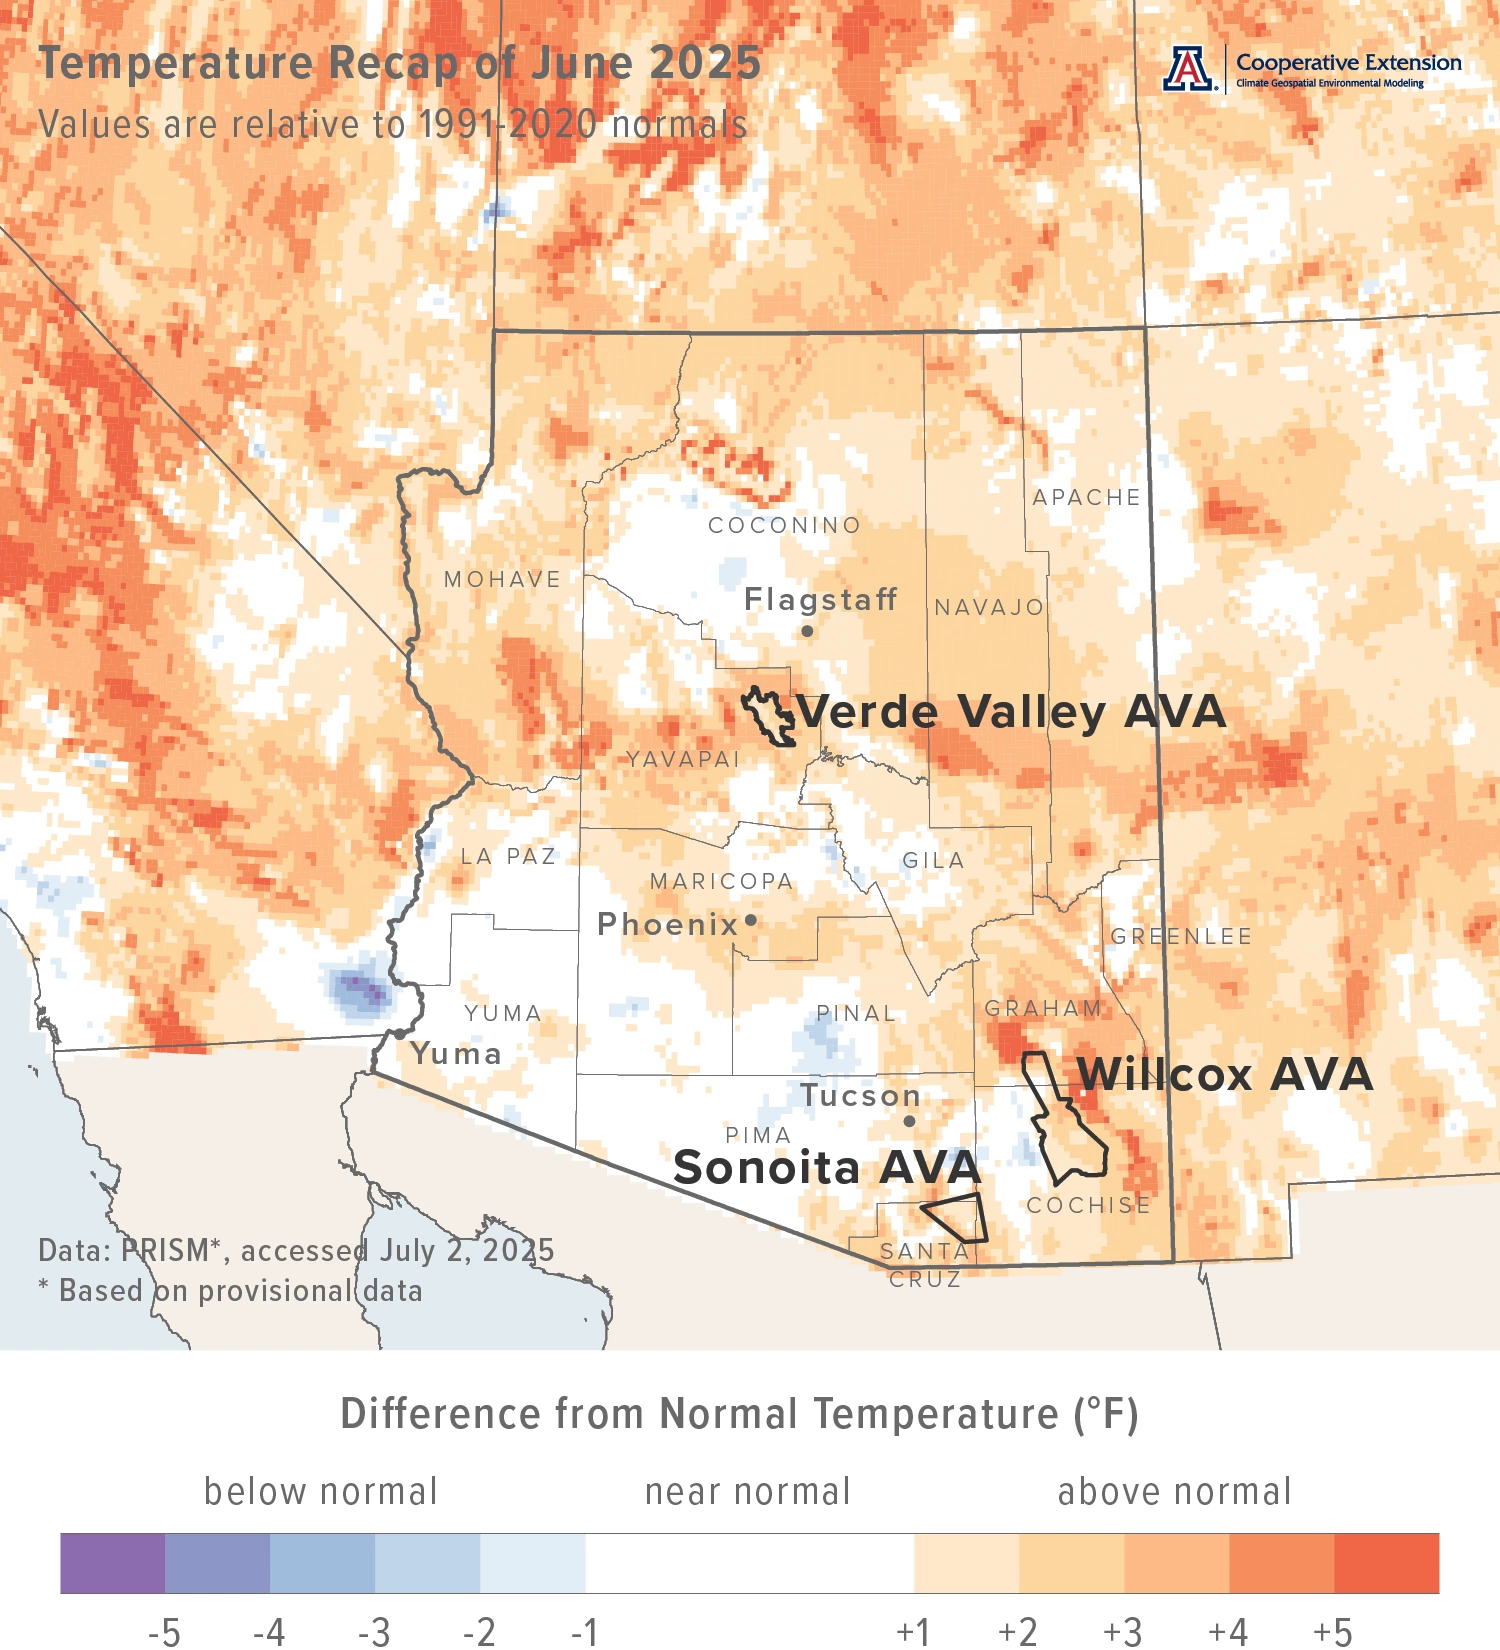
Monthly average temperatures were 1 to 4 °F above the 1991-2020 normal for much of the southeastern, central, and northern parts of Arizona (light orange, orange, and dark orange areas on map), including all three Arizona AVAs. Much of the rest of the state saw near-normal temperatures (white areas on map). For reference, monthly average temperatures in June last year were 2 to 4 °F above normal for much of the southeastern half of the state, and more than 4 °F for much of the northwestern half.
Area-average maximum and minimum temperatures during June 2025 were 91.6 and 62.5 °F for the Sonoita AVA, 97.2 and 61.7 °F for the Verde Valley AVA, and 95.5 and 62.2 °F for the Willcox AVA. Respective June normals are 90.6 and 59.0 °F, 95.4 and 58.4 °F, and 94.5 and 59.1 °F.
Temperature last month ranged between 104.2 and 54.0 °F at the AZMet Bonita station and between 105.1 and 56.3 °F at the AZMet Willcox Bench station.
Jeremy Weiss
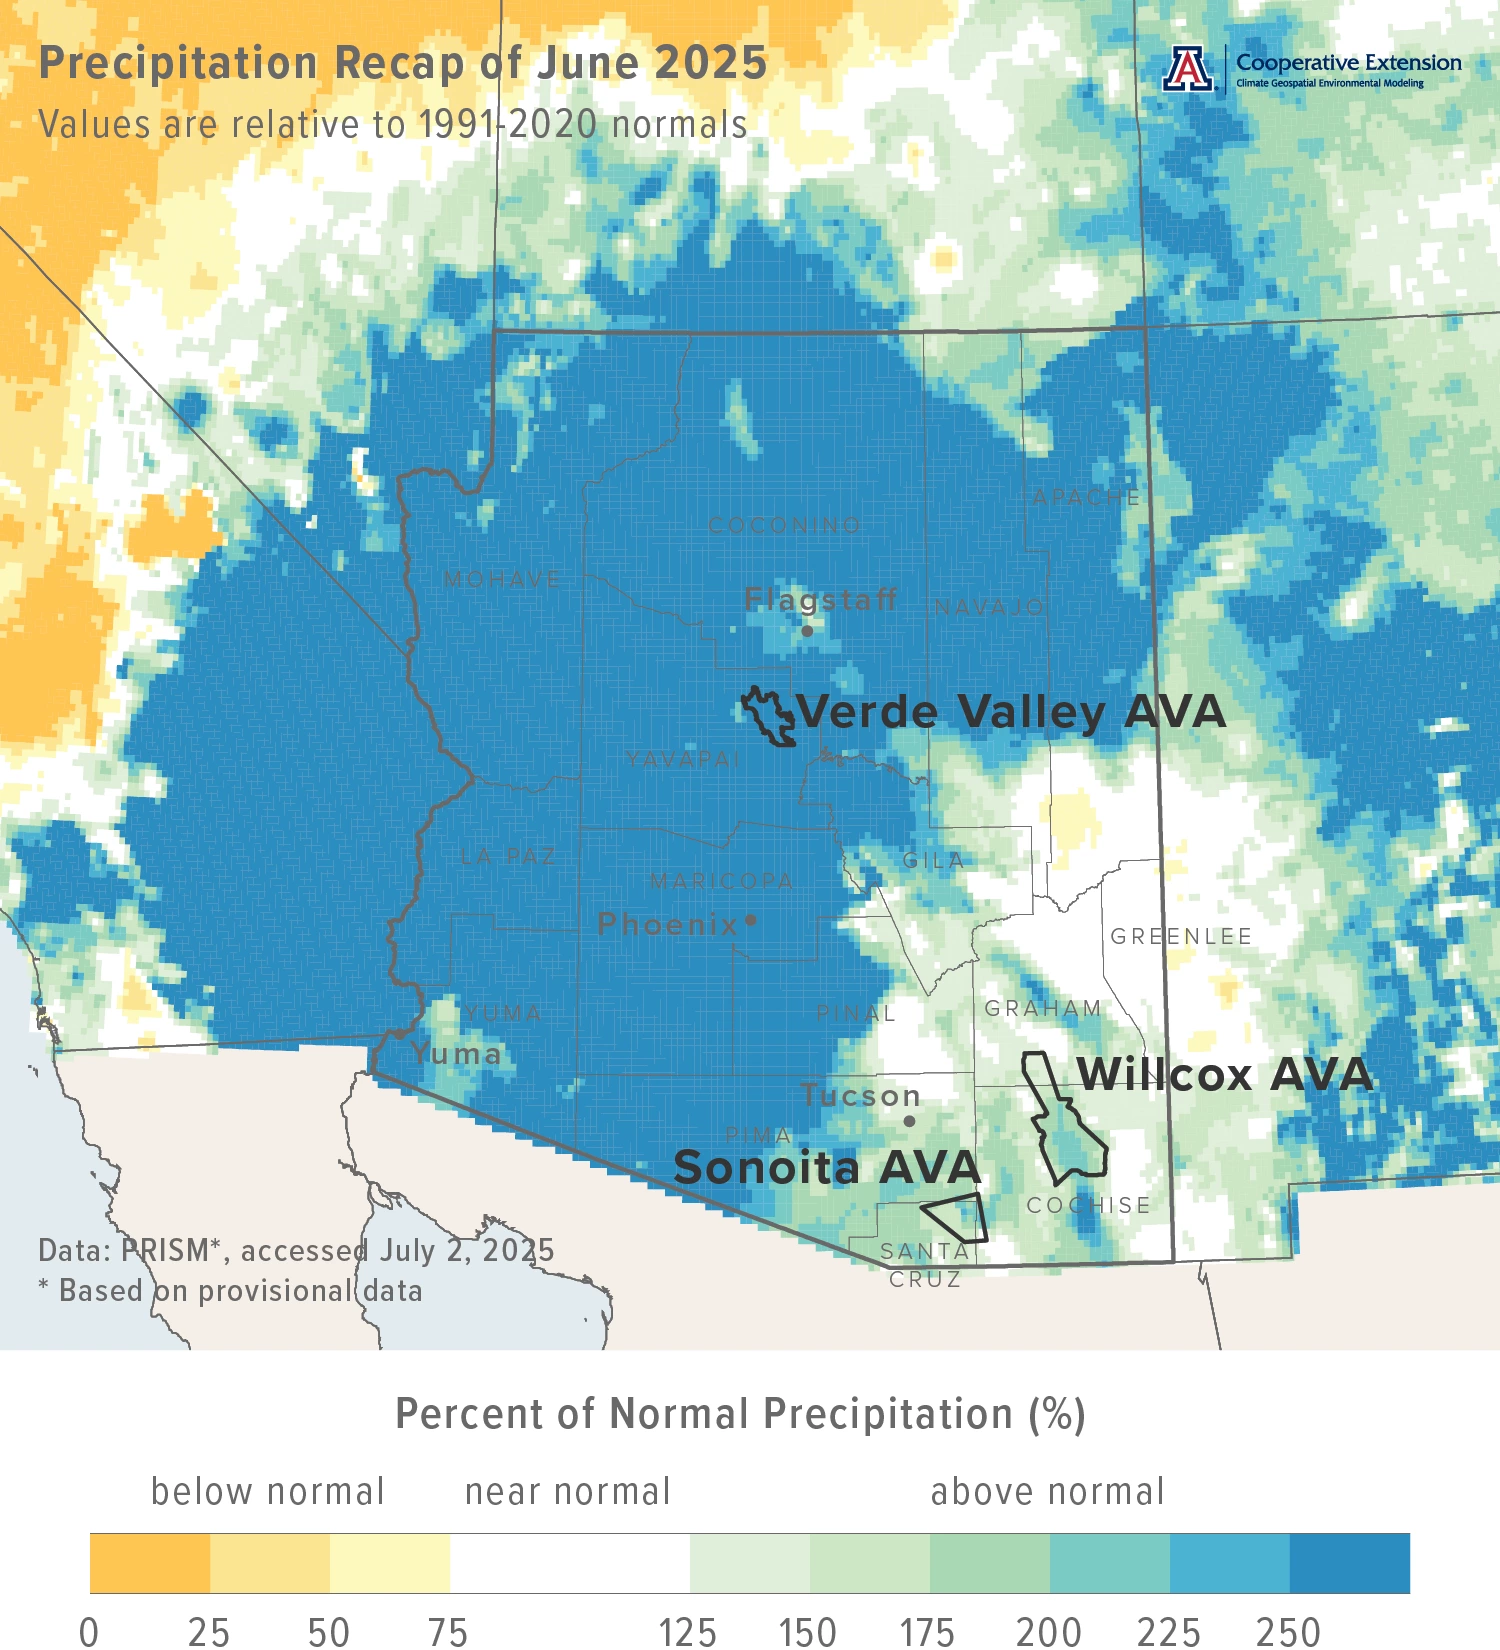
Largely due to rain at the start of June from a cut-off low pressure system that brought moisture from tropical depression Alvin into the state rather than an early start to the monsoon, monthly precipitation totals were more than 250 % of normal for many parts of the state (dark blue areas on map), including the Verde Valley AVA. Only a few locations in southeastern and east-central Arizona failed to post such impressive statistics in, granted, what is a typically dry month (white areas on map). With a relatively early start to the monsoon, precipitation during June 2024 was more than 200 % of normal for many parts of the state.
Area-average total precipitation in June 2025 was 0.92 inches for the Sonoita AVA, 1.01 inches for the Verde Valley AVA, and 0.73 inches for the Willcox AVA. Respective June normals are 0.55, 0.18, and 0.42 inches.
Total precipitation last month was 0.64 and 0.72 inches at the AZMet Bonita and Willcox Bench stations, respectively.
Dig further into daily weather summaries for the AZMet Bonita and Willcox Bench stations in the Willcox AVA
View seasonal summaries of monsoon rainfall through regional maps and weather station statistics
Learn more about PRISM climate data
Jeremy Weiss
The Outlook for July Temperature and Precipitation
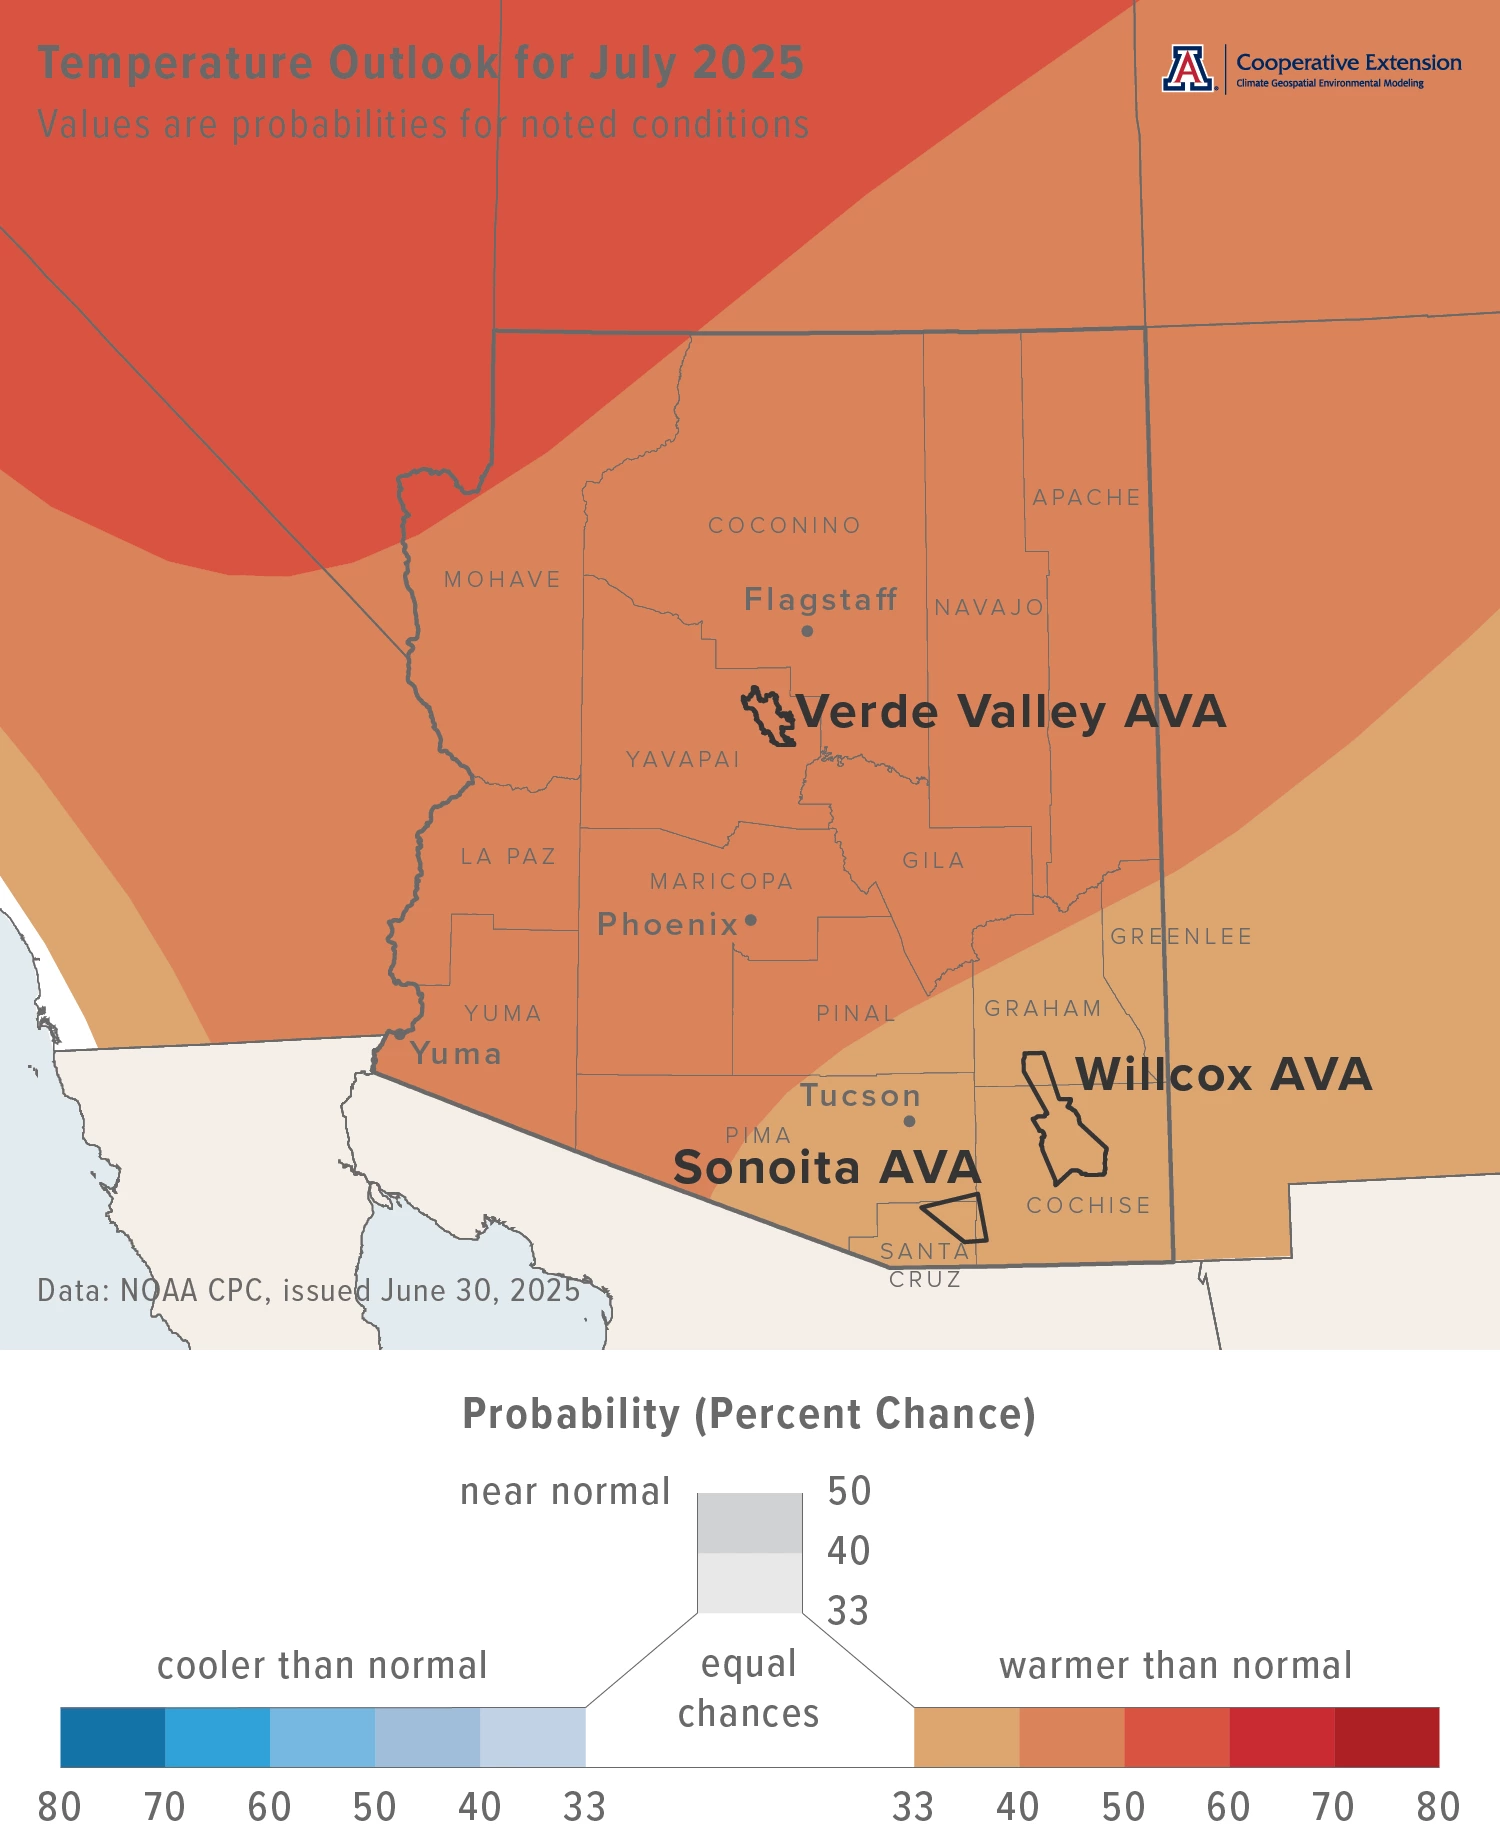
Temperatures over the course of this month have a slight increase in chances for being above the 1991-2020 normal across almost all of Arizona (light orange and orange areas on map), with the only exception being the extreme northwestern part of the state, where there is a moderate increase in chances for above-normal temperatures (dark orange area on map). Monthly average temperatures in July last year were 1 to 4 °F above normal for much of the southeastern, northeastern, and north-central parts of the state. Much of the rest of Arizona measured record-level temperatures of more than 4 °F above normal.
Area-average maximum and minimum temperatures during July 2024 were 92.3 and 65.0 °F for the Sonoita AVA, 103.0 and 68.5 °F for the Verde Valley AVA, and 96.5 and 66.1 °F for the Willcox AVA. Respective July normals are 88.5 and 62.8 °F, 98.1 and 66.0 °F, and 93.6 and 64.9 °F.
Temperature in July last year ranged between 103.6 and 61.3 °F at the AZMet Bonita station and between 104.5 and 60.1 °F at the AZMet Willcox Bench station.
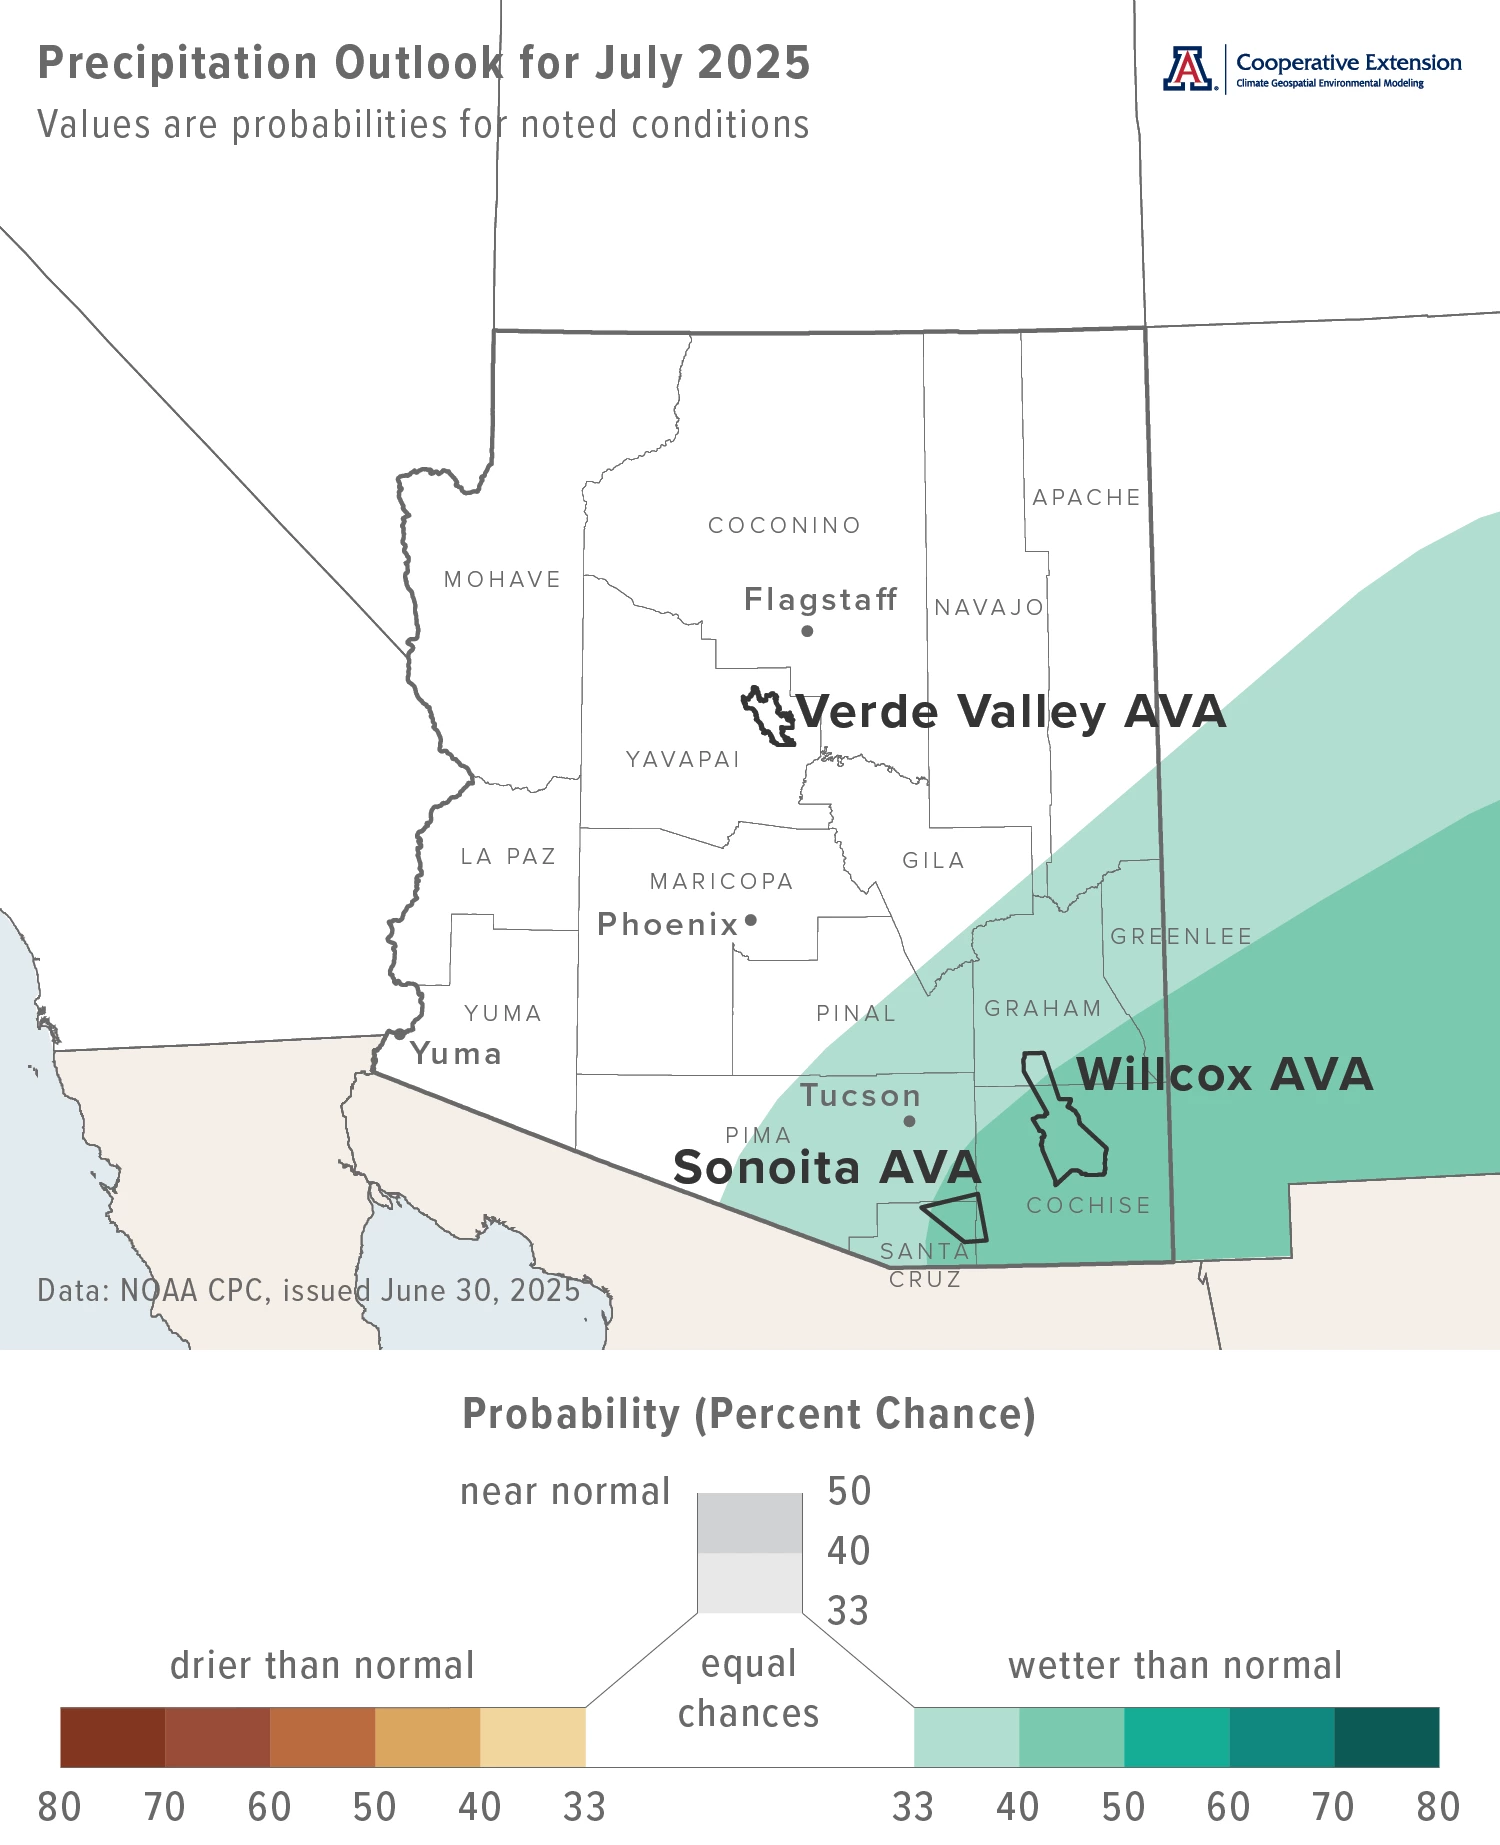
With a robust monsoon pattern anticipated during the first half of July, precipitation totals for this month have a slight increase in chances for being above normal across the southeastern part of the state (light green and green areas on map), including the Sonoita and Willcox AVAs. For the rest of Arizona, there are equal chances for below-, near-, or above-normal totals (white area on map), including the Verde Valley AVA. Precipitation during July 2024 was near normal for much of the southeastern and north-central parts of Arizona. Much of the rest of the state recorded totals less than 75 % of normal.
Area-average precipitation totals in July 2024 were 3.65 inches for the Sonoita AVA, 1.85 inches for the Verde Valley AVA, and 2.33 inches for the Willcox AVA. Respective July normals are 4.06, 1.75, and 2.67 inches.
Total precipitation in July last year was 3.22 and 1.35 inches at the AZMet Bonita and Willcox Bench stations, respectively.
To stay informed of long-range temperature and precipitation possibilities beyond the coverage of a standard weather forecast, check in, too, with the six-to-ten-day outlook and eight-to-fourteen-day outlook issued daily by NOAA’s Climate Prediction Center.
Jeremy Weiss
Heat Accumulation during the Growing Season
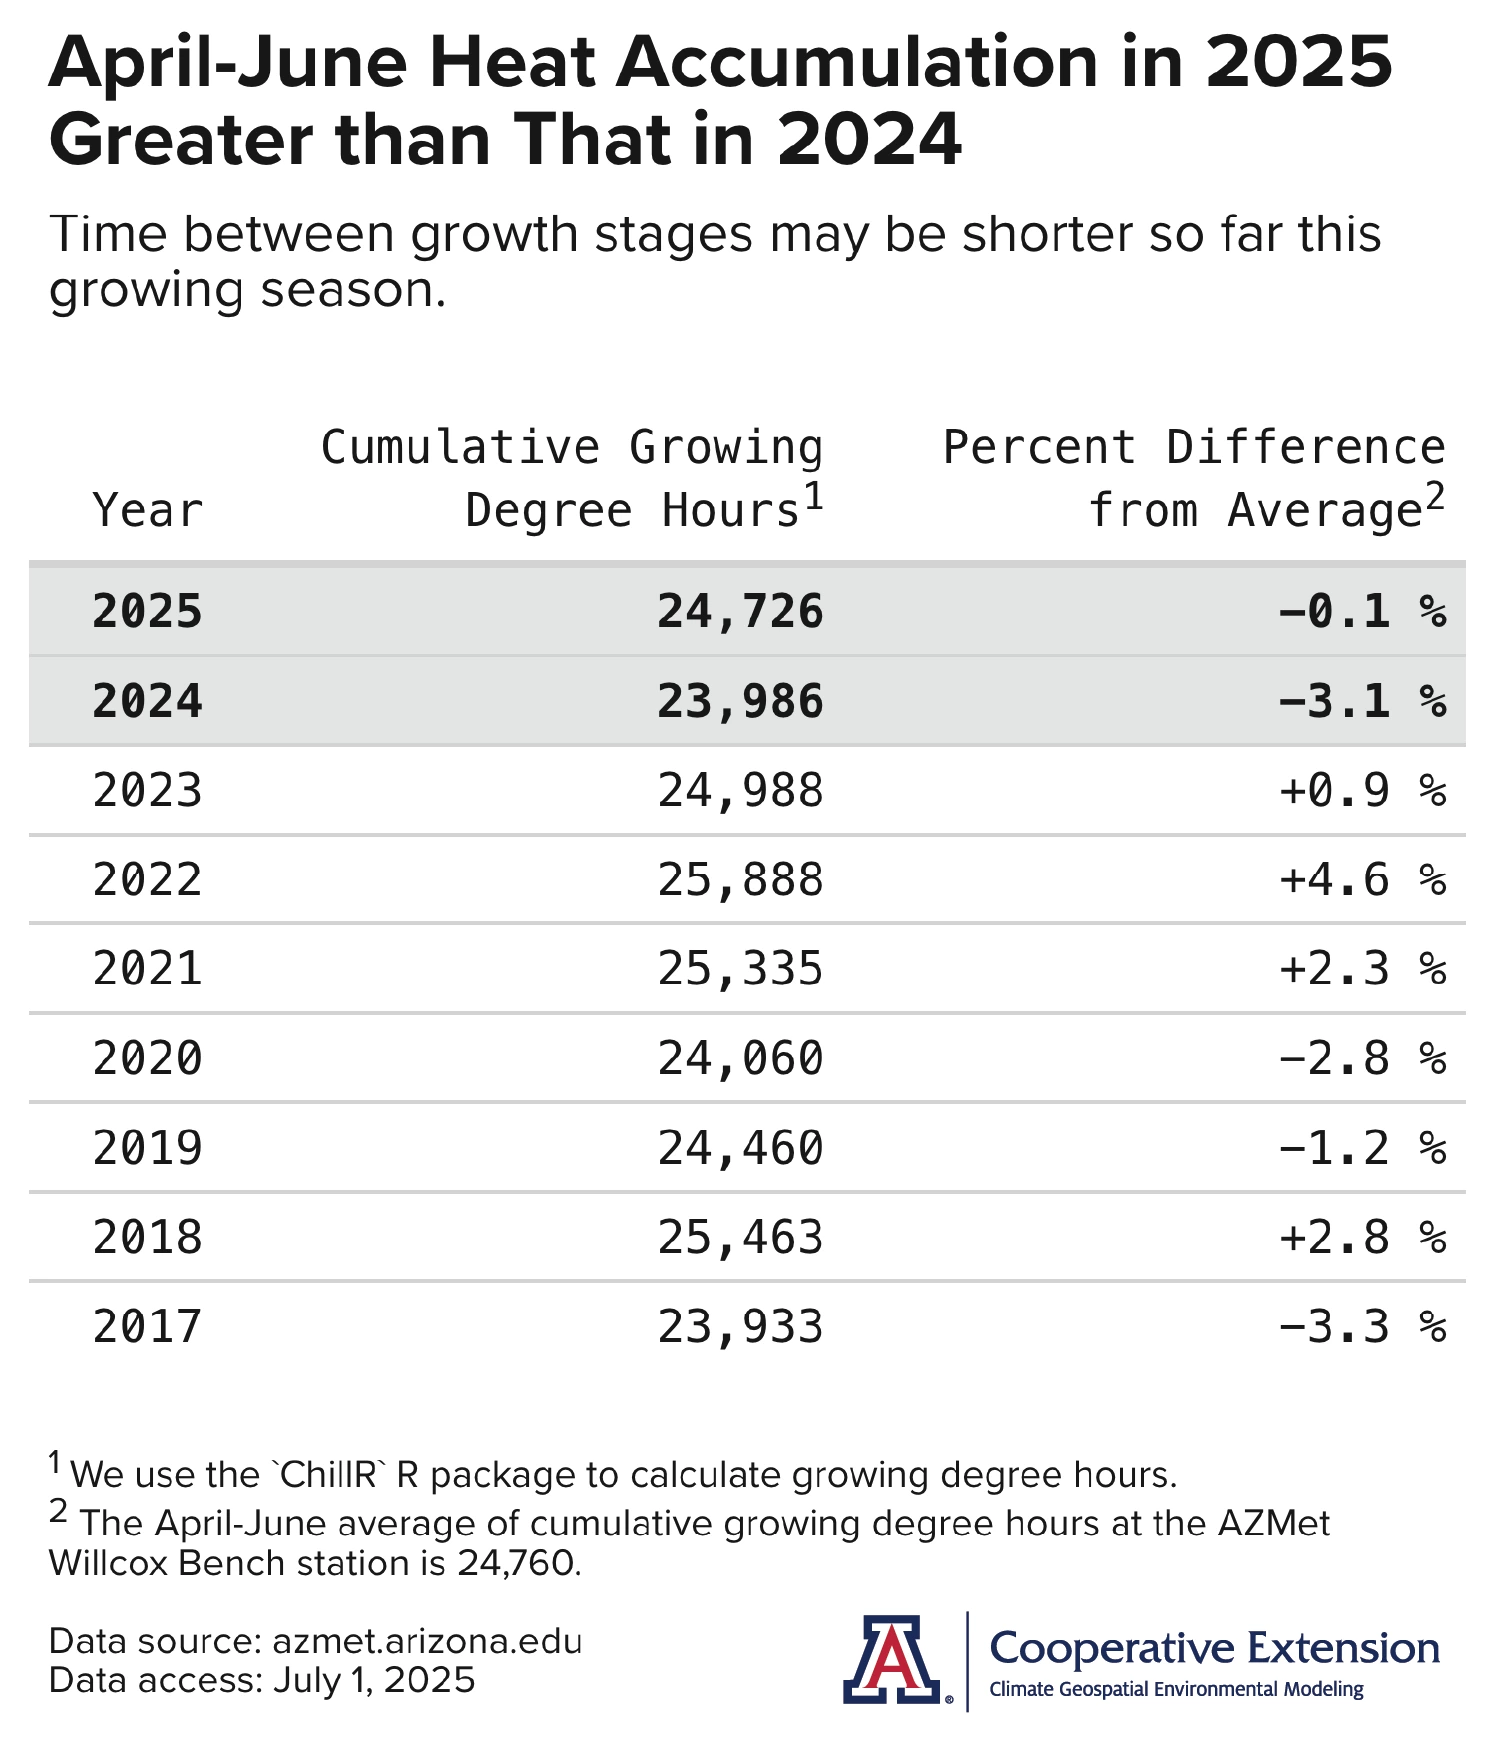
Heat accumulation from April through June this year at the AZMet Willcox Bench station in the south-central part of the Willcox AVA is greater than what it was at this time last year (top two rows of table). This suggests that the growth rate of vines may have been faster and the time between pre-veraison growth stages shorter so far this growing season than what they were in the previous one. Heat accumulation this year is near the station average, whereas that of last year is below average, as indicated by the percent value in the third table column.
Relative to last year, how much more advanced might vine growth stages be this year due to the additional heat accumulation? As the average daily accumulation of growing degree hours during the months of April, May, and June is approximately 270, and the difference in cumulative growing degrees hours between 2025 and 2024 is 740, the additional heat accumulation during these months in 2025 is worth about two to three days. Coupling this with bud break dates that mostly were earlier in 2025 than in 2024, growth stages might be about one week ahead, depending on variety.
Since station measurements began, the greatest amount of heat accumulation at this point in the growing season happened in 2022 while the least amount happened in 2017. Percent differences from average for these years range roughly between -3 and +5 % (that is, about 2,000 growing degree hours) and suggest that variability in heat accumulation during the months of April, May, and June translates to as much as a one-week difference in growth-stage timing.
Jeremy Weiss
Timing of Flowering at Buhl Memorial Vineyard
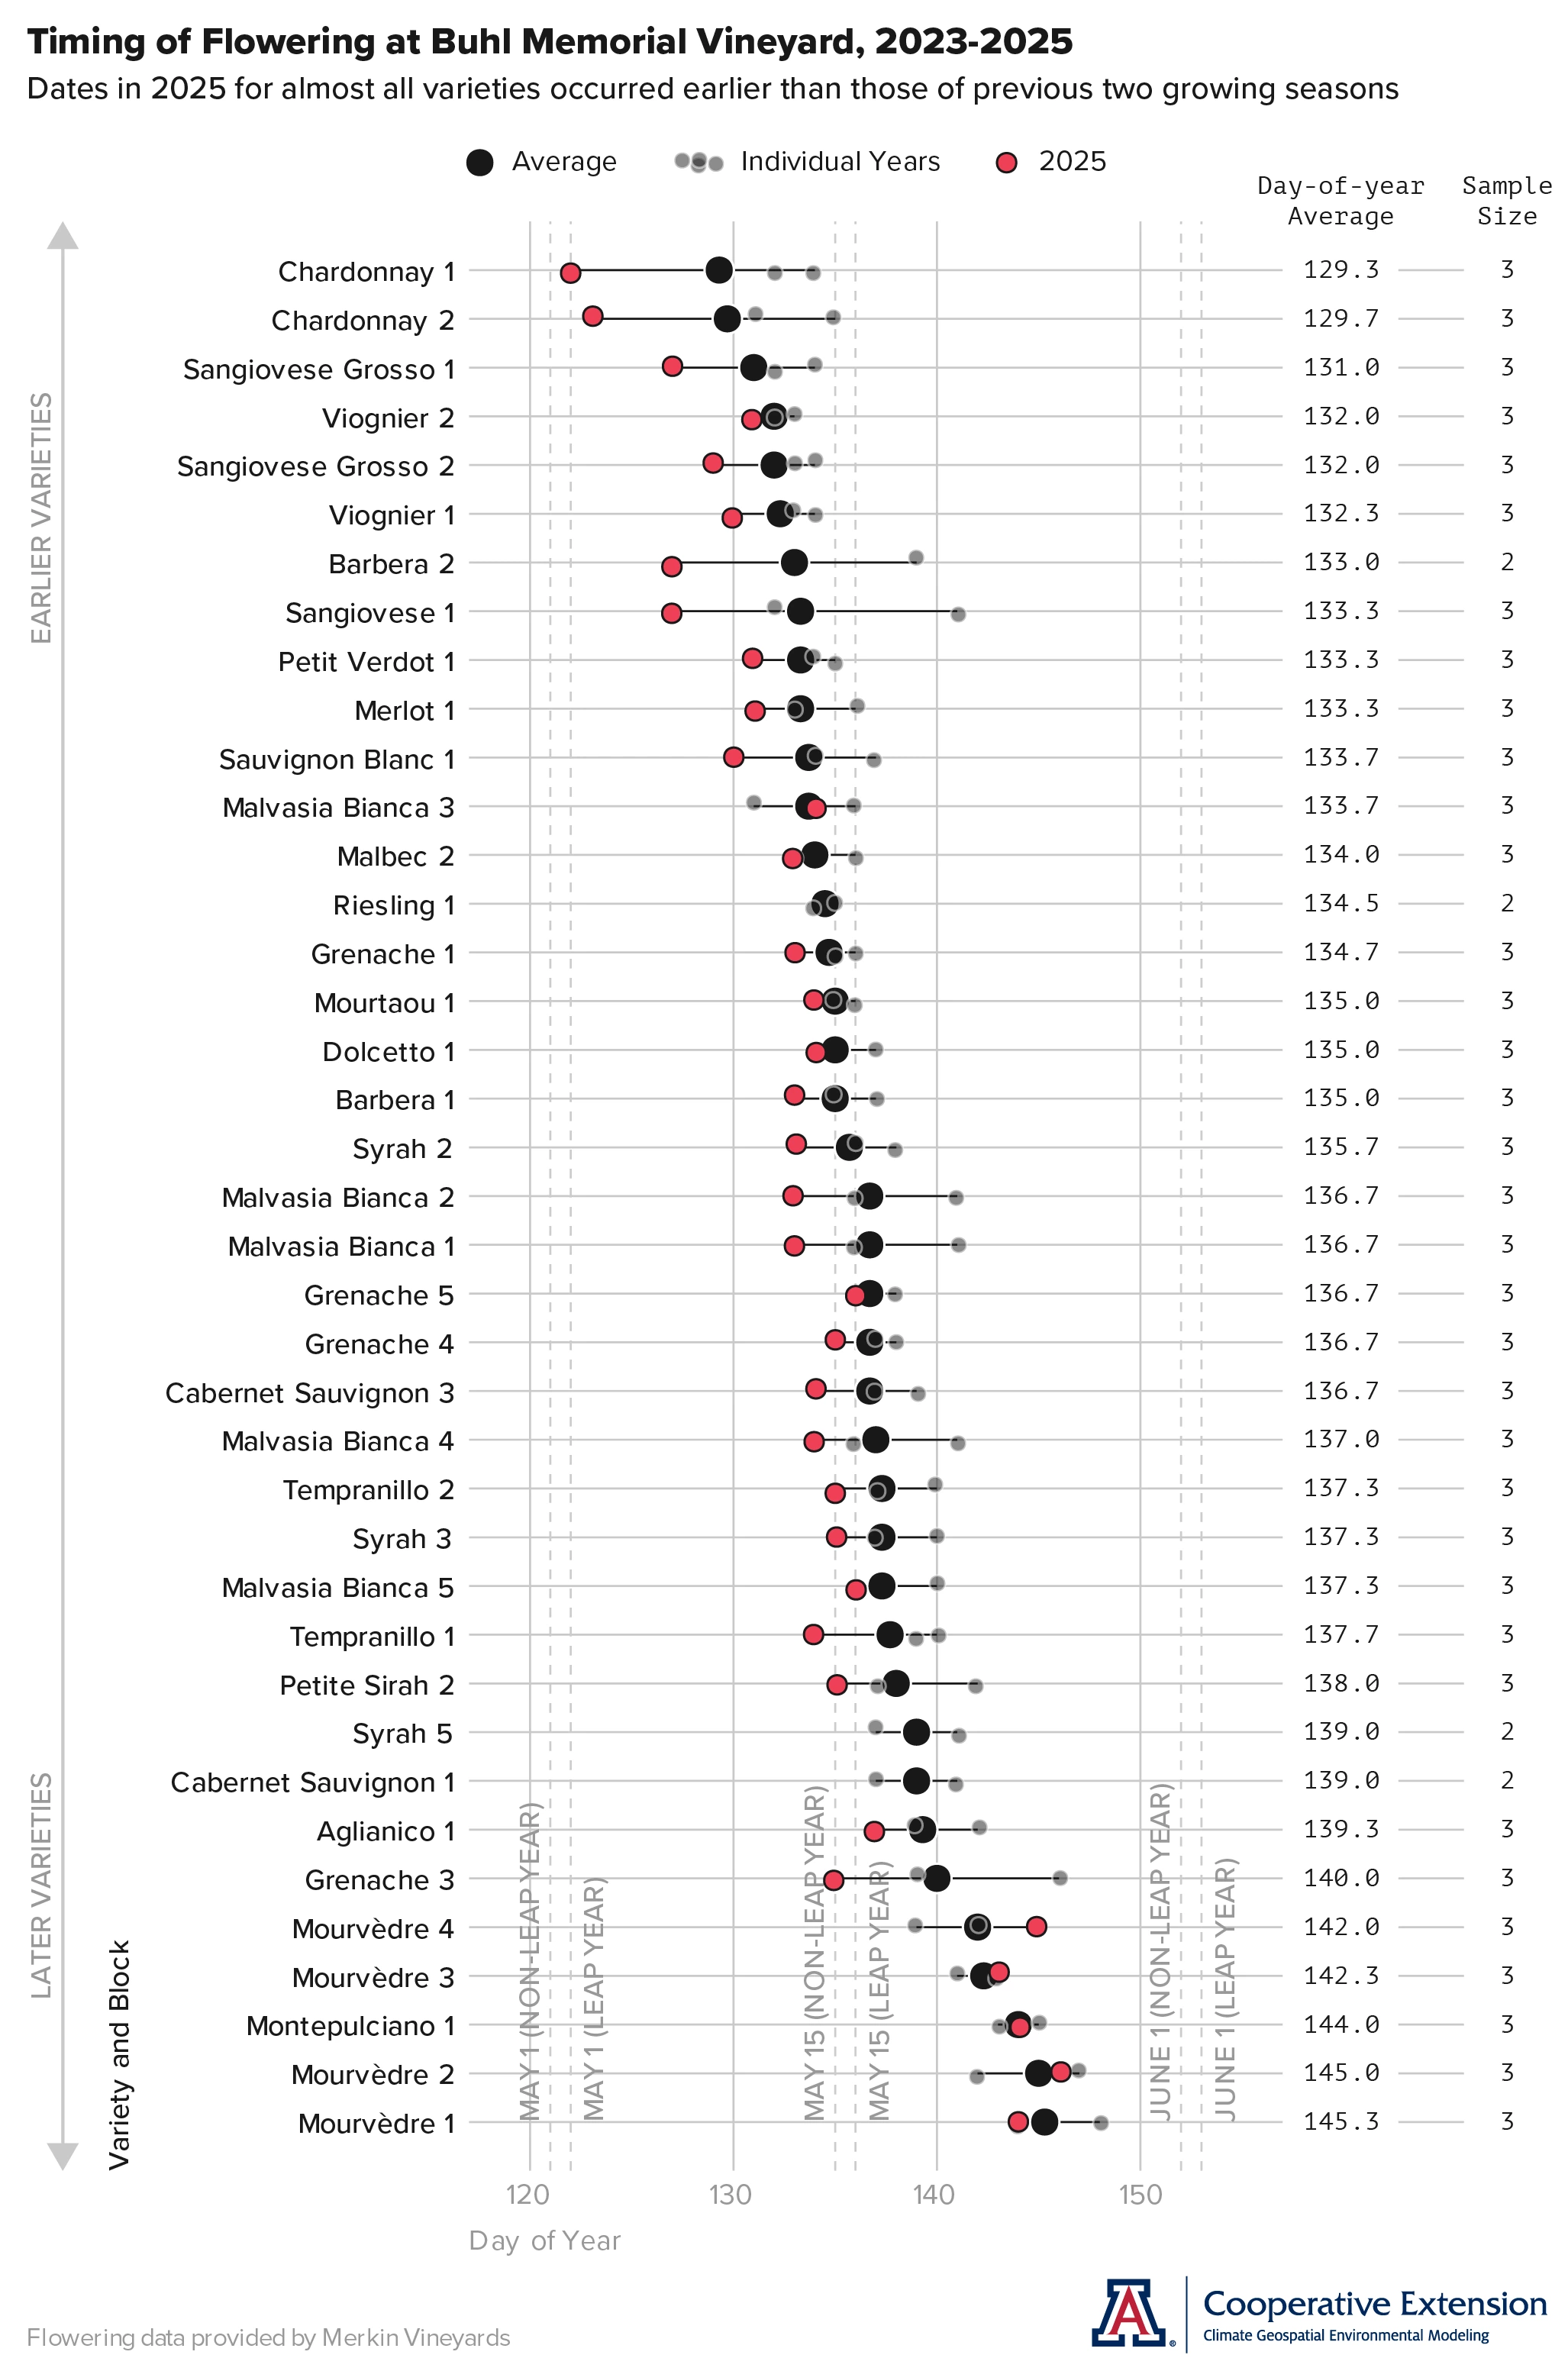
At this point of the 2025 growing season, it’s time to return to the initial phenology data set we’re analyzing for our current project about the effects of Arizona climate on the timing of wine grape growth stages. Dates for flowering in 2025 are in from Buhl Memorial Vineyard near the AZMet Willcox Bench station and in the south-central Willcox AVA, and we’ve put them and those from the previous two growing seasons into an infographic like the one we last showed in May.
Flowering dates in 2025 for almost all variety blocks occurred earlier than those from 2023 and 2024 (red and gray data points, respectively), an unsurprising result given relatively early bud break dates, near-normal temperatures in April and May, and warmer-than-normal temperatures in June this year. Despite just these few years of data, some rough patterns appear. Flowering mostly occurs during the second and third weeks of May, with a few data points appearing during the first and last weeks of the month. Based on average dates for individual variety blocks (black data points), the overall flowering period for the vineyard is about 15 days, although in 2025 it was 24 days. The flowering order of variety blocks isn’t substantially different from bud break order, suggesting that changes in the order of variety blocks at later growth stages, like Tempranillo ripening earlier than other red-grape varieties, is more a result of how quickly varieties progress through growth stages later in the growing season.
Varieties and their respective blocks are along the vertical axis of the graph, ordered from top to bottom by increasing average day of year of flowering, that is, from earlier to later. Direction of ordering also appears along the far left of the infographic, as the gray line with arrow end points. Day-of-year averages for each variety and block are the larger black points in the graph, and day of year of flowering for individual years are the smaller semi-transparent points. Day of year for flowering dates in 2025 are the red points. Black lines underlying these points extend from the earliest day of year of flowering to the latest for each variety and block, representing the range of flowering dates. Day-of-year values are along the horizontal axis of the graph. Conversion of these values to corresponding month and day appear as dashed gray vertical lines, with text near the bottom of the graph. Day-of-year average values for each variety and block are the left column of numbers at the right of the graph, with corresponding sample sizes in the right column. Variety blocks here correspond to those we saw in similar infographics for bud break dates.
If you have growth-stage dates for different varieties in your vineyard that you’d like to add to this analysis and the overall project, please let us know.
Jeremy Weiss
Extra Notes
The Arizona Meteorological Network recently started measurements at the new Elgin station, located in the Sonoita AVA at Deep Sky Vineyard along Elgin Road. Similar to the Bonita and Willcox Bench stations in the Willcox AVA, its most recent 15-minute data is available online at AZMet in Real-time. Additional data summaries and data downloads also are accessible through the new AZMet website. Please contact AZMet with any questions.
Given recent and current conditions, there is a near-normal potential for significant wildland fires across all of Arizona in July, based on the outlook from the National Interagency Fire Center.
Neither El Niño or La Niña conditions look to affect the monsoon this summer. There is 84 % chance that ENSO-neutral conditions remain for the rest of the June-through-August 2025 period. Chances are 49 % that they persist through the October-through-December 2025 period.
For those of you in southeastern Arizona, including the Sonoita and Willcox AVAs, Cooperative Extension manages an email listserv in coordination with the Tucson forecast office of the National Weather Service to provide information in the days leading up to agriculturally important events, like heat waves and monsoon outbreaks. Please contact us if you'd like to sign up.
And for those of you in north-central and northeastern Arizona, including the Verde Valley AVA, Cooperative Extension also now manages an email listserv in coordination with the Flagstaff forecast office of the National Weather Service to provide similar information for this part of the state. Please contact us if you'd like to sign up.
Undergraduate students in the College of Agriculture and Life Sciences at the University of Arizona are looking for internships with businesses and companies in the viticulture and winery industries. Please contact Danielle Buhrow, Senior Academic Advisor and Graduate Program Coordinator in the Department of Agricultural and Resource Economics, for more information.
Please feel free to give us feedback on this issue of the Climate Viticulture Newsletter, suggestions on what to include more or less often, and ideas for new topics.
Did someone forward you this newsletter? Please contact us to subscribe.
Have a wonderful July!
With current and past support from: