Using geospatial technologies to understand dryland dynamics
![]() No.
51, May/June 2002
No.
51, May/June 2002
Using geospatial technologies to understand dryland
dynamics
| The first map, to the right, shows absorbing aerosol index (AI) values from N7-TOMS data (that is, data collected by the Total ozone mapping spectrometer aboard the Nimbus-7 satellite). these values are comparable to AI index values for other major southern Hemisphere dust sources. | 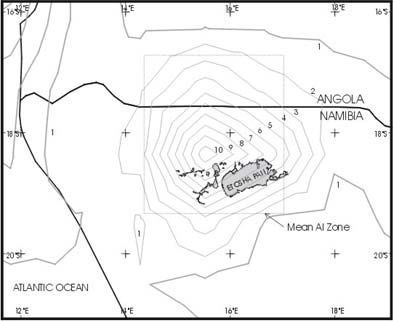 |
| This second map shows AI values derived from EP-TOMS data (that is, data collected by the Total ozone mapping spectrometer aboard the Earth Probe satellite. These values are lower than those derived from the N7-TOMS data but are still consistent with indications of a major regional dust source. | 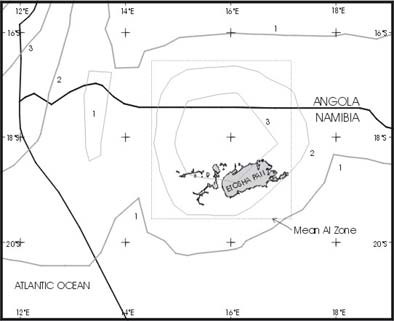 |