Using geospatial technologies to understand dryland dynamics
![]() No.
51, May/June 2002
No.
51, May/June 2002
Using geospatial technologies to understand dryland
dynamics
by Dr. Robert G. Bryant
|
"The use of readily available archives of AVHRR data is a clear means by which the hydrology of large playa systems may be monitored....Monitoring of this nature will [also] aid the process of global modeling of dust emissions for a range of climate scenarios." |
Playas as climatically sensitive systems(Back to top) Nevertheless, flood inundation records from these environments, if monitored properly, could play a role providing both contemporary and past information relating to regionally synchronous changes in P/E for specific dryland regions for which climate data are either sparse or unreliable. This, in turn, would be helpful for understanding climatic trends within specific drylands and would aid the understanding of both contemporary and past sedimentary processes within playa basins. In their work on Owens (Dry) Lake, California, Gill (1996), Niemeyer et al. (1999) and Reheis (1997) have demonstrated that gross changes in the hydrology of a playa (in this case human-induced) can lead to extreme changes in regional dust emissions. It is possible, therefore, that changes in the frequency and extent of natural inundation occurring on large playa systems may lead to significant fluctuations in regional dust loadings. The aim of the author's ongoing research is to examine the application of time-series remote sensing data (e.g. from the Advanced Very High Resolution Radiometer; AVHRR) to monitor and understand the inundation regimes of a range of large, climatically sensitive playas in both northern and southern Africa (Bryant, in press; Bryant and Rainey, in press). More recently, the effects of inundation on dust emissions from specific playas which exhibit extensive and pervasive dust plumes has also been explored. A case study from Etosha Pan, Namibia (summarized from Bryant, in press) outlining both approaches is presented here. Typical data requirements and methods for ephemeral lake monitoring(Back to top) Due to the ephemeral and short-lived nature of flooding on playa systems, long time-series of Earth Observation (EO) satellite data are required (generally > 5 years) that have a high temporal frequency (daily if possible). In most cases, U.S. National Oceanic and Atmospheric Administration (NOAA) AVHRR data [1.1 km resolution at nadir, and daily repeat period] obtained from either the NOAA Satellite Active Archive (SAA) or the Dundee Satellite Receiving Station (DSRS) have been used. AVHRR data have the advantage of good availability (archives are freely accessible, and on-line), and has continuous global coverage stretching from 1979 onwards. Generally, noontime, cloud-free Local Area Coverage (LAC) or High-Resolution Picture Transmission (HRPT) images are collected. Using this approach, time-series of data for most large playas (>100 km2) can be collected on the basis of 4 images per month for most regions. Images are initially geo-rectified and re-projected to a suitable latitude/longitude coordinate system. From the image time-series, a number of useful parameters can be extracted to characterize a short inundation history of each playa:
Total Ozone Mapping Spectrometer (TOMS): dust monitoring The Total Ozone Mapping Spectrometer (TOMS) began taking measurements from the Nimbus 7 (N7) satellite from 1979 to 1993. In 1996 this sensor was superseded by a similar TOMS sensor on board the Earth Probe (EP) satellite. In addition to monitoring ozone, TOMS data can distinguish between different types of aerosol particles based on their size (e.g. dust tends to have larger particles than smoke) and absorbing properties. The absorbing aerosol index (AI) has been derived from TOMS data (see Herman et al. 1997), and has been shown to be reliable in measuring aerosols over oceans, all types of land surfaces (including snow or ice), and clouds. TOMS data has therefore been used successfully by a number of workers in the study of dust emissions from drylands (e.g. Herman et al. 1997; Prospero 1999; Middleton and Goudie 2001). Data from TOMS can easily be projected to a similar latitude/longitude grid to the AVHRR data used in this study. AI is generally mapped on a sliding scale from 0 to 30 (or as 0 to 3.0) in continuous non-dimensional units (0 = low, and 30 = high aerosol loadings). In this study, both N7- and EP-TOMS mean monthly data were obtained from the NASA code 916 TOMS database.
|
|
|
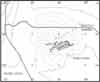
Etosha Pan (or playa) is situated in the eastern part of Etosha National Park in the semi-arid north of Namibia. Etosha Pan has a surface area of approximately 5-6000 km2. It is the center of the larger, internally drained Etosha Basin, located towards the inland interior of northern Namibia and southern Angola at an elevation of approximately 1,000 m above sea level. Much of the water entering Etosha Pan derives from an extensive network of ephemeral channels to the north (locally termed oshanas or omurambas). For much of the year the network of oshanas represents a large tract of sparsely vegetated, fine-grained fluvial sediments. When flow does occur in these channels (principally the Oshigamo and Ekuma) it can lead to shallow inundation within Etosha Pan during the wet season. Throughout much of the year water tables are generally close to the surface of the pan, and springs are common in its southeastern portion (Thomas and Shaw 1991). Therefore, at different times, the network of pans and oshanas within the Etosha Basin represent significant sources of sediment for wind erosion. Within the basin mean annual rainfall varies from 400-450 mm with the majority falling in the summer months from October to April. High inter-annual variability means that rainfall for any one year can vary considerably, from 300 mm below the long-term mean to almost 500 mm above it. Mean monthly temperature ranges from 26 degrees C in December to 17 degrees C in July. Average potential evaporation is approximately 2500 mm per year, with extremes recorded in the period from October to December. TOMS dust loadings in the vicinity of Etosha Pan |
|
|
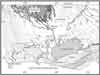
Contour plots of N7-TOMS (1980-1992) and EP-TOMS
(1997-2000) values in the vicinity of Etosha Pan demonstrate that a clear
dust plume can be seen in each data set centered on the Etosha Basin,
confirming that this region is a significant point source for dust emissions
in southern Africa. N7-TOMS values reach a peak mean value of 10 AI units.
These values are comparable to emissions from other large Southern Hemisphere
sources (Lake Eyre, Australia, and Salar de Uyuni, Bolivia) and some Northern
Hemisphere sources (Taklamakan/Tarim basins, China, and the Great Basin
of the USA). However, values are significantly lower than mean values
for dust sources in northern Africa (e.g. the Bodélé Depression
(30 AI units) and the Mauritania-Mali region (21 AI units); Middleton
and Goudie 2001). Values for EP-TOMS are somewhat lower than those for
N7-TOMS, with a maximum mean value of 3 AI units over the Etosha Basin.
This may be accounted for by a range of factors, including: Similar issues with TOMS data have been noted elsewhere (e.g. Alpert and Ganor 2001) and, given that EP-TOMS values are generally lower for all major global dust sources, suggest that the third possibility mentioned above can be discarded. Nevertheless, both EP-TOMS and N7-TOMS data are accurate in identifying significant dust plumes at a regional level. |
|
|
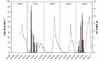
Time-series data of mean monthly AI values for both N7- and EP-TOMS suggest a clear seasonal trend in optical thickness (or dustiness) over the Etosha Basin. Generally, maximum dust loadings tend to occur in the period August-November when surface wind speeds are also at their maximum, and a clear minimum can be observed in the period February-June that covers much of the wet season. Evidence of smoke from biomass burning on the TOMS data is apparent to the north of the Etosha Basin during the dry season but does not seem to have any great impact upon the plume observed within the Etosha basin. Inter-annual variability is also high, with low dust loadings in some years (e.g.1980, 1982, and 1998) and high dust loadings in others (e.g. 1982, 1984, 1989, and 1993). Some of the years with high loadings (e.g. 1992-93) correspond with summers that experienced below-average rainfall, and others (e.g. 1983/84, 1984/85, and 1991/92) correspond with summers that received above-average rainfall within the Etosha Basin (Marsh and Seely 1992). Inundation episodes on Etosha Pan 1996-2000 |
|
|
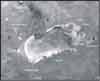
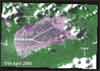
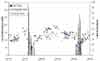
(Back to top) Using reflectance profile data extracted from the image time-series, it was possible to look more closely at the ephemeral nature of inundation on Etosha Pan (periods of high reflectance = dry, periods of low reflectance = wet). In this case, groundwater inflow into the pan from shallow groundwater (which would have a seasonal signature resulting from fluctuations in evaporation rate) was not found to be significant; instead, precipitation was the dominant means of pan inundation. |
|
|
Further observations suggest that despite being of similar magnitude, the two inundation events were different in character. Data for a range of inflow points were extracted from the AVHRR time-series data for Etosha Pan. All of these inflow points were found to be inundated during the first flood event, suggesting that Etosha Pan received inflow from both the oshanas to the north of the pan and from channels flowing into the eastern portion of the pan (e.g. the Ovambo). The timing of dips in reflectance (indicating open water) for Oshigambo Bay and Fishers Pan also suggest that these were primary inflow points during this flood, and that the rainfall causing the inundation must have occurred over a large part of the Etosha Basin. During the second flood event, surface water was initially only detected in and around Oshibambo Bay, with Andoni Bay and Poacher Inlet only experiencing minor inundation. This suggests that the primary source of inflow during this event was the oshanas to the north of the pan, and that rainfall may have been more localized. The effects of inundation on Etosha Pan on dust emissions (Back to top) Wider implications of this work(Back to top) Acknowledgements(Back to top) References(Back to top) Birkett, C. M. 2000. Synergistic remote sensing of Lake Chad: Variability of basin inundation. Remote Sensing of the Environment 72:218-236. Bryant, R. G. 1999. Monitoring climatically sensitive playas using AVHRR data. Earth Surface Process and Landforms 24:283-302. ______ . In press. Monitoring hydrological controls on dust emissions: Preliminary observations from Etosha Pan, Namibia. Bryant, R. G., N. A. Drake, A. C. Millington and B. W. Sellwood 1994a. The chemical evolution of the brines of Chott el Djerid, Southern Tunisia, after an exceptional rainfall event in January 1990. In The Sedimentology and Geochemistry of Modern and Ancient Saline Lakes, ed. R. W. Renaut and W. M. Last, pp. 3-12. Society for Sedimentary Geology (SEPM) Special Publication 50. Bryant, R. G., B.W. Sellwood, A.C. Millington, and N.A. Drake. 1994b. Marine-like potash evaporite formation on a continental playa: Case study, Chott el Djerid, southern Tunisia. Sedimentary Geology 90(3-4):269-291. Bryant, R. G., and M.P. Rainey. In press. Investigation of inundation on playas within the Zone of Chotts using a time series of NOAA-AVHRR. Drake, N.A. and R.G. Bryant. 1994. Monitoring the flooding ratio of Tunisian playas using advanced very high-resolution radiometer (AVHRR) imagery. In Environmental Change in Drylands: Biogeographical and Geomorphological Perspectives, ed. A.C. Millington and K. Pye. London: John Wiley & Sons. Gill, T. E. 1996. Eolian sediments generated by anthropogenic disturbance of playas: Human impacts on the geomorphic system and geomorphic impacts on the human system. Geomorphology 17:207-228. Harris, A. R., and I.M. Mason. 1989. Lake area measurement using the AVHRR. International Journal of Remote Sensing 10:885-895. Herman, J. R., P.K. Bhartia, O. Torres, C. Hsu, C. Seftor, and E. Celarier. 1997. Global distribution of UV-absorbing aerosols from Nimbus7/TOMS data. Journal of Geophysical Research 102(D14):16911-16922. Kotwicki, V., and P. Isdale. 1991. Hydrology of Lake Eyre, Australia - El-Niño link. Palaeogeography, Palaeoclimatology, Palaeoecology 84(1-4):87-98. Marsh, A. and M. Seely, eds. 1992. Oshanas, Sustaining People, Environment and Development on Central Owambo, Namibia. Windhoek, Namibia: Desert Research Foundation of Namibia. Middleton, N. J., and A.S. Goudie. 2001. Saharan dust: Sources and trajectories. Transactions of the Institute of British Geographers 26:165-181. Niemeyer, T. C., D.A. Gillette, J.J. Deluisi, Y.J. Kim, W.F. Niemeyer, T. Ley, T.E. Gill, and D. Ono. 1999. Optical depth, size distribution and flux of dust from Owens Lake, California. Earth Surface Processes and Landforms 24:463-479. Prospero, J. M. 1999. Long range transport of mineral dust in the global atmosphere: Impact of African dust on the environment of the southeastern United States. Proceedings of the National Academy of Sciences, USA 96:3396-3403. Reheis, M. C. 1997. Dust deposition downwind of Owens (dry) Lake, 1991-1994: Preliminary findings. Journal of Geophysical Research-Atmospheres 102(D22):25999 -26008. Thomas, D. S. G., and P.A. Shaw. 1991. The Kalahari environment. Cambridge; New York: Cambridge University Press. |
![]()
(Back to top)
Rob Bryant is a lecturer in applied remote sensing at the Department of Geography
and the Sheffield Centre for Earth Observation Science (SCEOS), University of
Sheffield. You can contact him as follows:
Dr. Rob Bryant
Department of Geography
University of Sheffield
Winter Street
Sheffield S10 2TN
UK
Email: r.g.bryant@sheffield.ac.uk
Web: http://www.shef.ac.uk/geography/staff/bryant_rob.html
(Back to top)
NOAA Satellite Active Archive (SAA)
http://www.saa.noaa.gov/
Dundee Satellite Receiving Station (DSRS)
http://www.sat.dundee.ac.uk/
NASA code 916 TOMS database
http://jwocky.gsfc.nasa.gov/
GIS data for North Central Namibia
http://www.dea.met.gov.na/nnep/index.htm
About the Arid Lands Newsletter