The Knowledge Base
 |
The Advanced Resource Technology Group: The Knowledge Base |
ART LINKS:
- Home - Data Repository - Knowledge Base - Resources - Research - Publications - Education - Software - People - Links - Policies - Contact Us 6/19/02 |
By: Bill Huber
Published in: Directions Magazine (Jul 18, 2000)
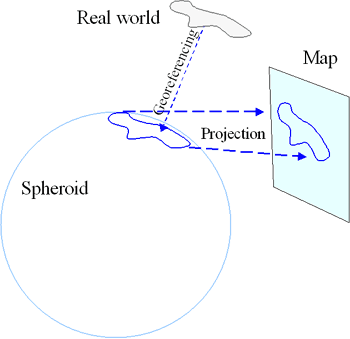
Reprojecting geographic featuresTwo things must happen when you draw a map: features in the real world must be "georeferenced" to a spheroid and the spheroid must be projected onto the paper.

The spheroid models the shape of the earth's surface. It is an idealization that does not account for local changes in topography. Georeferencing assigns locations (in three dimensions!) to points on a spheroid. Projecting is an operation that mathematically distorts and shrinks a portion of the spheroid onto flat paper. Projecting can be undone ("inverted"). "Unprojection" expands a feature on a map and plasters it back onto the spheroid. It, too, is a mathematical operation. Georeferencing is done with a datum. A datum is usually given by a starting point and direction: it specifies where a clearly identifiable point on earth (the base point) should appear on the spheroid and it shows where a base direction, such as north, points on the spheroid at the base point. The base point and direction allow surveyors to determine the distance and angle of any other point on the earth. Moving in the corresponding direction on the spheroid for the same distance determines where the new point should go on the spheroid. Spheroids have coordinates. They are latitude and longitude. (Geodetic) latitude is the angle made by a vertical line to the horizontal. It is not necessarily the same angle made by "straight up," because the latter is distorted by gravitational variation over the earth. It is not necessarily the angle made by a line to the center of the earth, because most spheroids have an elliptical cross-section, not a circular one. Therefore, georeferencing endows points near the earth with latitude, longitude, and height coordinates. Change of datumWhen more than one datum is in play, the coordinates depend on the datum.

The figure above shows this in two dimensions, suppressing the third for clarity. The red ellipse represents one spheroid and the blue ellipse represents another. Notice they have different shapes and even different centers. (x,y) denotes a point near the earth. Theta is its geodetic latitude and h is its geodetic height with respect to the red spheroid. Theta' and h' are its coordinates with respect to the blue spheroid. Evidently, at this point the height and the latitude on the blue spheroid are each smaller than their counterparts on the red spheroid. (The values a, b, a', and b' merely show the different radii for the spheroids.) In practice, these differences in coordinates are large enough to be important in many applications. As the U.S. military says, "Ignoring the fine print in the margin of a map could get you killed!" How to relate two mapsTwo maps may use two different datums and two different projections. The process of relating features on one map to features on another is involved, but straightforward, as the next figure shows.

To shift the red feature from the yellow map ("source") to the blue map ("destination"), or reproject it, follow four steps in this order:
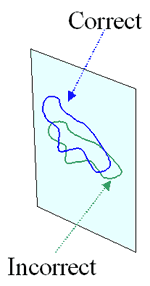
The datum shift guarantees that the feature on the destination map correctly represents the same real-world object depicted by the feature on the source map. The wrong way to do itWe have to mention one wrong way, because limitations in mapping software tempt people to do this. What happens when we ignore the datum shift?

An apparent shift in datum occurs anyway. This comes about because software (or, in earlier times, the draftsman) uses spheroid coordinates to compute the projection. The red feature on the red spheroid is determined by its coordinates. That same set of coordinates, when drawn on the blue spheroid, produces the blue feature shown. When projected, its map is the green feature in the destination map. However, this process usually produces the wrong result.

We say "usually," because in some cases the net error is smaller than imprecision in the maps themselves. But in other cases the error can be hundreds of meters, even kilometers. That is a large distortion on detailed ("large scale") maps. North America is a special caseTwo datums for regions in North America are in common use: NAD 27 and NAD 83. They are based on different spheroids. Furthermore, fairly large errors accumulated in the surveyed locations using the earlier NAD 27 datum. These errors are difficult to describe mathematically. Instead, the U.S. National Geodetic Survey (NGS) offers the NADCON computer program, with Fortran source code, to convert coordinates between these two datums. NADCON effectively performs both steps 2 and 3 in the reprojection algorithm. Therefore you do not need to worry about the spheroids themselves when using NADCON. You do need to have the appropriate data files describing the changes. They are also available from the NADCON web site.
More about this author
| ||||||||||||||||||||||||||||||||||||||||||||||||||||||||||||