< Back to Climate Viticulture Newsletter
Hello, everyone!
This is the December 2023 issue of the Climate Viticulture Newsletter – a quick look at some timely climate topics relevant to wine grape growing in Arizona.
IN THIS ISSUE
- A Recap of November Temperature and Precipitation
- The Outlook for December Temperature and Precipitation
- Comparison of Canopy and AZMet Station Measurements
- Extra Notes
A Recap of November Temperature and Precipitation
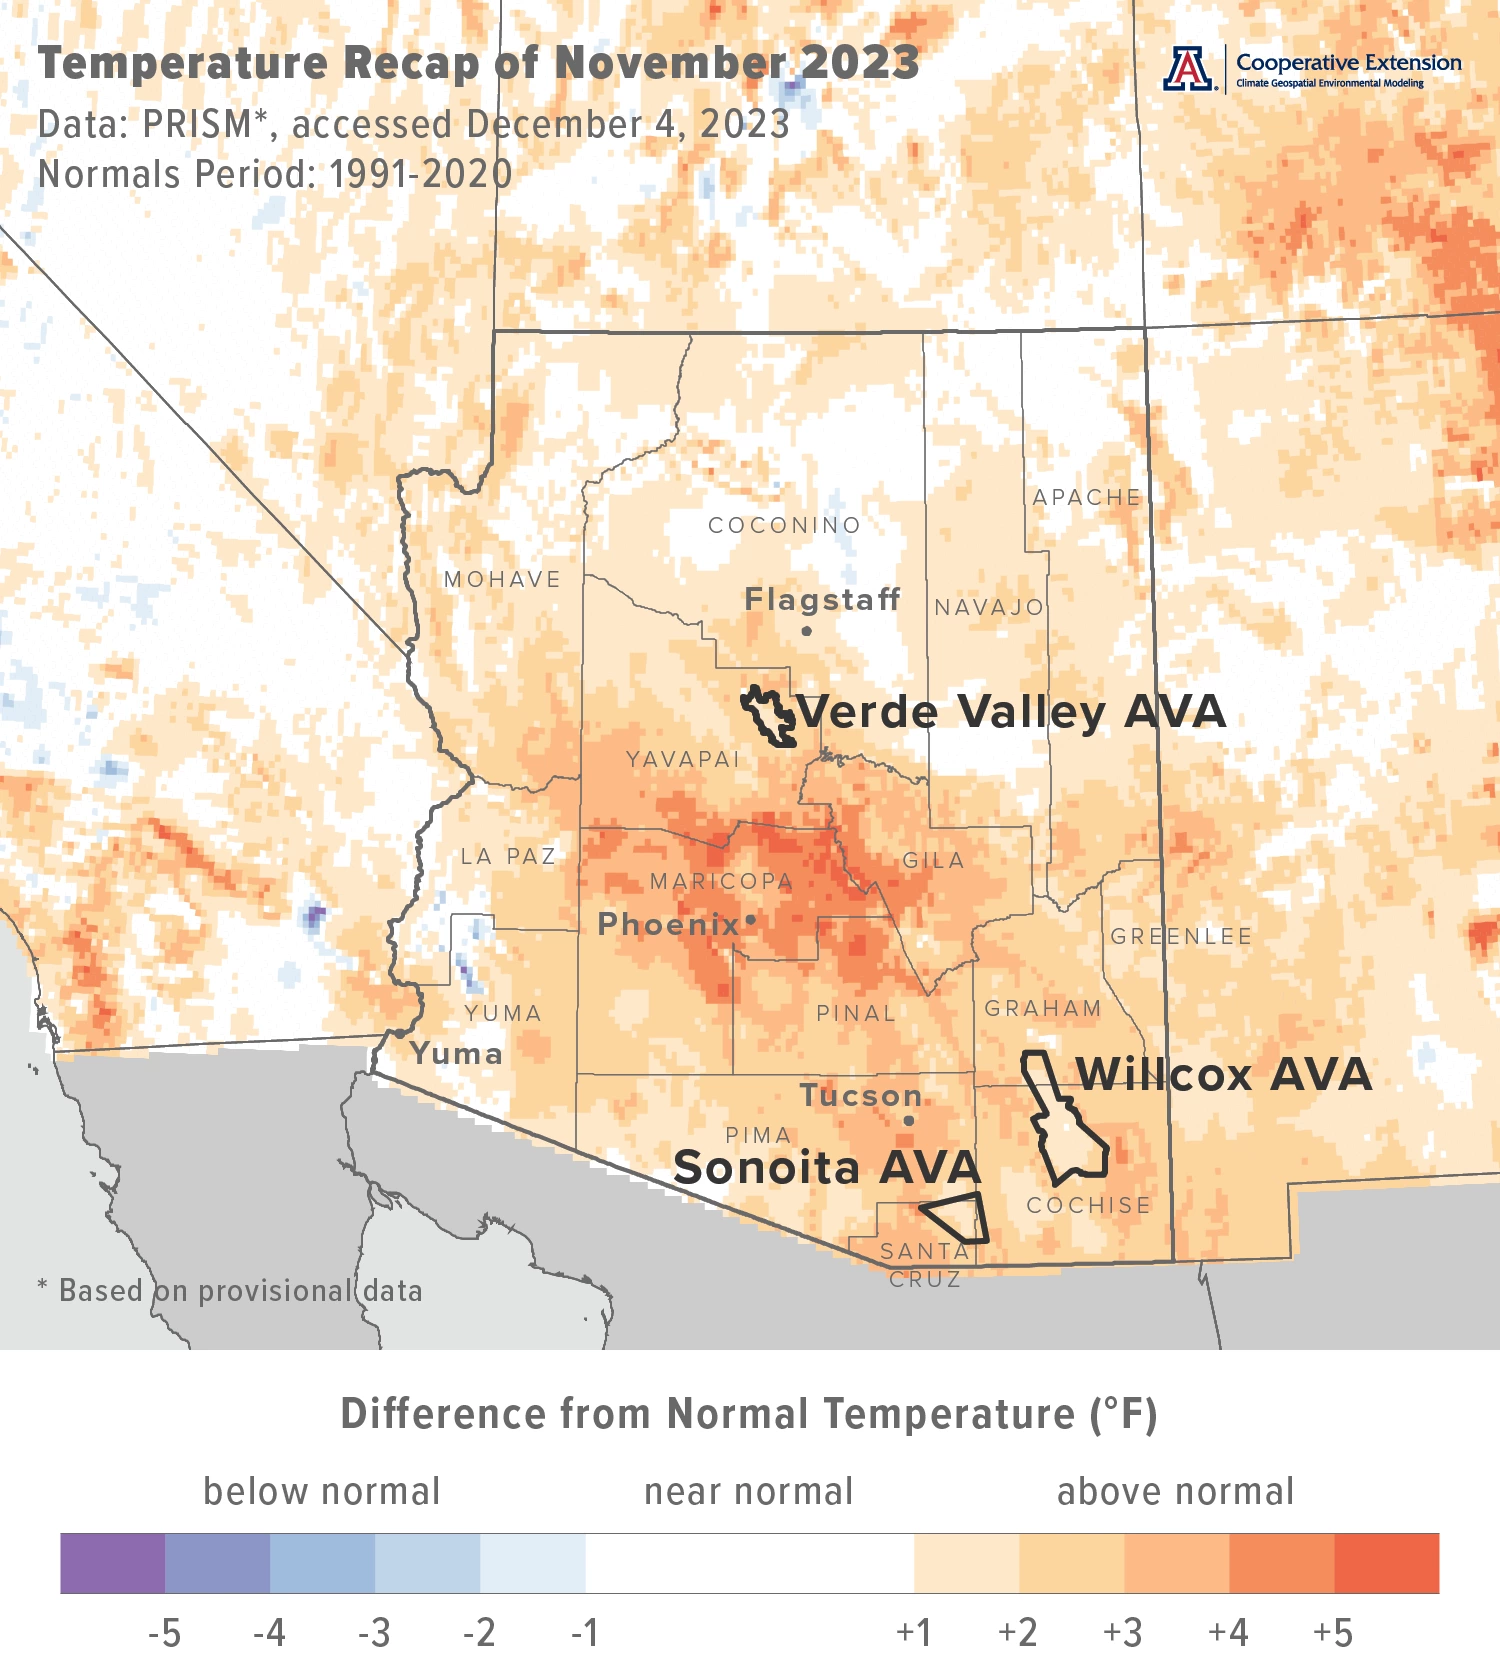
Monthly average temperatures were 1 to 4 °F above the 1991-2020 normal for much of Arizona (light orange and orange areas on map), including all three Arizona AVAs. Some locations in the central part of the state recorded values more than 4 °F above normal (darker orange areas on map), whereas others in the northern tier recorded values near normal (white areas on map). For reference monthly temperatures in November last year were at least 3 to 5 °F below normal for almost the entire state.
Area-average maximum and minimum temperatures during November 2023 were 69.1 and 40.8 °F for the Sonoita AVA, 70.4 and 38.2 °F for the Verde Valley AVA, and 69.8 and 39.4 °F for the Willcox AVA. Respective November normals are 67.2 and 38.2 °F, 67.5 and 36.6 °F, and 68.6 and 36.7 °F.
Jeremy Weiss
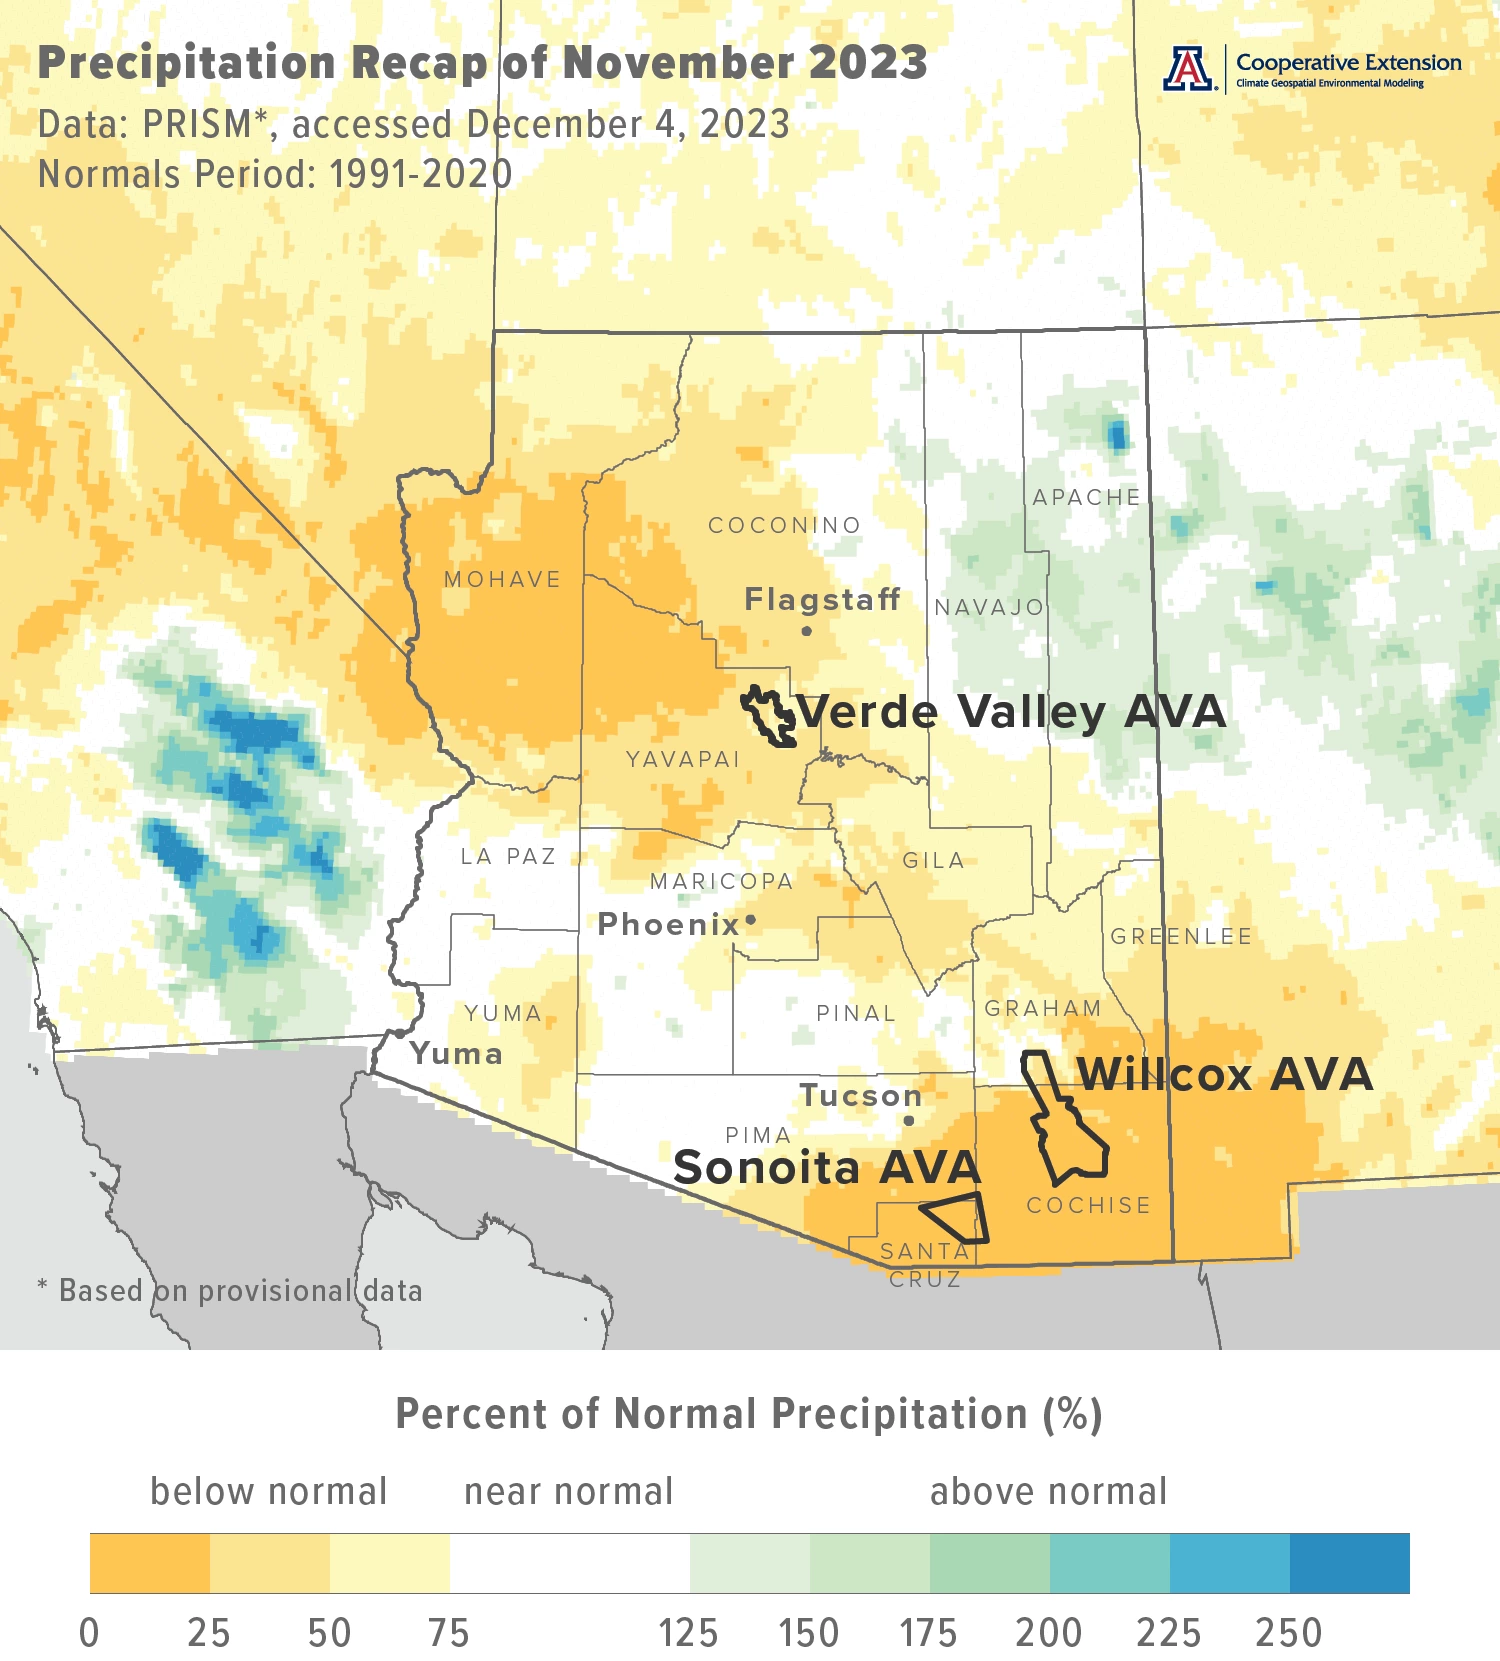
Monthly precipitation totals were less than 50 % of normal across much of the northwestern and southeastern parts of the state (yellow and dark yellow areas on map), including much of the Verde Valley and Willcox AVAs and all of the Sonoita AVA. Many locations in southwestern and northeastern Arizona recorded near-normal amounts (white areas on map), with some in the latter area measuring totals 125 to 175 % of normal (light aqua and aqua areas on map). Precipitation during November 2022 was less than 50 % of normal for much of southern and north-central Arizona. Many areas in the northern half of the state measured between 50 and 150 % of normal.
Area-average total precipitation in November 2023 was 0.07 inches for the Sonoita AVA, 0.42 inches for the Verde Valley AVA, and 0.12 inches for the Willcox AVA. Respective November normals are 0.84, 0.83, and 0.73 inches.
Dig into daily weather summaries from 2023 for the AZMet Bonita and Willcox Bench stations in the Willcox AVA
Learn more about PRISM climate data
Jeremy Weiss
The Outlook for December Temperature and Precipitation
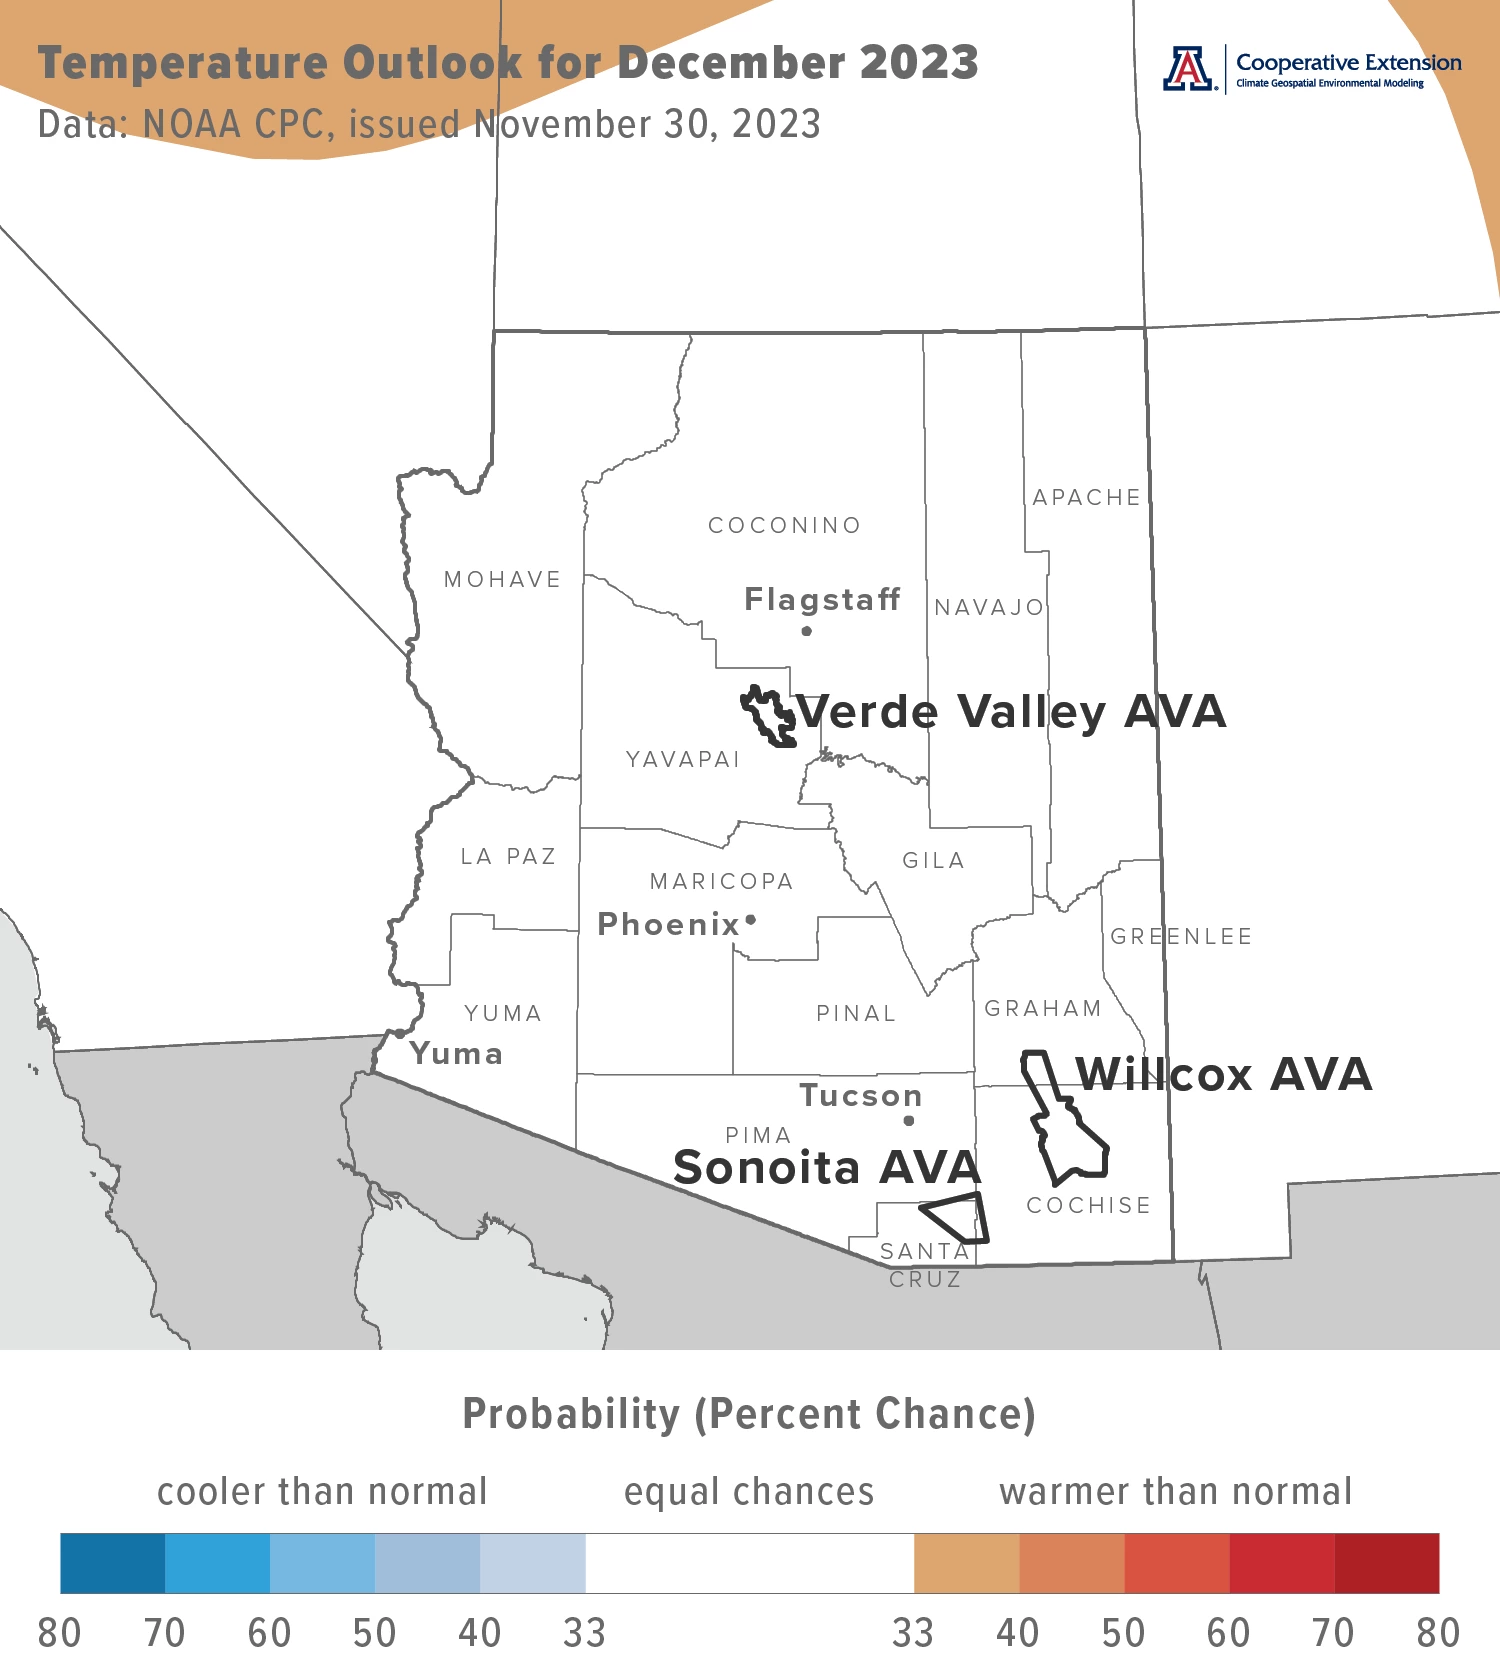
Temperatures over the course of this month have equal chances for being below, near, or above the 1991-2020 normal across all of Arizona (white area on map). Monthly temperatures in December last year were 1 to 3 °F above normal for most of the eastern one-third of Arizona. Much of the rest of the state saw near-normal temperatures.
Area-average maximum and minimum temperatures during December 2022 were 59.1 and 32.7 °F for the Sonoita AVA, 56.0 and 31.1 °F for the Verde Valley AVA, and 60.3 and 30.5 °F for the Willcox AVA. Respective December normals are 58.3 and 31.5 °F, 57.2 and 30.0 °F, and 59.0 and 30.2 °F.
Jeremy Weiss
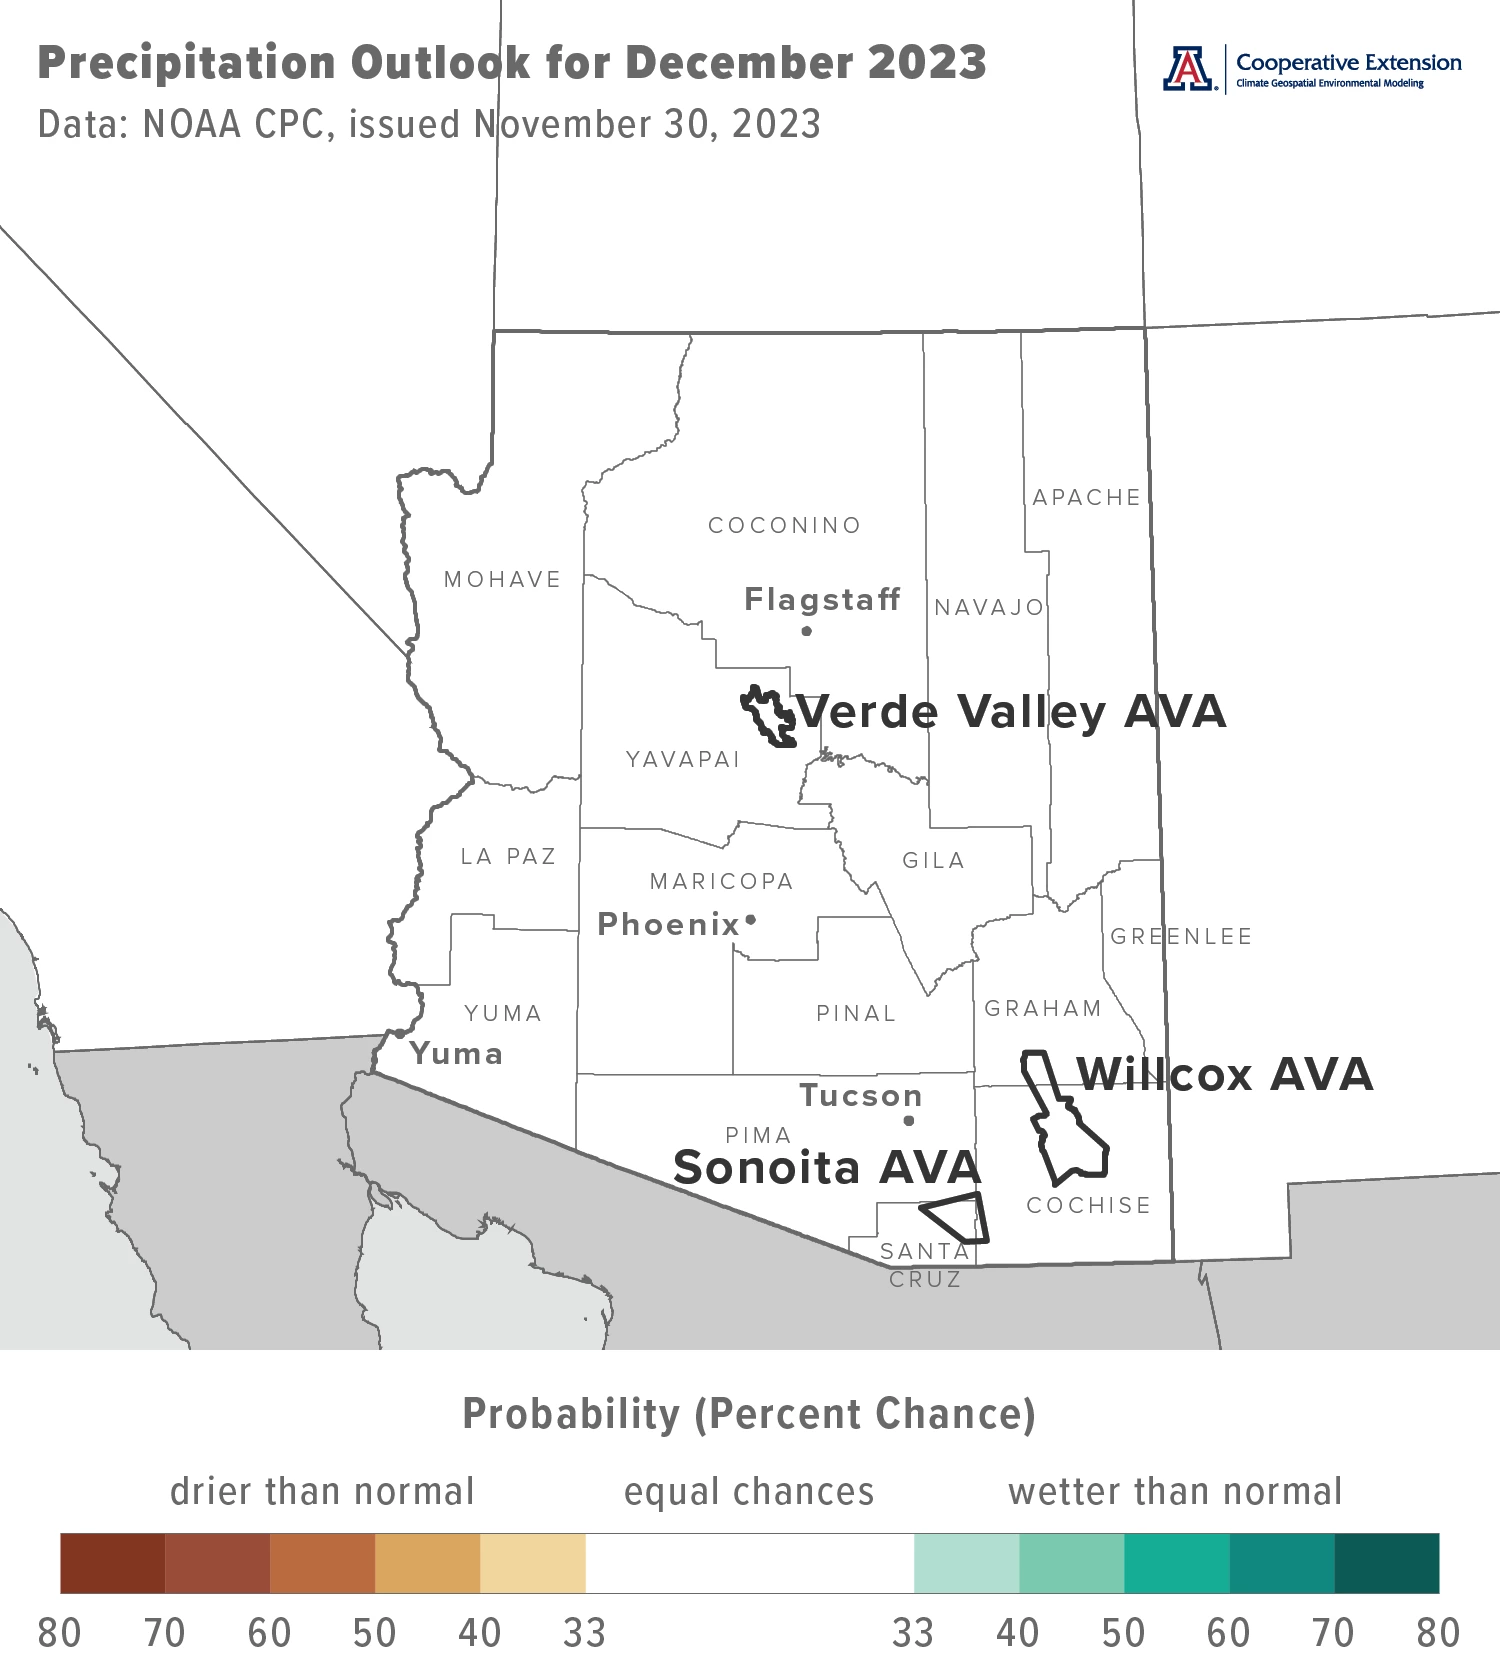
Precipitation totals for this month have equal chances for being below, near, or above normal for the entire state (white area on map). Precipitation during December 2022 was more than 125 % of normal for much of the south-central, east-central, and extreme northwestern parts of the state. Otherwise, totals for many locations were near normal.
Area-average precipitation totals in December 2022 were 1.84 inches for the Sonoita AVA, 1.39 inches for the Verde Valley AVA, and 1.34 inches for the Willcox AVA. Respective December normals are 1.40, 1.37, and 1.08 inches.
To stay informed of long-range temperature and precipitation possibilities beyond the coverage of a standard weather forecast, check in, too, with the six-to-ten-day outlook and eight-to-fourteen-day outlook issued daily by NOAA’s Climate Prediction Center.
Jeremy Weiss
Comparison of Canopy and AZMet Station Measurements
We bend the newsletter rules a bit for this topic, as it is not quite in-season information. But, we’re catching up on some previous data collection, squeezing it in when we can. What we have are some canopy temperature and humidity measurements from Buhl Memorial Vineyard to compare to those from the AZMet Willcox Bench station. We’ve been leaning on data from this AZMet station in recent newsletter issues to help develop a descriptive model of ripening conditions. In this issue, we provide an initial and opportunistic assessment of how this model might change when moving away from the station and into the vineyard.
Using hourly average temperatures from July through September 2022, 90 % of the differences calculated between corresponding values from canopy sensors and the AZMet station have values between -4.7 and +3.2 °F. A negative difference means temperature is warmer at the sensor, a positive one warmer at the station. There is a tendency for canopy temperature to be warmer than what is measured at the station between approximately 7 AM and 4 PM, with the greatest differences around noon. During other hours, canopy temperatures tend to be cooler than those at the station.
Using hourly average relative humidity during this three-month period, 90 % of differences have values between -15 and +3 %. A negative difference means relative humidity is higher at the sensor, a positive one higher at the station. Relative humidity in the canopy tends to be higher than that at the station for all hours of the day. However, differences are smallest around 6 AM and greatest around 6 PM.
Although opportunistic and without sensor-station calibration statistics, the above results make biophysical sense. The diurnal pattern of differences for temperature may be due in part to the absorption of sunlight by the canopy and subsequent dissipation of excess heat to the surrounding air. For relative humidity, the diurnal pattern may be driven in part by vine transpiration and the resulting addition of water vapor to the surrounding air. While we quantify these differences above, our attention is focused more on the daily variations than the specific values.
Nonetheless, results leave open implications related to the vineyard. For example, is exposure to afternoon maximum temperatures that affect vine and fruit physiology and metabolism greater than that indicated by analysis of data from the AZMet Willcox Bench station? Are disease pressures that are tied to humidity greater than those predicted by models using station data? We will continue to work with canopy sensor data to help answer questions like these.
For context, maximum and minimum temperatures during the 2022 ripening season were near normal, whereas total precipitation was above normal. Alas, we did not redeploy the sensors this past growing season when conditions during ripening were, in contrast, relatively hotter and drier.
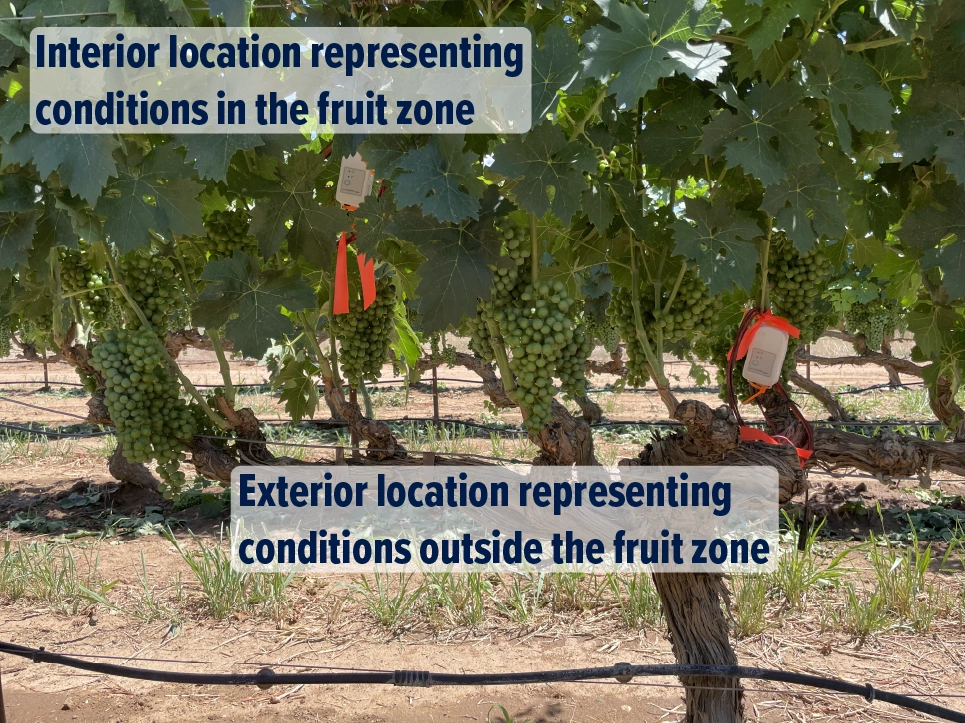
Canopy sensors are Onset HOBO MX2300 data loggers that measure temperature and relative humidity (white plastic objects with orange flagging in picture). Sensors calculate hourly values that temporally match hourly measurements at the AZMet Willcox Bench station, which is about 0.5 miles to the west-southwest of Buhl Memorial Vineyard. We placed sensors in canopies of six different varieties, both in and outside the fruit zone (annotations in picture). That is, at interior and exterior locations, respectively. Here, we present data from the six sensors located in the fruit zone. The view in the picture is from the north and represents how we placed sensors in canopies of the other five varieties.
We thank Jesse Noble, Merkin Vineyards for cooperation with data collection and Iglobes Interdisciplinary and Global Environmental Studies for funding for the canopy sensors.
Jeremy Weiss
Extra Notes
Cooperative Extension is presenting the Winter Viticulture Symposium from 7:30 am to 3:30 pm on December 6, 2023, at the University of Arizona Controlled Environment Agriculture Center in Tucson. There will be presentations and discussions about vineyard irrigation, soil and soil fertility, entomology, pathology, weather and climate, and small-business development, a workshop-style review of the 2023 growing season, as well as lunch sponsored by the Arizona Wine Growers Association. The symposium is free, but registration is required and space is limited. Please contact Sierra Sheeks to register or for more information.
The American Journal of Enology and Viticulture recently published an article by Dr. Markus Keller, the keynote speaker at the Arizona Viticulture Summit last March, entitled, “Climate Change Impacts on Vineyards in Warm and Dry Areas: Challenges and Opportunities”. Topics include crop load, yield, fruit composition, and vine growth, physiology, and phenology.
The current El Niño event has a greater than 95 % chance to continue through the February through April timeframe, when its influence on regional temperature and precipitation could be significant. Furthermore, the odds that it persists as a “strong” event through this winter now are greater than 55 %. Despite its current categorization, please keep in mind that chances of any related anomalies in our winter weather often are lower than chances of the event itself.
A new Extension bulletin about breakout group discussions at the 2023 Arizona Viticulture Summit last March is now available. In addition to a summary of the discussions, the authors identify the topics that occurred most frequently among the thematic areas of viticultural production, industry and economic development, operations management, technology integration, and customer acquisition and fulfillment and brand development.
For those of you in southeastern Arizona, including the Sonoita and Willcox AVAs, Cooperative Extension manages an email listserv in coordination with the Tucson forecast office of the National Weather Service to provide information in the days leading up to agriculturally important events, like cold-air outbreaks and the occasional winter storm. Please contact us if you'd like to sign up.
And for those of you in north-central and northeastern Arizona, including the Verde Valley AVA, Cooperative Extension also now manages an email listserv in coordination with the Flagstaff forecast office of the National Weather Service to provide similar information for this part of the state. Please contact us if you'd like to sign up.
Undergraduate students in the College of Agriculture and Life Sciences at the University of Arizona are looking for internships with businesses and companies in the viticulture and winery industries. Please contact Danielle Buhrow, Senior Academic Advisor and Graduate Program Coordinator in the Department of Agricultural and Resource Economics, for more information.
Please feel free to give us feedback on this issue of the Climate Viticulture Newsletter, suggestions on what to include more or less often, and ideas for new topics.
Did someone forward you this newsletter? Please contact us to subscribe.
Have a wonderful December!
With current and past support from:
