
Climate Viticulture Newsletter - 2024 July
< Back to Climate Viticulture Newsletter
Hello, everyone!
This is the July 2024 issue of the Climate Viticulture Newsletter – a quick look at some timely climate topics relevant to wine grape growing in Arizona.
IN THIS ISSUE
- A Recap of June Temperature and Precipitation
- The Outlook for July Temperature and Precipitation
- Heat Accumulation during the Growing Season
- Extra Notes
A Recap of June Temperature and Precipitation
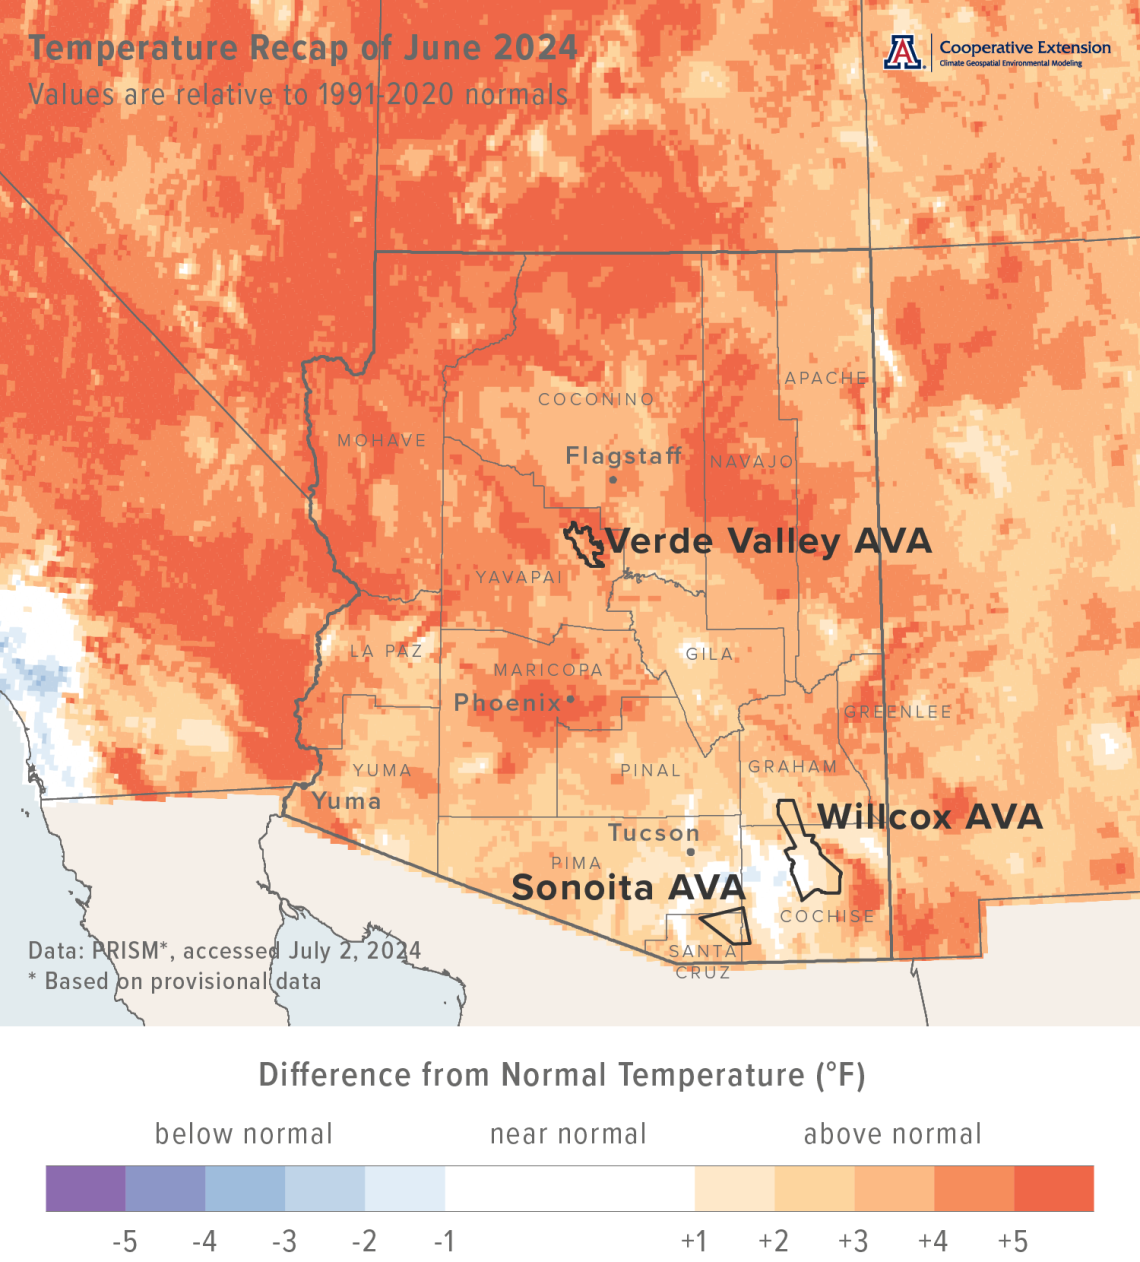
Monthly average temperatures were 2 to 4 °F above the 1991-2020 normal for much of the southeastern half of Arizona (light orange and orange areas on map), including parts of the Sonoita and Willcox AVAs. Much of the northwestern half of the state, including parts of the Verde Valley AVA, measured temperatures more than 4 °F above normal (dark orange and red areas on map). This is quite a change from June last year, when monthly average temperatures were 1 to 4 °F below normal for much of the southeastern and east-central parts of the state, while much of the rest measured temperatures even further below normal.
Area-average maximum and minimum temperatures during June 2024 were 93.1 and 61.3 °F for the Sonoita AVA, 98.6 and 63.8 °F for the Verde Valley AVA, and 95.0 and 61.9 °F for the Willcox AVA. Respective June normals are 90.6 and 59.0 °F, 95.4 and 58.4 °F, and 94.5 and 59.1 °F.
Temperature last month ranged between 103.1 and 51.4 °F at the AZMet Bonita station and between 103.6 and 52.9 °F at the AZMet Willcox Bench station.
cvn-recap-202407-tmeanDepartureNormal.png
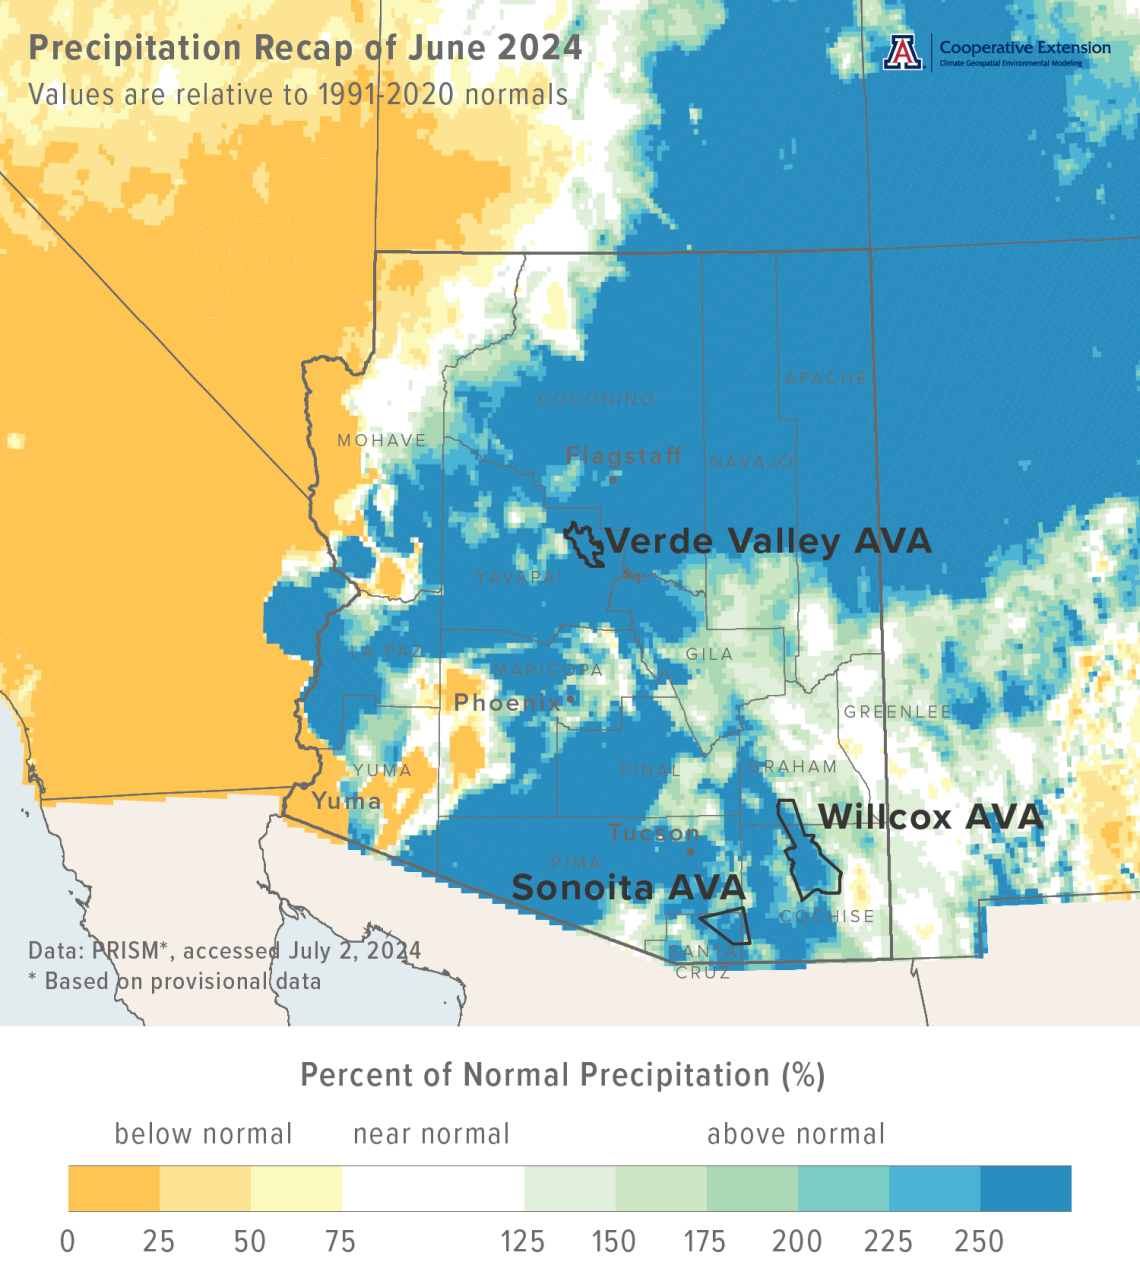
A relatively early start to the monsoon led to monthly precipitation totals that were more than 200 % of normal for many parts of the state (dark aqua, blue, and dark blue areas on map), including all three Arizona AVAs. Keep in mind, however, that normal June amounts are near zero for many locations in southwestern, west-central, and northwestern Arizona, and that it does not take much rain to raise this statistic. Only locations in extreme southeastern and east-central Arizona and along the western state border recorded near or below-normal totals (white, light yellow, yellow, and dark yellow areas on map). Precipitation during June 2023 was less than 25 % of normal for the southern two-thirds of the state, and between 25 and 125 % of normal for the northern one third.
Area-average total precipitation in June 2024 was 1.43 inches for the Sonoita AVA, 0.99 inches for the Verde Valley AVA, and 1.02 inches for the Willcox AVA. Respective June normals are 0.55, 0.18, and 0.42 inches.
Total precipitation last month was 0.67 and 1.75 inches at the AZMet Bonita and Willcox Bench stations, respectively.
Dig further into daily weather summaries for the AZMet Bonita and Willcox Bench stations in the Willcox AVA
View seasonal summaries of monsoon rainfall through regional maps and weather station statistics
Learn more about PRISM climate data
cvn-recap-202407-pptPercentNormal.png
The Outlook for July Temperature and Precipitation
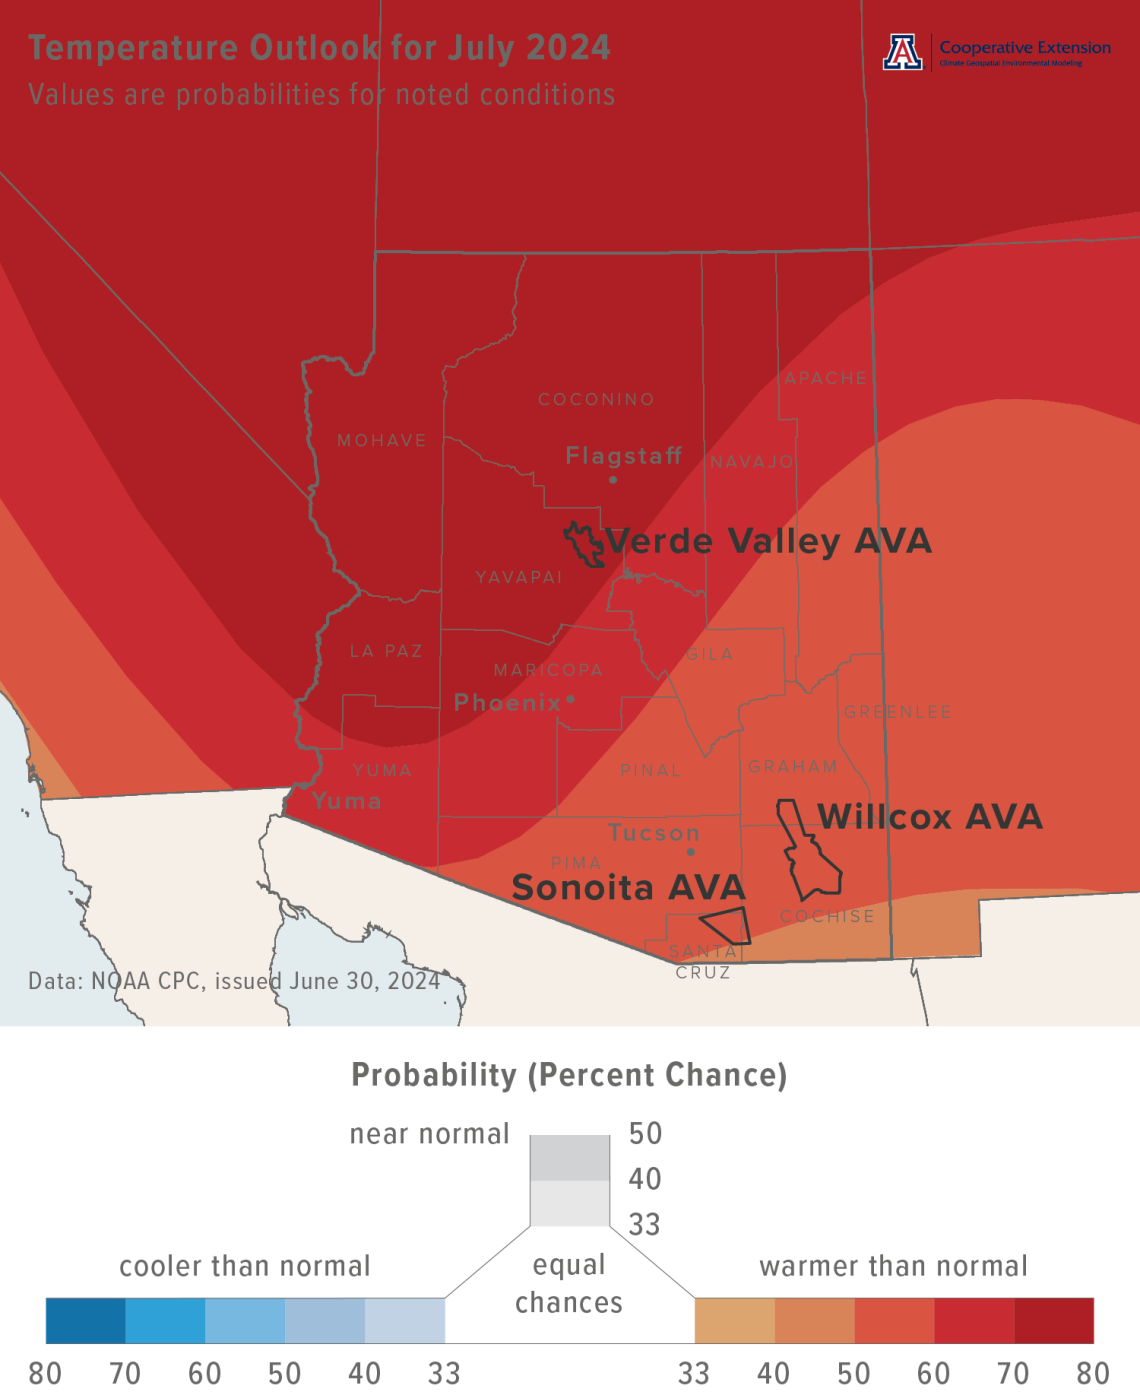
Temperatures over the course of this month have a considerable increase in chances for being above the 1991-2020 normal across the northwestern half of Arizona (dark red area on map). Across the southeastern half, there is a moderate increase in chances for above-normal temperatures (red and dark orange areas on map), except for the extreme southeastern corner of the state where it is slight (orange area on map). Monthly average temperatures in July last year set heat records and were 3 to 5 °F above normal for much of the northern half of the state, and more than 5 °F above normal for much of the southern half.
Area-average maximum and minimum temperatures during July 2023 were 96.1 and 65.7 °F for the Sonoita AVA, 105.0 and 68.5 °F for the Verde Valley AVA, and 100.0 and 66.8 °F for the Willcox AVA. Respective July normals are 88.5 and 62.8 °F, 98.1 and 66.0 °F, and 93.6 and 64.9 °F.
Temperature in July last year ranged between 105.6 and 53.6 °F at the AZMet Bonita station and between 106.0 and 52.2 °F at the AZMet Willcox Bench station.
cvn-outlook-202407-temp.png
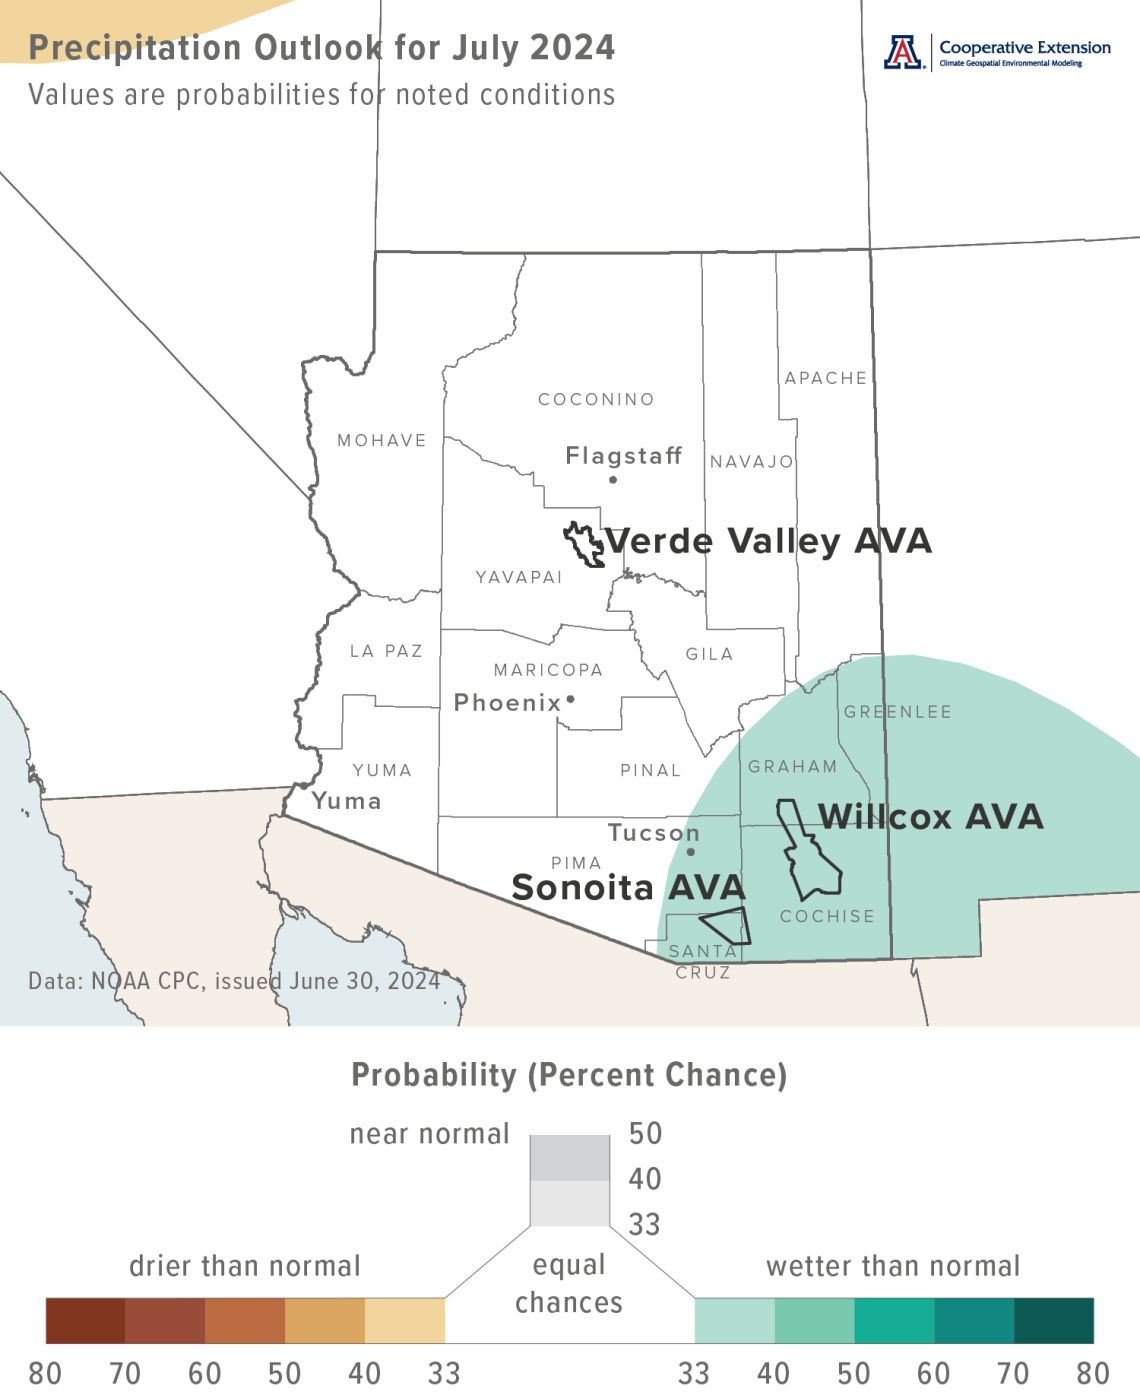
Precipitation totals for this month have a slight increase in chances for being above normal in the southeastern part of the state (light aqua area on map). For the rest of Arizona, there are equal chances for below-, near-, or above-normal totals (white area on map). Precipitation during July 2023 was between 25 and 75 % of normal for many locations in north-central, extreme south-central, and southeastern Arizona, including the Sonoita and Willcox AVAs. Otherwise across the state, most locations measured less than 25 % of normal rainfall, including much of the Verde Valley AVA.
Area-average precipitation totals in July 2023 were 2.21 inches for the Sonoita AVA, 0.35 inches for the Verde Valley AVA, and 0.92 inches for the Willcox AVA. Respective July normals are 4.06, 1.75, and 2.67 inches.
Total precipitation in July last year was 0.07 and 0.43 inches at the AZMet Bonita and Willcox Bench stations, respectively.
To stay informed of long-range temperature and precipitation possibilities beyond the coverage of a standard weather forecast, check in, too, with the six-to-ten-day outlook and eight-to-fourteen-day outlook issued daily by NOAA’s Climate Prediction Center.
cvn-outlook-202407-prcp-update.png
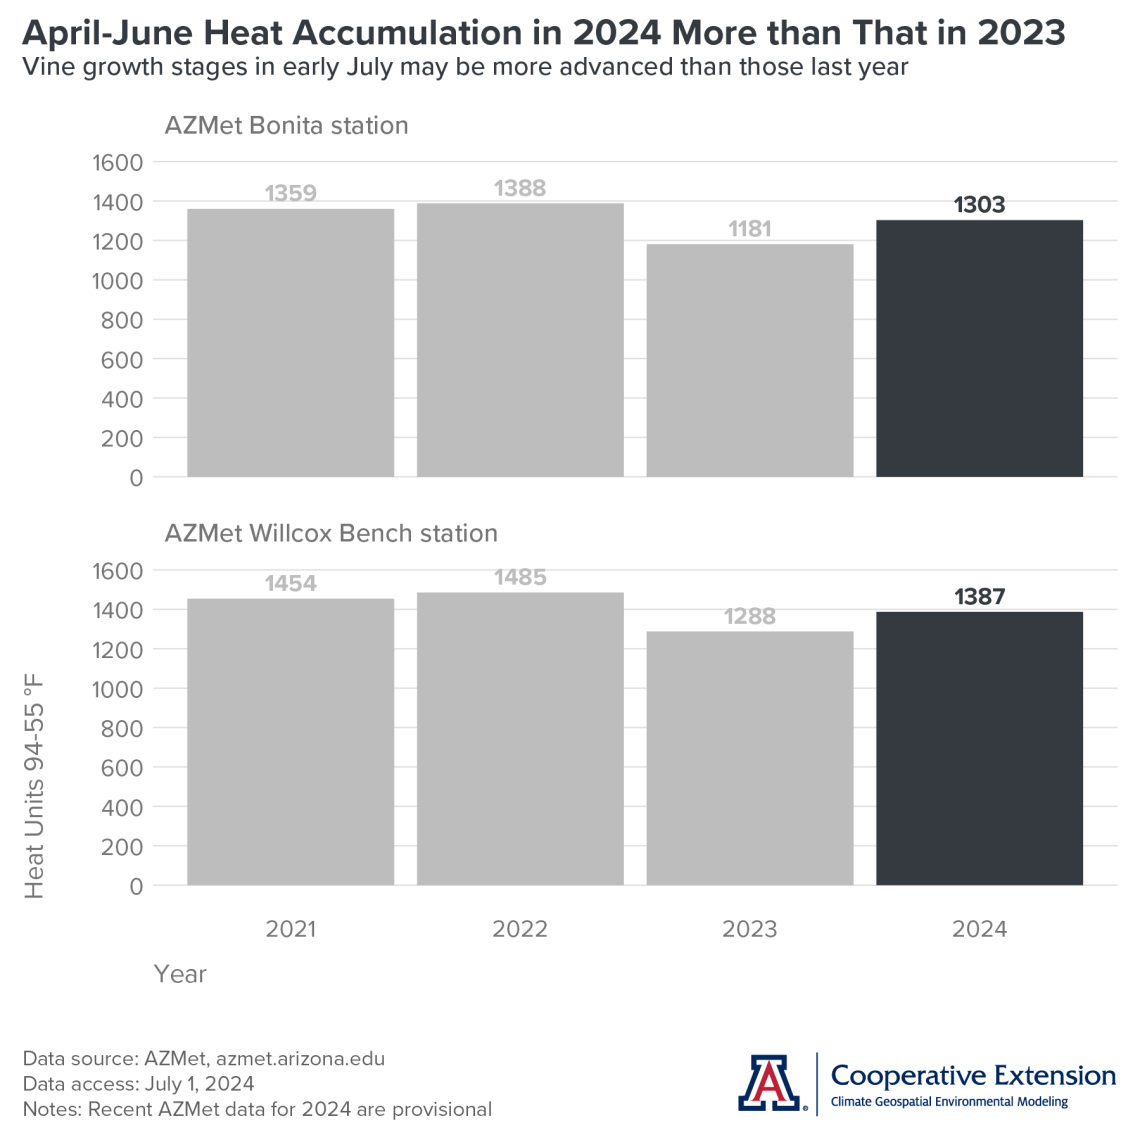
Heat Accumulation during the Growing Season
Heat accumulation from April through June this year at the AZMet Bonita and Willcox Bench stations (dark gray bars on graphs) is more than what it was during this time last year. This suggests that vine growth stages in early July may be more advanced this growing season than what they were in the previous one, assuming similar bud-break dates. The switch from being behind 2023 last month to being ahead this month is not surprising, given the above-normal temperatures in June 2024 and the below-normal ones in June 2023. Also, heat accumulation is greater at AZMet Willcox Bench than at AZMet Bonita, suggesting that a given variety in the south-central part of the Willcox AVA is at a more advanced growth stage than in the northern part, all else equal. Over the past four years (dark gray and gray bars on graphs), the greatest amount of heat accumulation for both locations at this point in the growing season happened in 2022.
Unlike previous years, we’re using heat units with an upper threshold of 94 °F and a lower threshold of 55 °F to measure heat accumulation. With heat units, in theory, plants slowly start to progress through growth stages near the lower threshold, reach an optimal development rate at temperatures between the lower and upper thresholds, and progressively slow development near the upper threshold. Outside of the range between the lower and upper thresholds, as what happened several afternoons last month at both the Bonita and Willcox Bench stations and respective to the latter, plant development does not occur. Heat Units 94-55 °F is one of the heat unit variables provided by AZMet and the one with lower and upper temperature thresholds closest to what we’ve read are those for wine grapes.
Is this best measure of heat accumulation for modeling growth stages of wine grapes in Arizona? We don’t know. Nonetheless, it provides a relative characterization of conditions thus far this growing season. We’re looking to work on answering this question in the coming months.
Extra Notes
Given recent and current conditions, there is an above-normal potential for significant wildland fires across the western and central parts of Arizona in July. Otherwise across the state, the outlook from the National Interagency Fire Center shows potential as normal for the month.
Historically, there has been a tendency for a La Niña event to develop in the months following a strong El Niño event. With the latter now wrapped up, odds are 65 % that La Niña conditions take hold across the tropical Pacific Ocean during the July-through-September period, and 85 % that they persist during the November-through-January period.
For those of you in southeastern Arizona, including the Sonoita and Willcox AVAs, Cooperative Extension manages an email listserv in coordination with the Tucson forecast office of the National Weather Service to provide information in the days leading up to agriculturally important events, like heat waves and monsoon outbreaks. Please contact us if you'd like to sign up.
And for those of you in north-central and northeastern Arizona, including the Verde Valley AVA, Cooperative Extension also now manages an email listserv in coordination with the Flagstaff forecast office of the National Weather Service to provide similar information for this part of the state. Please contact us if you'd like to sign up.
Undergraduate students in the College of Agriculture and Life Sciences at the University of Arizona are looking for internships with businesses and companies in the viticulture and winery industries. Please contact Danielle Buhrow, Senior Academic Advisor and Graduate Program Coordinator in the Department of Agricultural and Resource Economics, for more information.
Please feel free to give us feedback on this issue of the Climate Viticulture Newsletter, suggestions on what to include more or less often, and ideas for new topics.
Did someone forward you this newsletter? Please contact us to subscribe.
Have a wonderful July!
With current and past support from:

