
< Back to Climate Viticulture Newsletter
Hello, everyone!
This is the March 2025 issue of the Climate Viticulture Newsletter – a quick look at some timely climate topics relevant to wine grape growing in Arizona.
IN THIS ISSUE
- A Recap of February Temperature and Precipitation
- The Outlook for March Temperature and Precipitation
- Vine Dormancy and the Start of the Growing Season
- Timing of Bud Break at Buhl Memorial Vineyard
- Extra Notes
A Recap of February Temperature and Precipitation
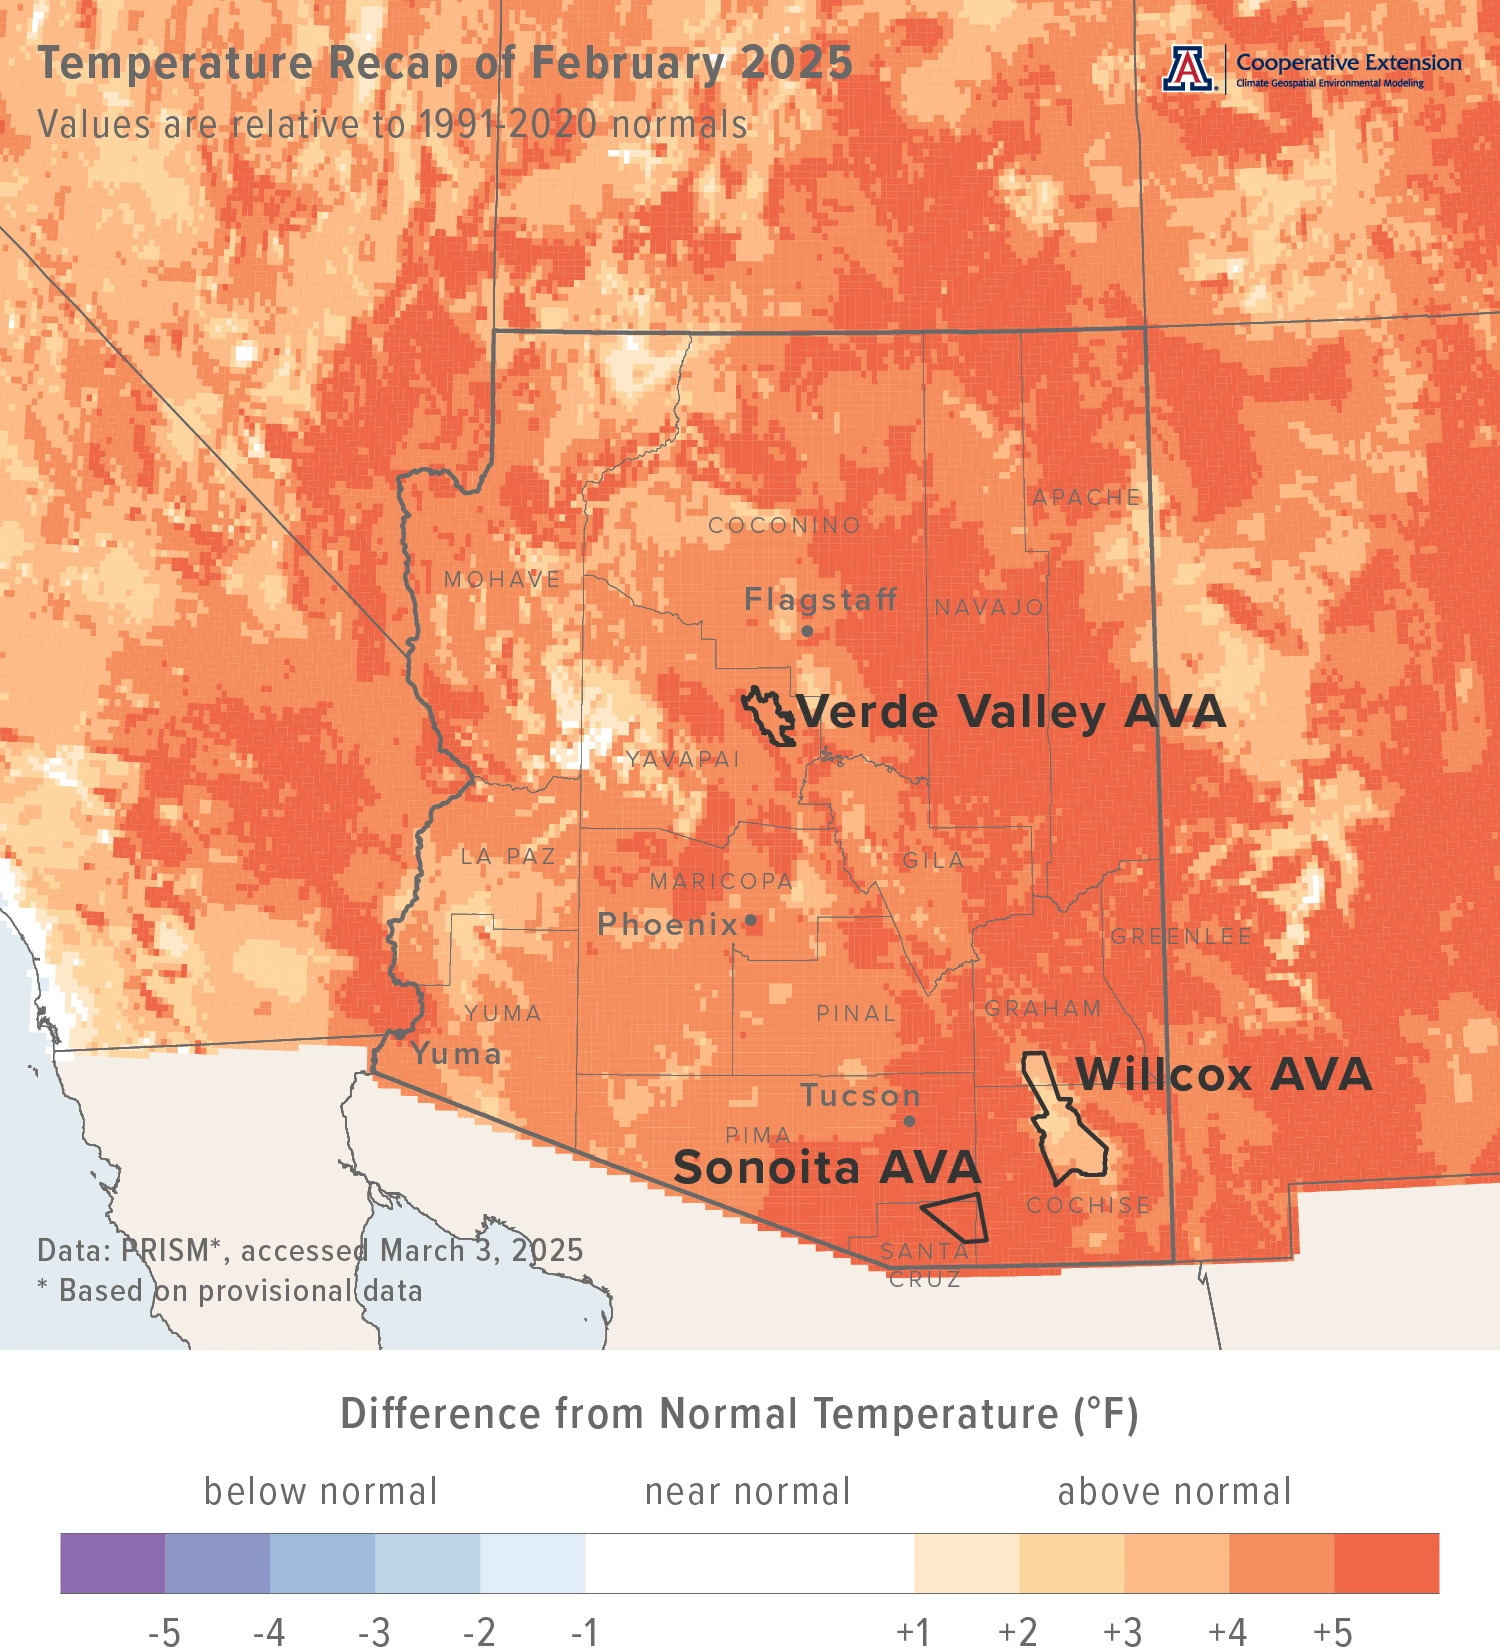
Monthly average temperatures were at least 5 °F above the 1991-2020 normal for most of the eastern half of Arizona (dark red-orange areas on map). For the western half of the state, temperatures mostly were 3 to 5 °F above normal (orange and red-orange areas on map). Monthly average temperatures in February last year were 1 to 3 °F above normal for many areas in the eastern one-third of Arizona. Much of the rest of the state saw near-normal temperatures.
Area-average maximum and minimum temperatures during February 2025 were 69.7 and 39.4 °F for the Sonoita AVA, 68.0 and 35.8 °F for the Verde Valley AVA, and 70.6 and 32.3 °F for the Willcox AVA. Respective February normals are 61.2 and 33.2 °F, 61.6 and 32.9 °F, and 63.1 and 32.7 °F.
Temperature last month ranged between 80.1 and 27.9 °F at the AZMet Bonita station and between 82.2 and 25.0 °F at the AZMet Willcox Bench station.
Jeremy Weiss
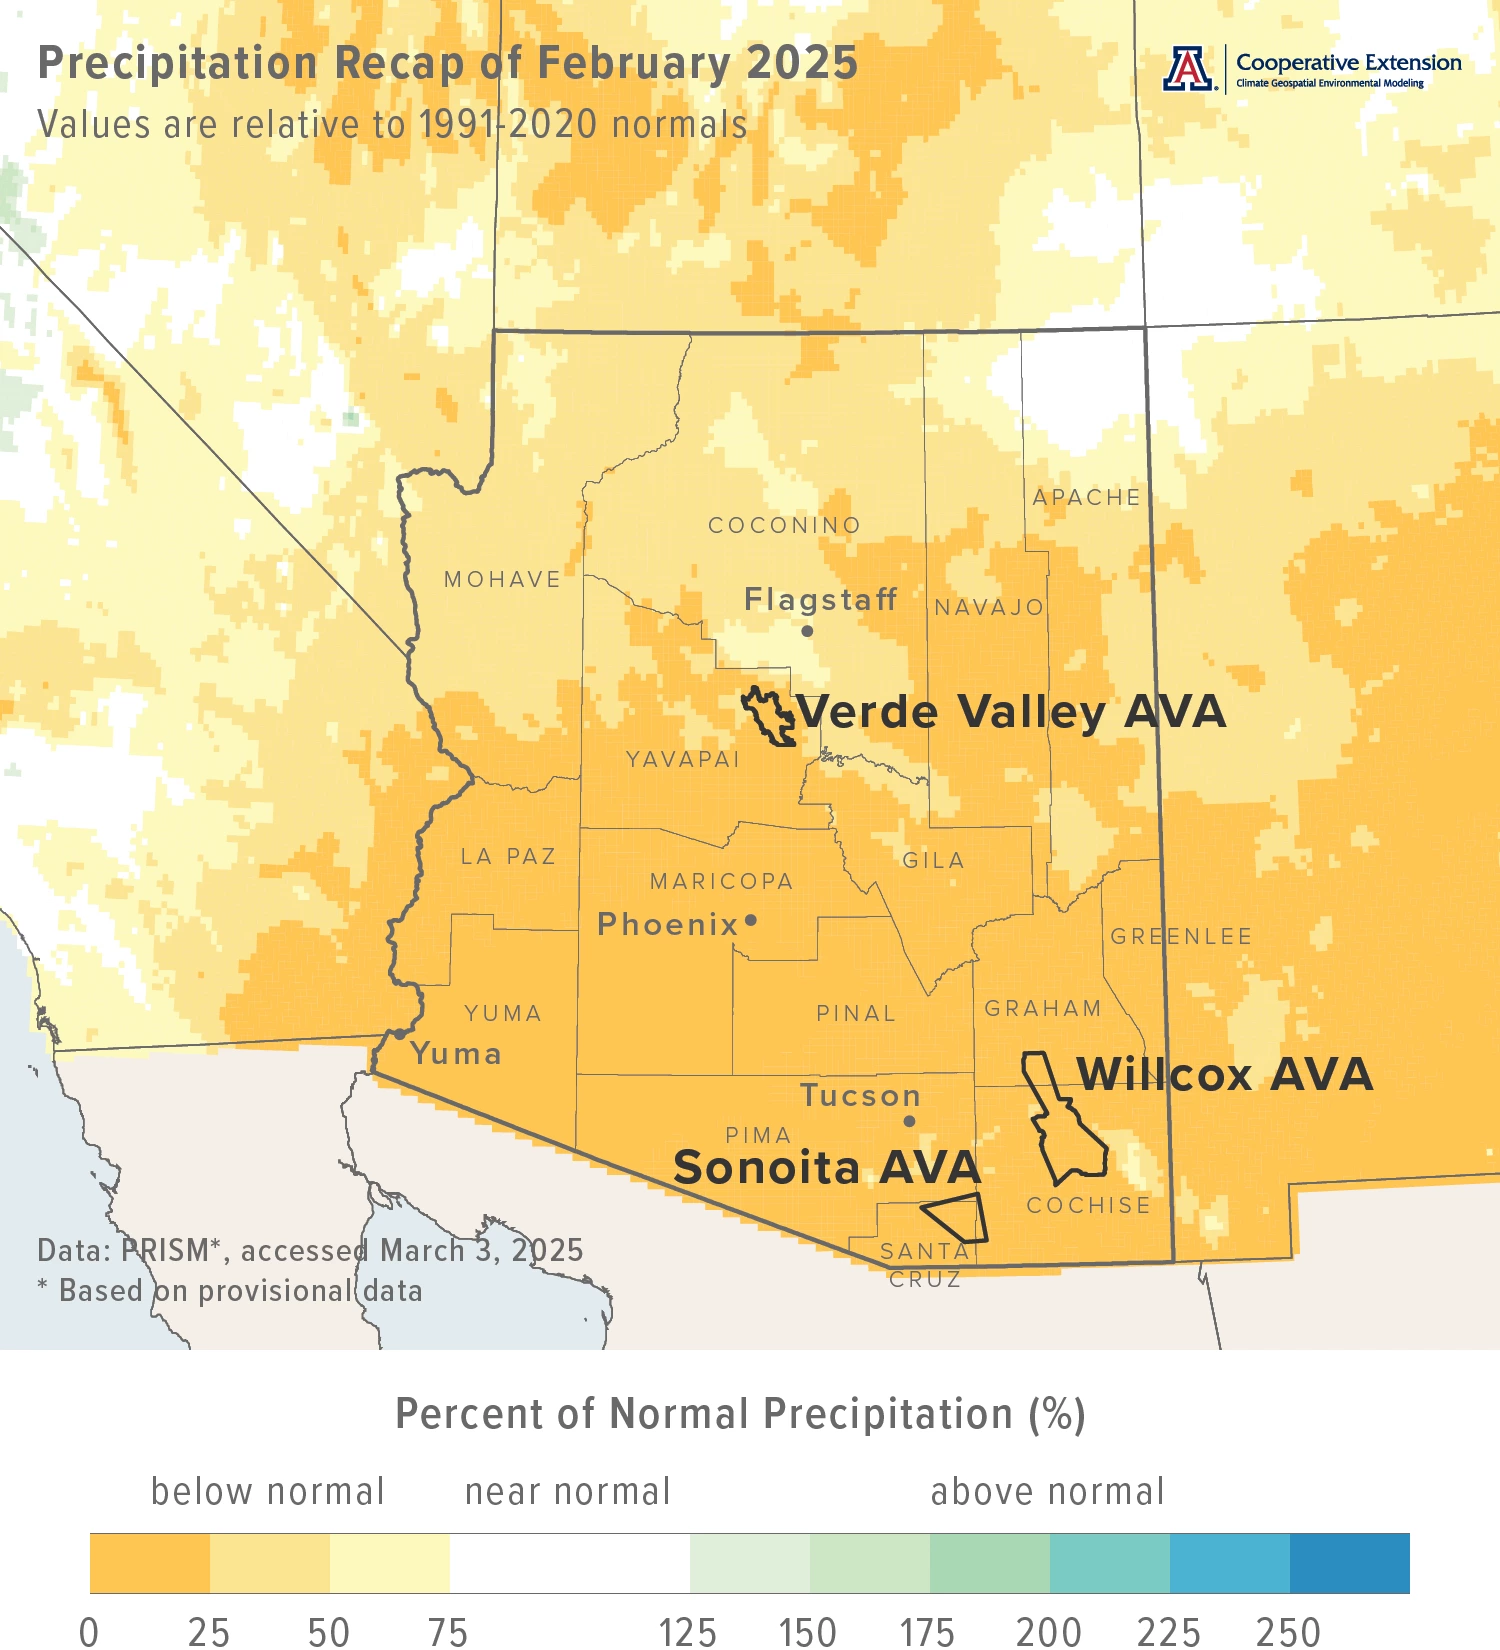
Monthly precipitation totals were less than 25 % of normal for almost all of the southern two-thirds of the state (dark yellow areas on map), including all three Arizona AVAs. For the northern one-third, totals mostly were between 25 and 50 % of normal (yellow areas on map). Precipitation during February 2024 was more than 150 % of normal for many areas across the north-central and southern parts of the state. Several locations in southeastern Arizona measured amounts more than 200 % of normal. Otherwise, totals mostly were near normal.
Area-average total precipitation in February 2025 was 0.06 inches for the Sonoita AVA, 0.25 inches for the Verde Valley AVA, and 0.13 inches for the Willcox AVA. Respective February normals are 1.12, 1.43, and 0.93 inches.
Total precipitation last month was 0.01 and 0.10 inches at the AZMet Bonita and Willcox Bench stations, respectively.
Dig further into daily weather summaries for the AZMet Bonita and Willcox Bench stations in the Willcox AVA
Learn more about PRISM climate data
Jeremy Weiss
The Outlook for March Temperature and Precipitation
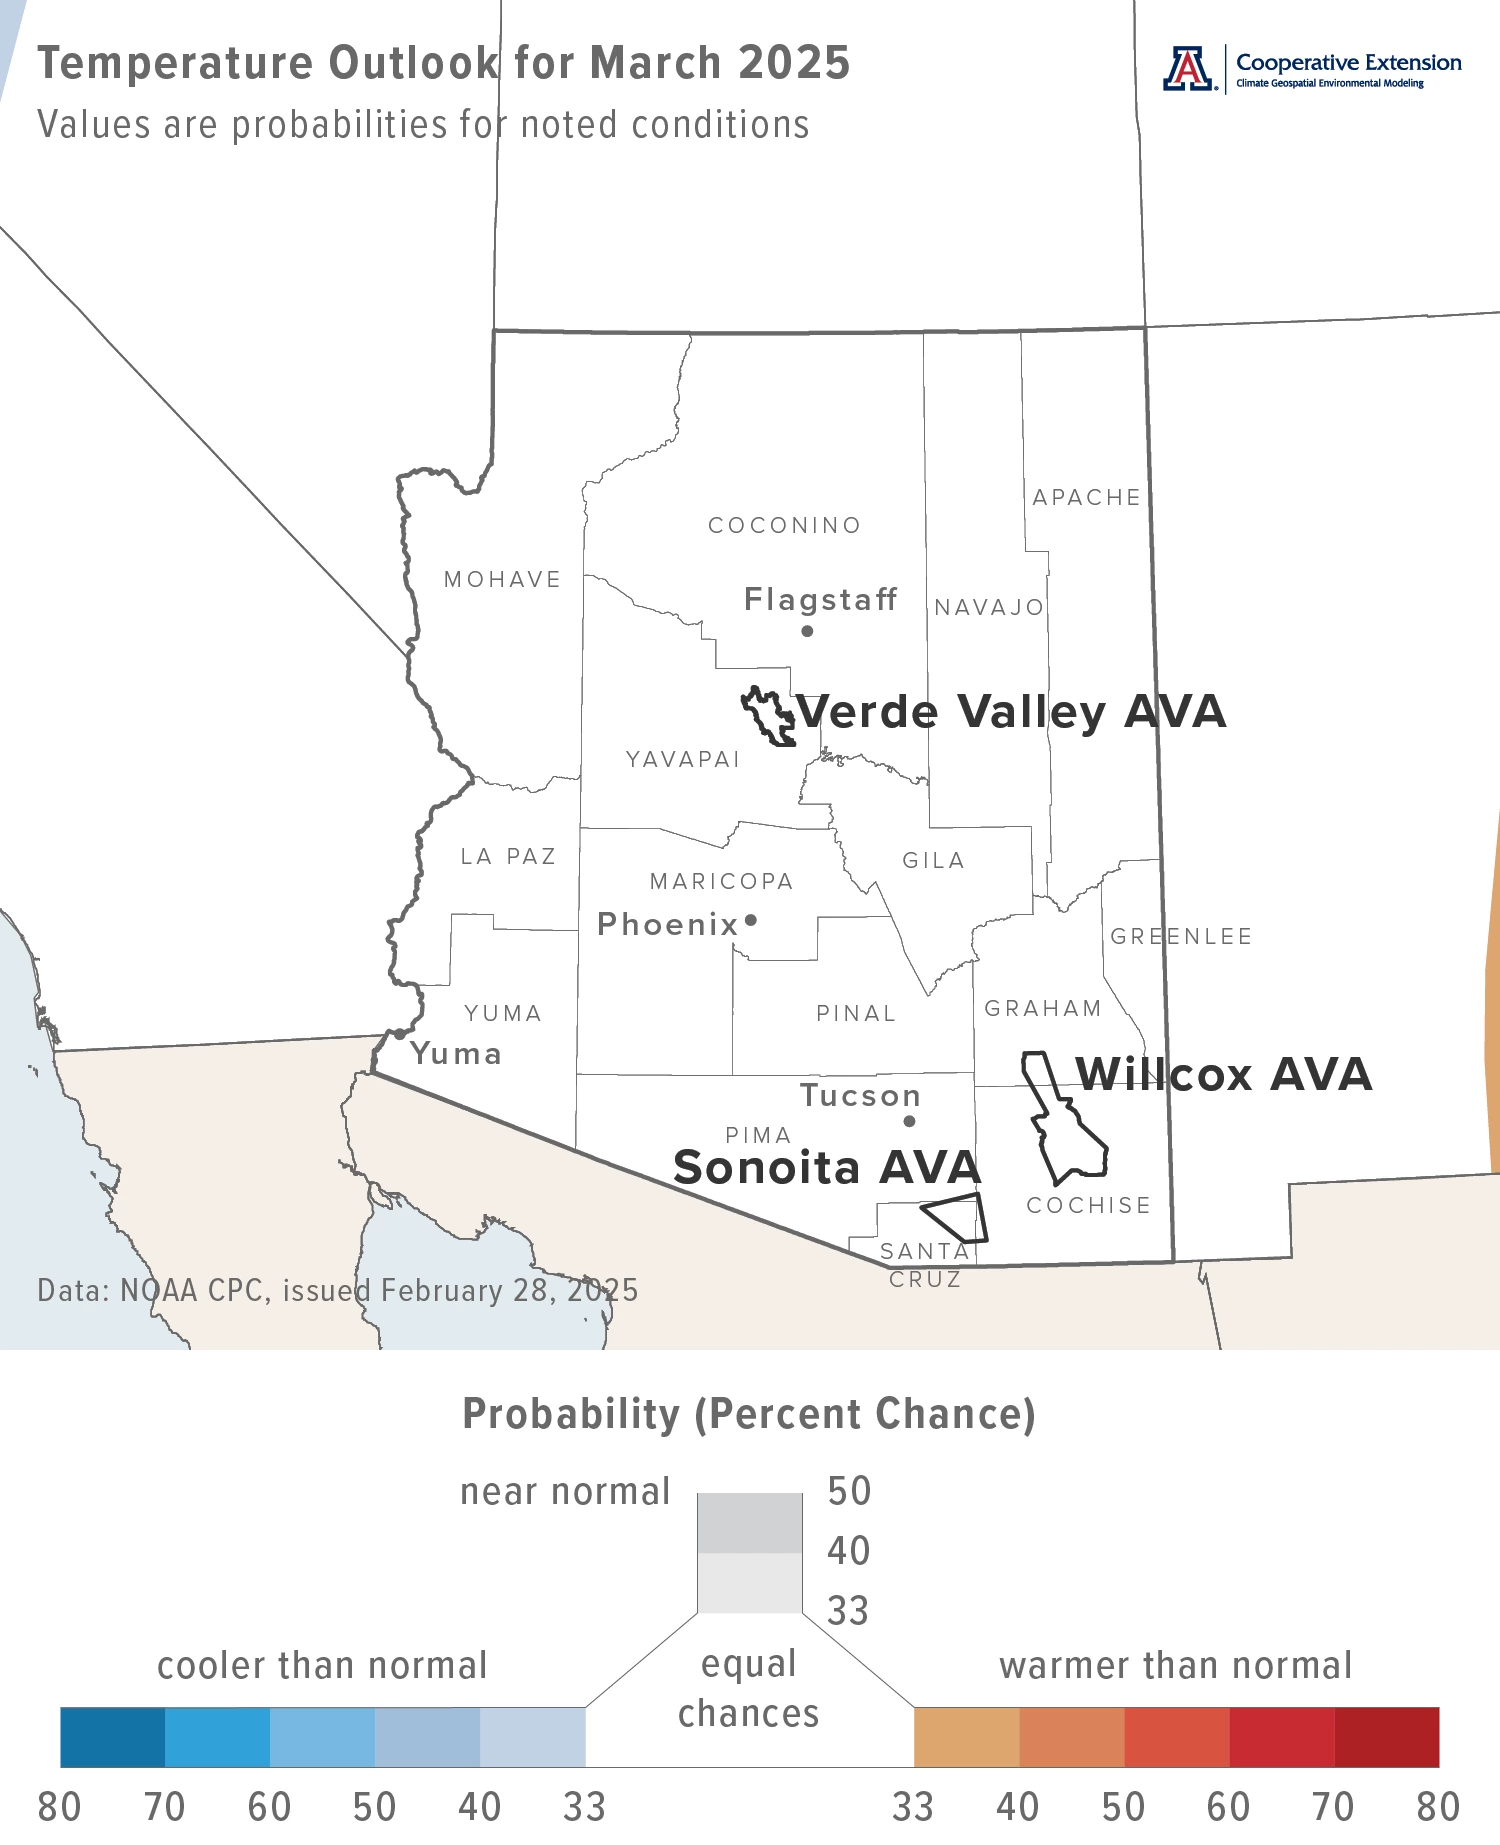
With a variable weather pattern expected over the region through at least the first half of the month, temperatures in March have equal chances for being below, near, or above the 1991-2020 normal across all of Arizona (white area on map). Monthly average temperatures in March last year were 1 to 4 °F below normal for almost all of the state.
Area-average maximum and minimum temperatures during March 2024 were 62.9 and 36.9 °F for the Sonoita AVA, 63.6 and 37.1 °F for the Verde Valley AVA, and 64.6 and 36.4 °F for the Willcox AVA. Respective March normals are 67.1 and 36.9 °F, 68.0 and 37.6 °F, and 69.4 and 37.1 °F.
Temperature in March last year ranged between 75.6 and 29.8 °F at the AZMet Bonita station and between 76.5 and 30.2 °F at the AZMet Willcox Bench station.
Jeremy Weiss
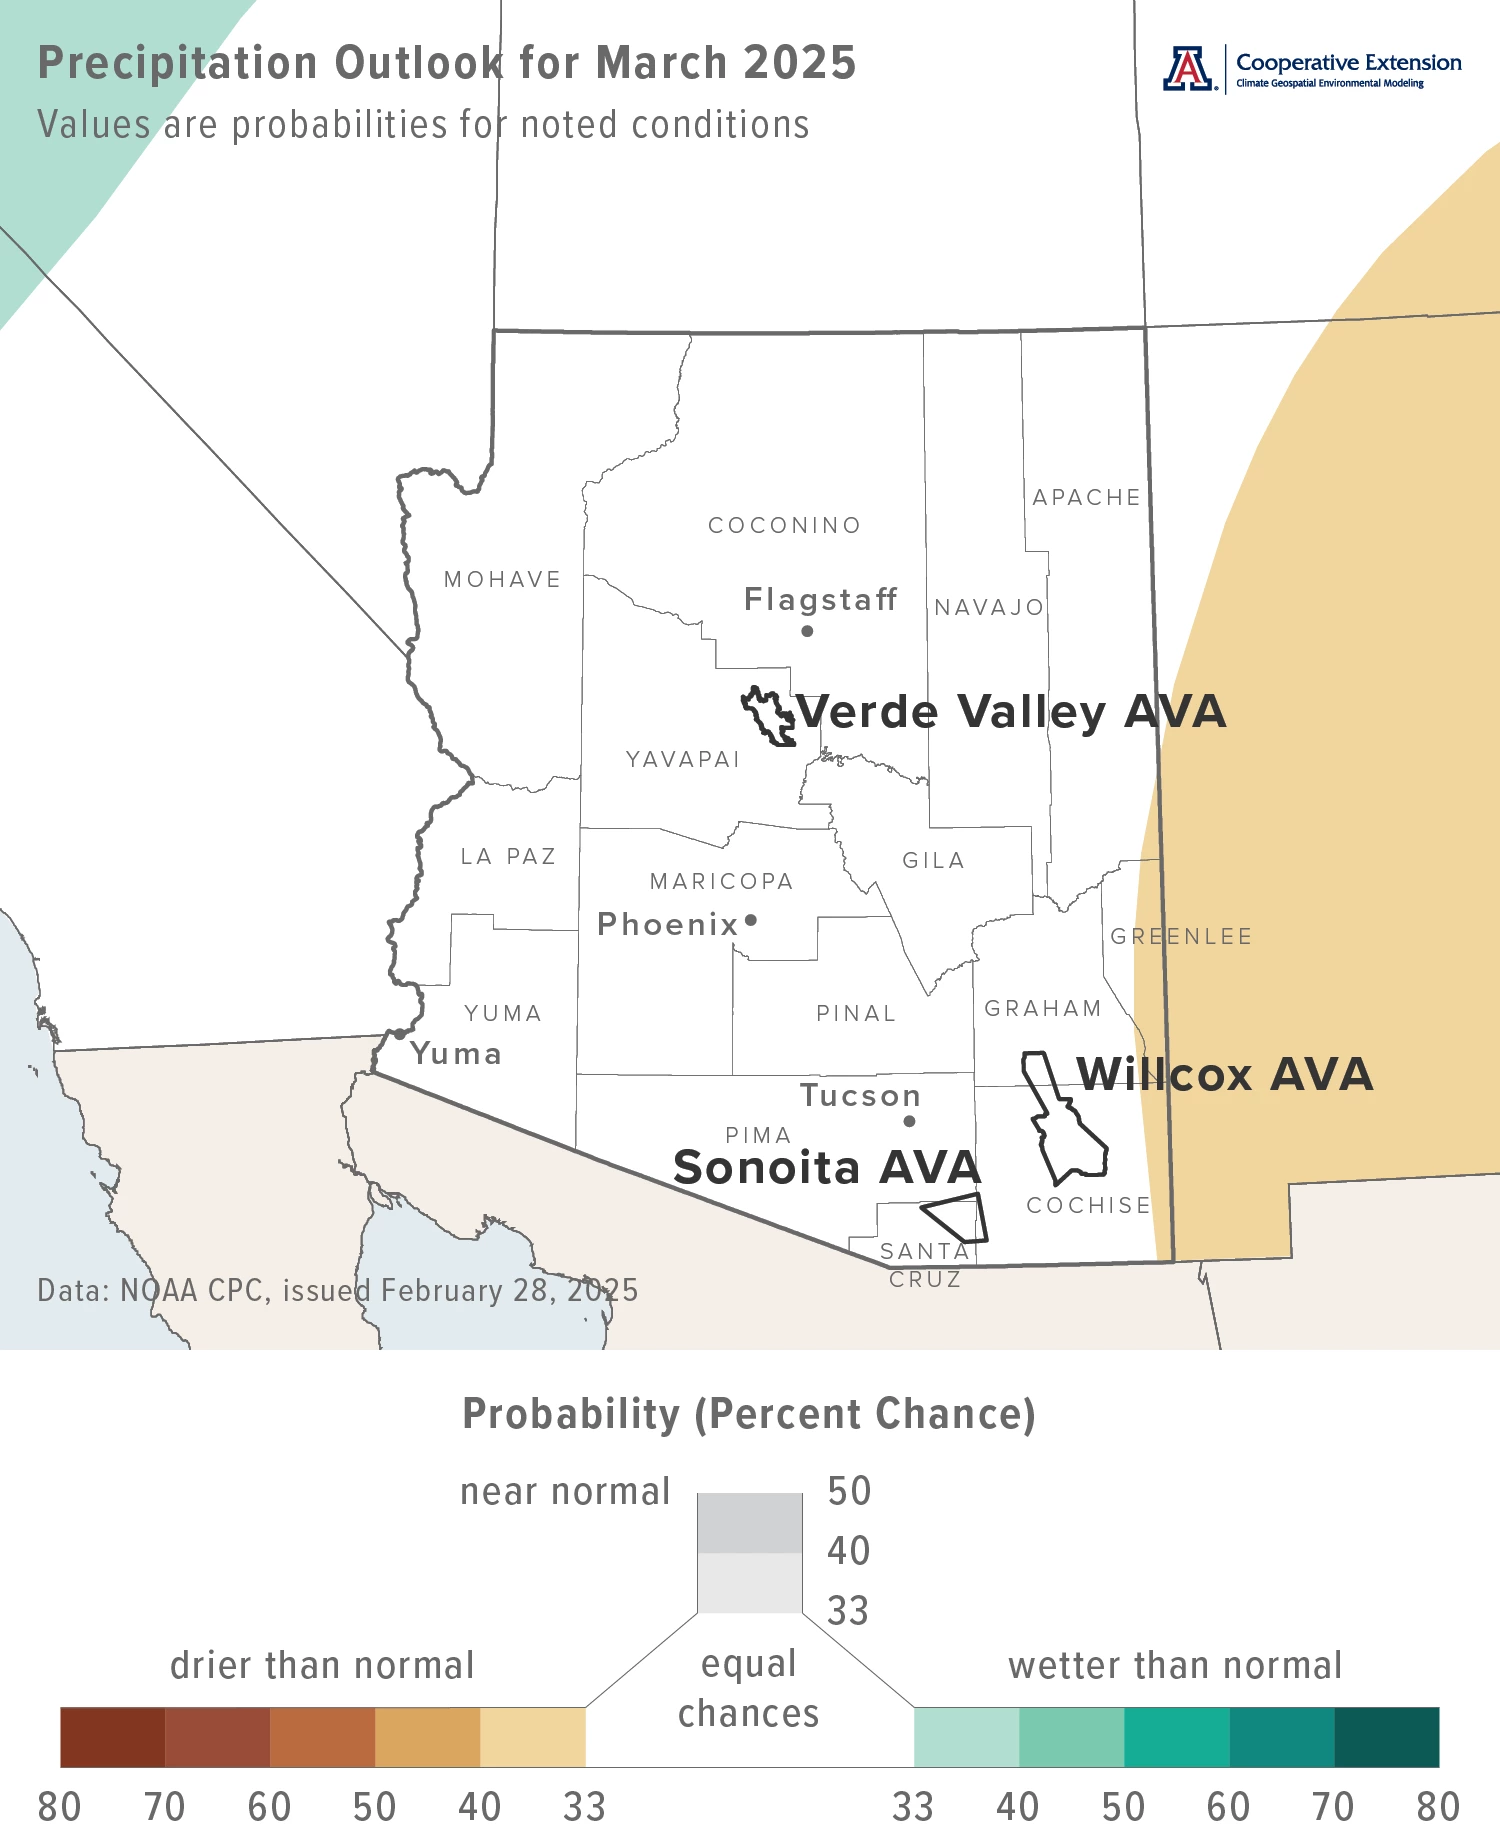
The variable weather pattern to start the month also factors into March precipitation totals having equal chances for being below, near, or above normal across all of the state (white area on map). Precipitation during March 2024 was more than 125 % of normal for much of the northern half of Arizona and some of the south-central and southeastern parts of the state. Otherwise, and except for extreme southwestern Arizona, totals were near normal.
Area-average precipitation totals in March 2024 were 0.85 inches for the Sonoita AVA, 2.09 inches for the Verde Valley AVA, and 0.85 inches for the Willcox AVA. Respective March normals are 0.97, 1.31, and 0.76 inches.
Total precipitation in March last year was 0.94 and 0.63 inches at the AZMet Bonita and Willcox Bench stations, respectively.
To stay informed of long-range temperature and precipitation possibilities beyond the coverage of a standard weather forecast, check in, too, with the six-to-ten-day outlook and eight-to-fourteen-day outlook issued daily by NOAA’s Climate Prediction Center.
Jeremy Weiss
Vine Dormancy and the Start of the Growing Season
Although it’s been about a year since we last visited this topic, you’ll likely recall that deacclimation kinetics are related to how chill accumulation, dormancy state, and temperature affect the loss of cold hardiness and timing of bud break in grape vines. It also is an explanation for why relatively lower (higher) heat accumulation is needed for vines to start the growing season during winters with relatively higher (lower) chill accumulation. In previous spring newsletter issues, we leveraged this relationship between these two measures related to vine dormancy with past ‘analog’ years to estimate when bud break might occur.
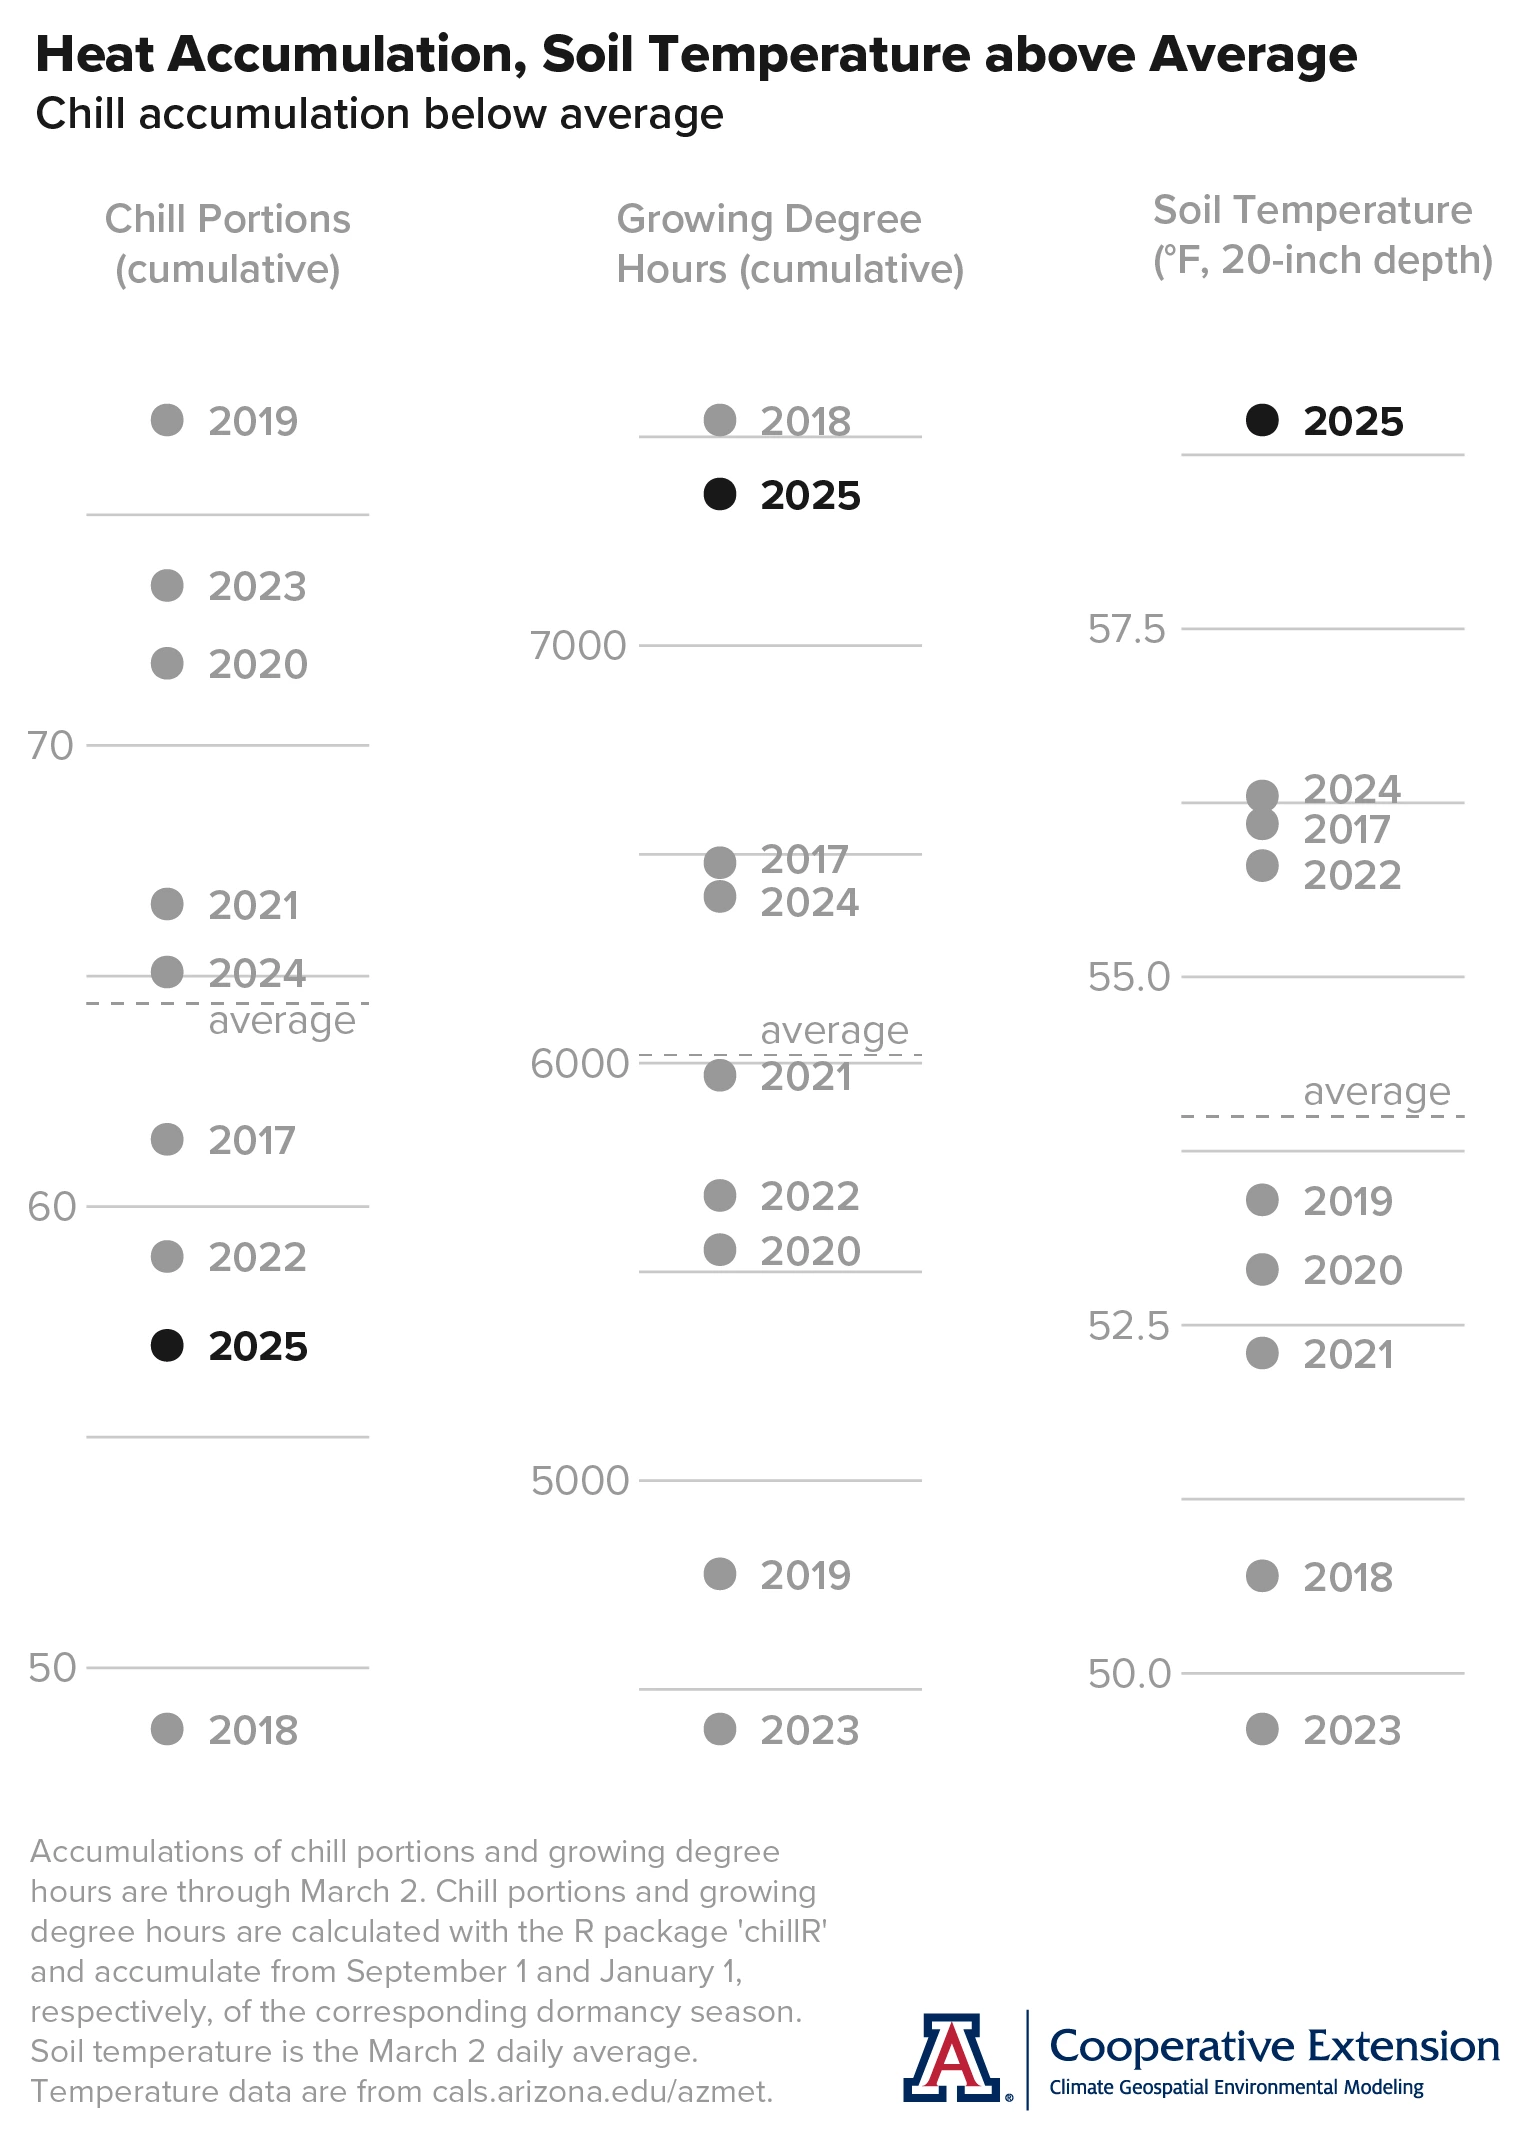
Temperature conditions at the AZMet Willcox Bench station in the south-central part of the Willcox AVA so far this dormant season have resulted in cumulative chill portion values that are below average (black dot and dashed horizontal gray line, respectively, in left graph). Since station records began, values also were below average in 2017, 2018, and 2022 (gray dots in the left graph). Cumulative growing degree hours, in contrast, are above average, close to the cumulative total in 2018 at this point in the calendar year (black and gray dots, respectively, in the middle graph). Values in 2017 and 2024 also were above average. As soil temperature sometimes is part of the discussion about the start of the growing season, we show those data, as well, in the graph on the right. Values this year are above average and the warmest in station history. Values in 2017, 2022, and 2024 also were above average.
As we saw in the issue last month, heat accumulation begins to increase rapidly during March, but also can vary relatively more. This, coupled with an outlook shaped by variable conditions to start the month, makes it more challenging to leverage an ‘analog’ approach at this point. Nonetheless, as current chill and heat accumulation are in the company of that during 2017 and 2018, years with relatively early bud break in this part of the state to our knowledge, a relatively early bud break in 2025 is not out the question.
Jeremy Weiss
Timing of Bud Break at Buhl Memorial Vineyard
The initial phenology data set we’re analyzing for our new project about the effects of Arizona climate on the timing of wine grape growth stages is from Buhl Memorial Vineyard near the AZMet Willcox Bench station and in the south-central Willcox AVA. It has dates for bud break, flowering, and veraison from 2016 through 2024, with dates from 2025 coming soon. As the growing season is close to kicking off, we thought it timely to take a closer look at how bud break dates over the past nine years there vary among the varieties.
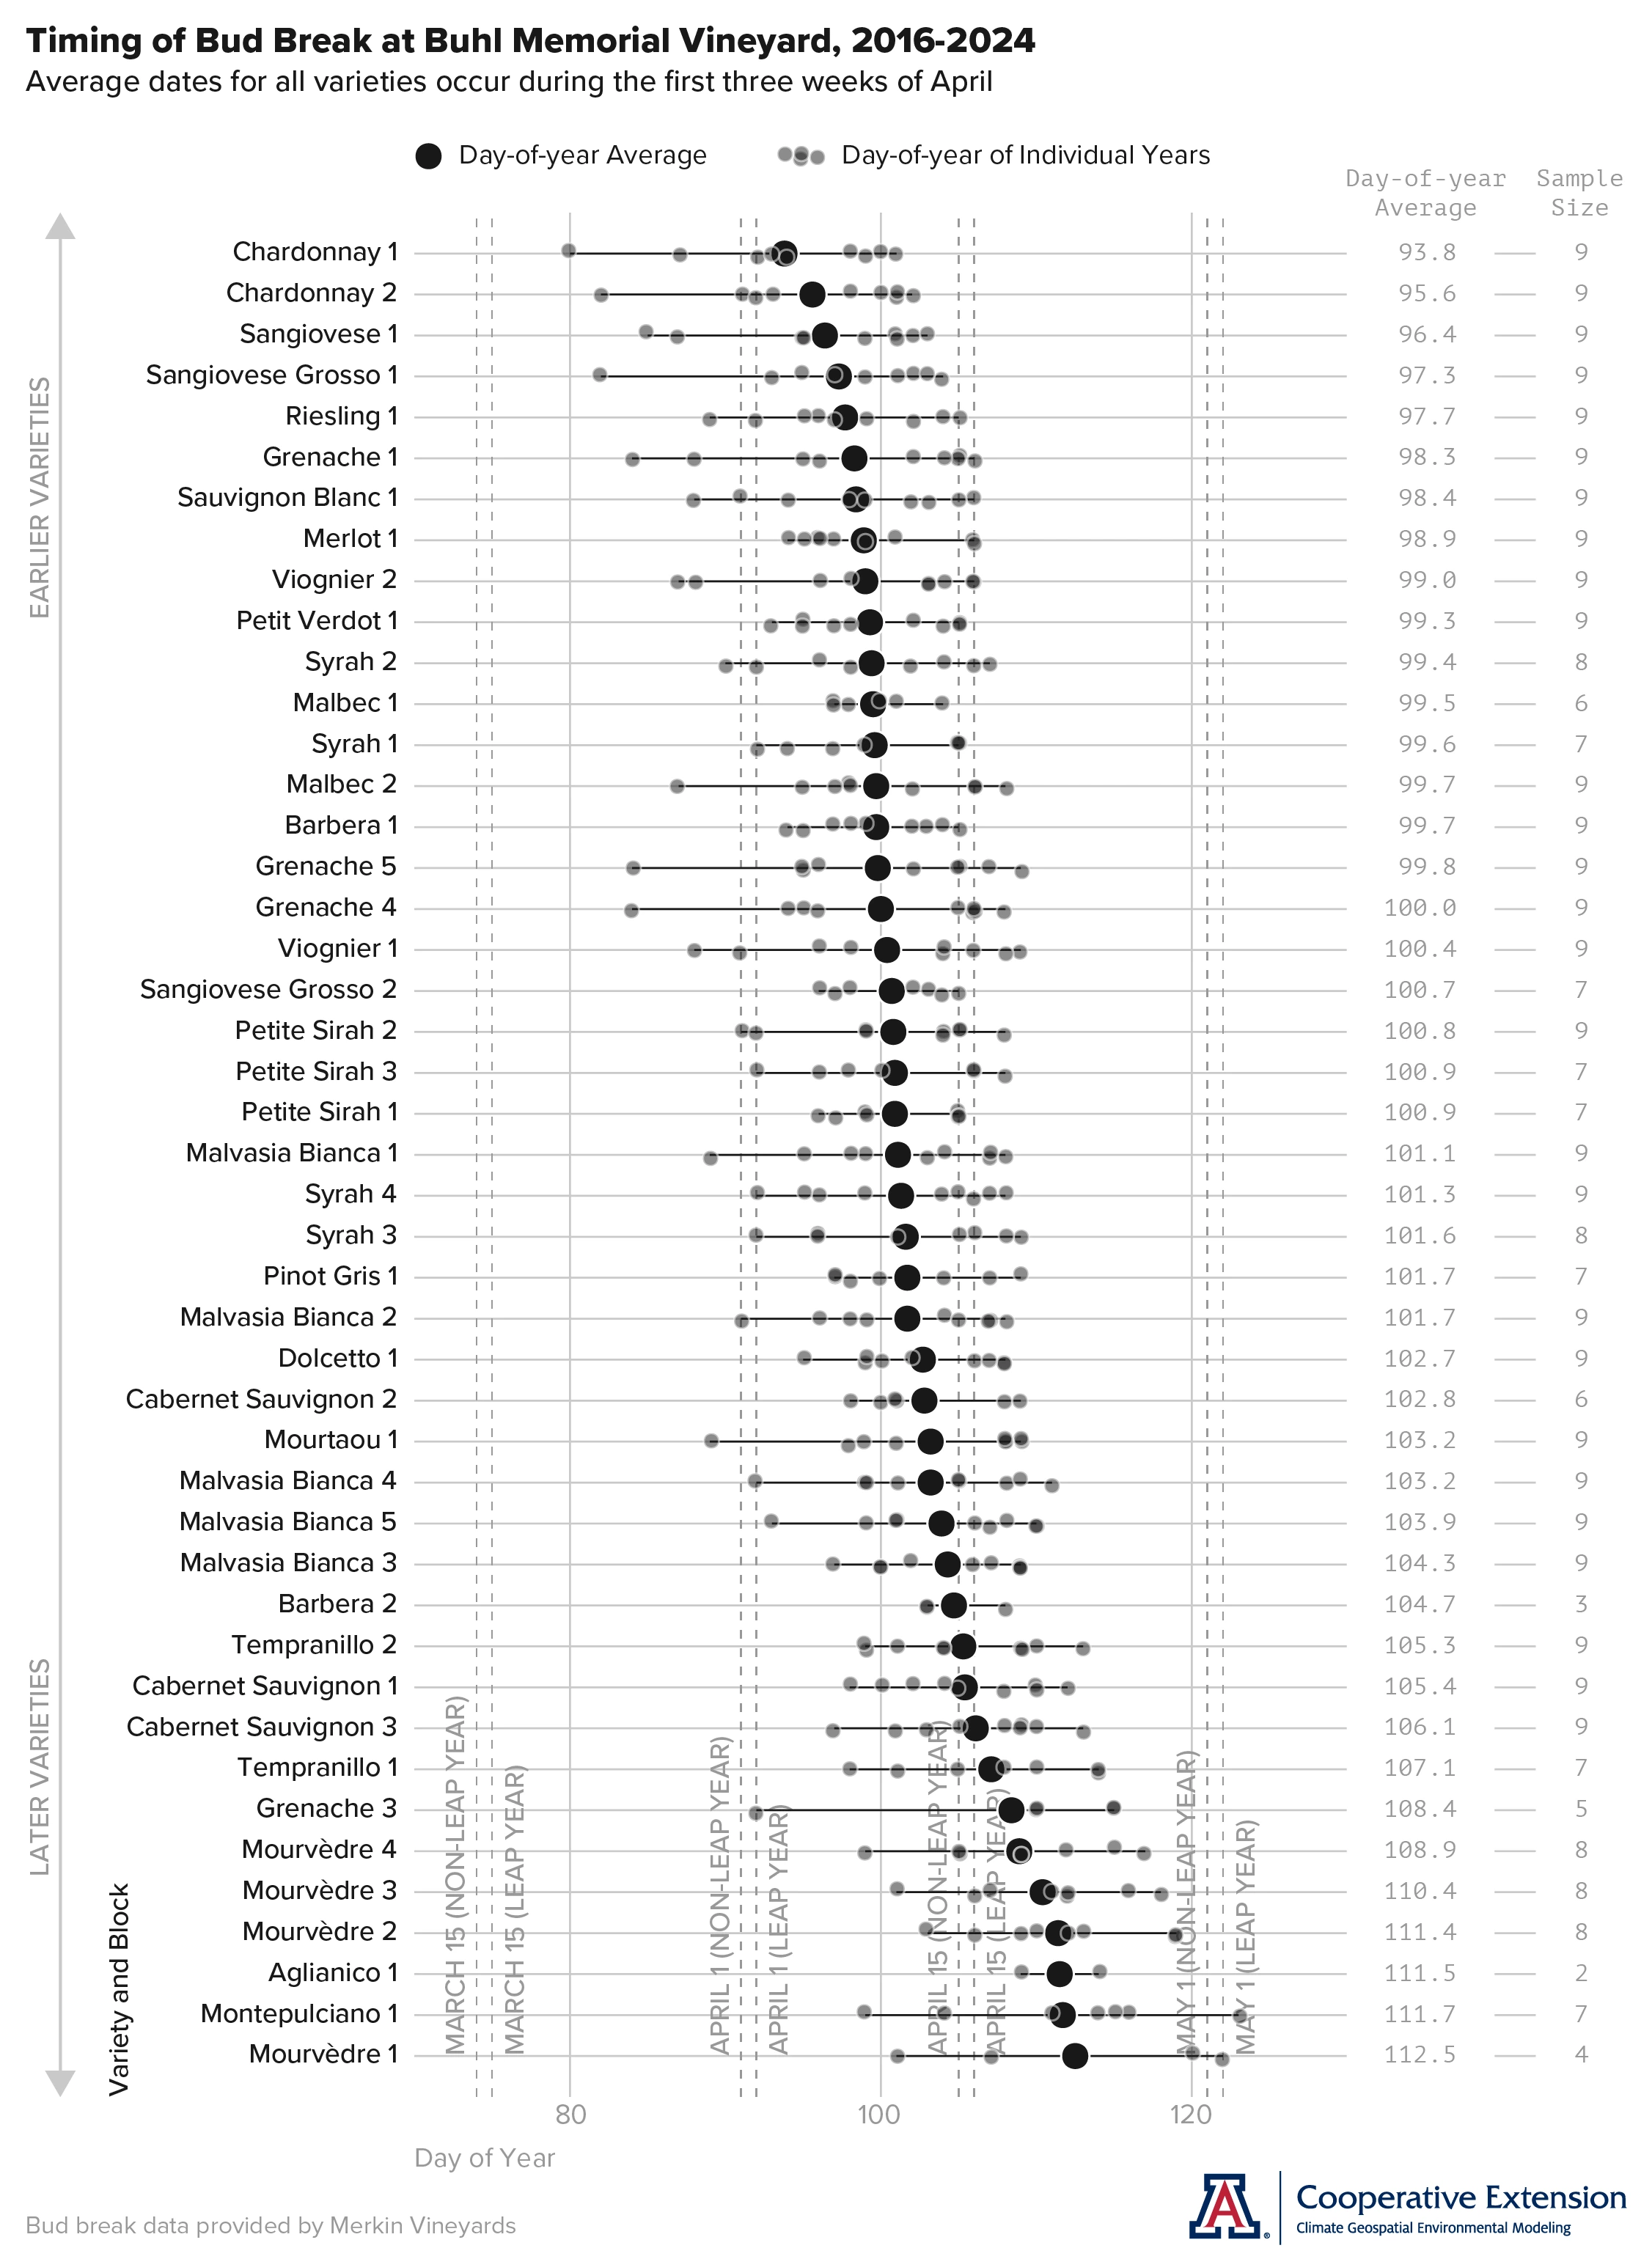
Before we get to describing the various parts of the infographic, a few main points. Average bud-break dates for all varieties occur during the first three weeks of April. The earliest bud break dates occurred during the latter half of March, but only for half of the 22 different varieties in the data set. The latest bud break dates occurred at the beginning of May, but only for a few varieties. Although sample sizes are relatively small, sorting by variety and block does begin to show which varieties may be considered ‘early’ and which ‘late’.
Now, a description of the various parts of the infographic, which might help one in adding to the list of take-away points from these data. Varieties and their respective blocks are along the vertical axis of the graph, ordered from top to bottom by increasing average day of year of bud break, that is, from earlier to later. Direction of ordering also appears along the far left of the infographic, as the gray line with arrow end points. Day-of-year averages for each variety and block are the larger black points in the graph, and day of year of bud break for individual years are the smaller semi-transparent points. Black lines underlying these points extend from the earliest day of year of bud break to the latest for each variety and block, representing the range of bud-break dates. Day-of-year values are along the horizontal axis of the graph. Conversion of these values to corresponding month and day appear as dashed gray vertical lines, with text near the bottom of the graph. Day-of-year average values for each variety and block are the left column of numbers at the right of the graph, with corresponding sample sizes in the right column.
If you have growth-stage dates for different varieties in your vineyard that you’d like to add to this analysis and the overall project, please let us know.
Jeremy Weiss
Extra Notes
Given recent and current conditions, there is an above-normal potential for significant wildland fires across the southeastern part of Arizona in March. Otherwise across the state, the outlook from the National Interagency Fire Center shows potential as normal for the month.
The continuing weak La Niña event has a 41 % chance of transition to ENSO-neutral conditions during the February-through-April 2025 period, and a 66 % chance of transition to ENSO-neutral conditions during the March-through-May 2025 period.
For those of you in southeastern Arizona, including the Sonoita and Willcox AVAs, Cooperative Extension manages an email listserv in coordination with the Tucson forecast office of the National Weather Service to provide information in the days leading up to agriculturally important events, like spring freezes and high-wind days. Please contact us if you'd like to sign up.
And for those of you in north-central and northeastern Arizona, including the Verde Valley AVA, Cooperative Extension also now manages an email listserv in coordination with the Flagstaff forecast office of the National Weather Service to provide similar information for this part of the state. Please contact us if you'd like to sign up.
Undergraduate students in the College of Agriculture and Life Sciences at the University of Arizona are looking for internships with businesses and companies in the viticulture and winery industries. Please contact Danielle Buhrow, Senior Academic Advisor and Graduate Program Coordinator in the Department of Agricultural and Resource Economics, for more information.
Please feel free to give us feedback on this issue of the Climate Viticulture Newsletter, suggestions on what to include more or less often, and ideas for new topics.
Did someone forward you this newsletter? Please contact us to subscribe.
Have a wonderful March!
With current and past support from: