< Back to Climate Viticulture Newsletter
Hello, everyone!
This is the November 2023 issue of the Climate Viticulture Newsletter – a quick look at some timely climate topics relevant to wine grape growing in Arizona.
IN THIS ISSUE
- A Recap of October Temperature and Precipitation
- The Outlook for November Temperature and Precipitation
- A Review of 2023 Ripening Conditions in Arizona AVAs
- Extra Notes
A Recap of October Temperature and Precipitation
Despite a cool end to the month, monthly average temperatures were 1 to 4 °F above the 1991-2020 normal for much of Arizona (light orange and orange areas on map), including all three Arizona AVAs. Several locations in the central and southeastern parts of the state recorded such values more than 4 °F above normal (darker orange areas on map). For reference, monthly temperatures in October last year were 1 to 4 °F below normal for much of the southeastern and east-central parts of Arizona, and near normal for much of the rest of the state.
Area-average maximum and minimum temperatures during October 2023 were 81.2 and 50.9 °F for the Sonoita AVA, 83.1 and 49.0 °F for the Verde Valley AVA, and 83.7 and 49.5 °F for the Willcox AVA. Respective October normals are 77.3 and 47.5 °F, 80.2 and 47.0 °F, and 79.9 and 46.8 °F.

Jeremy Weiss
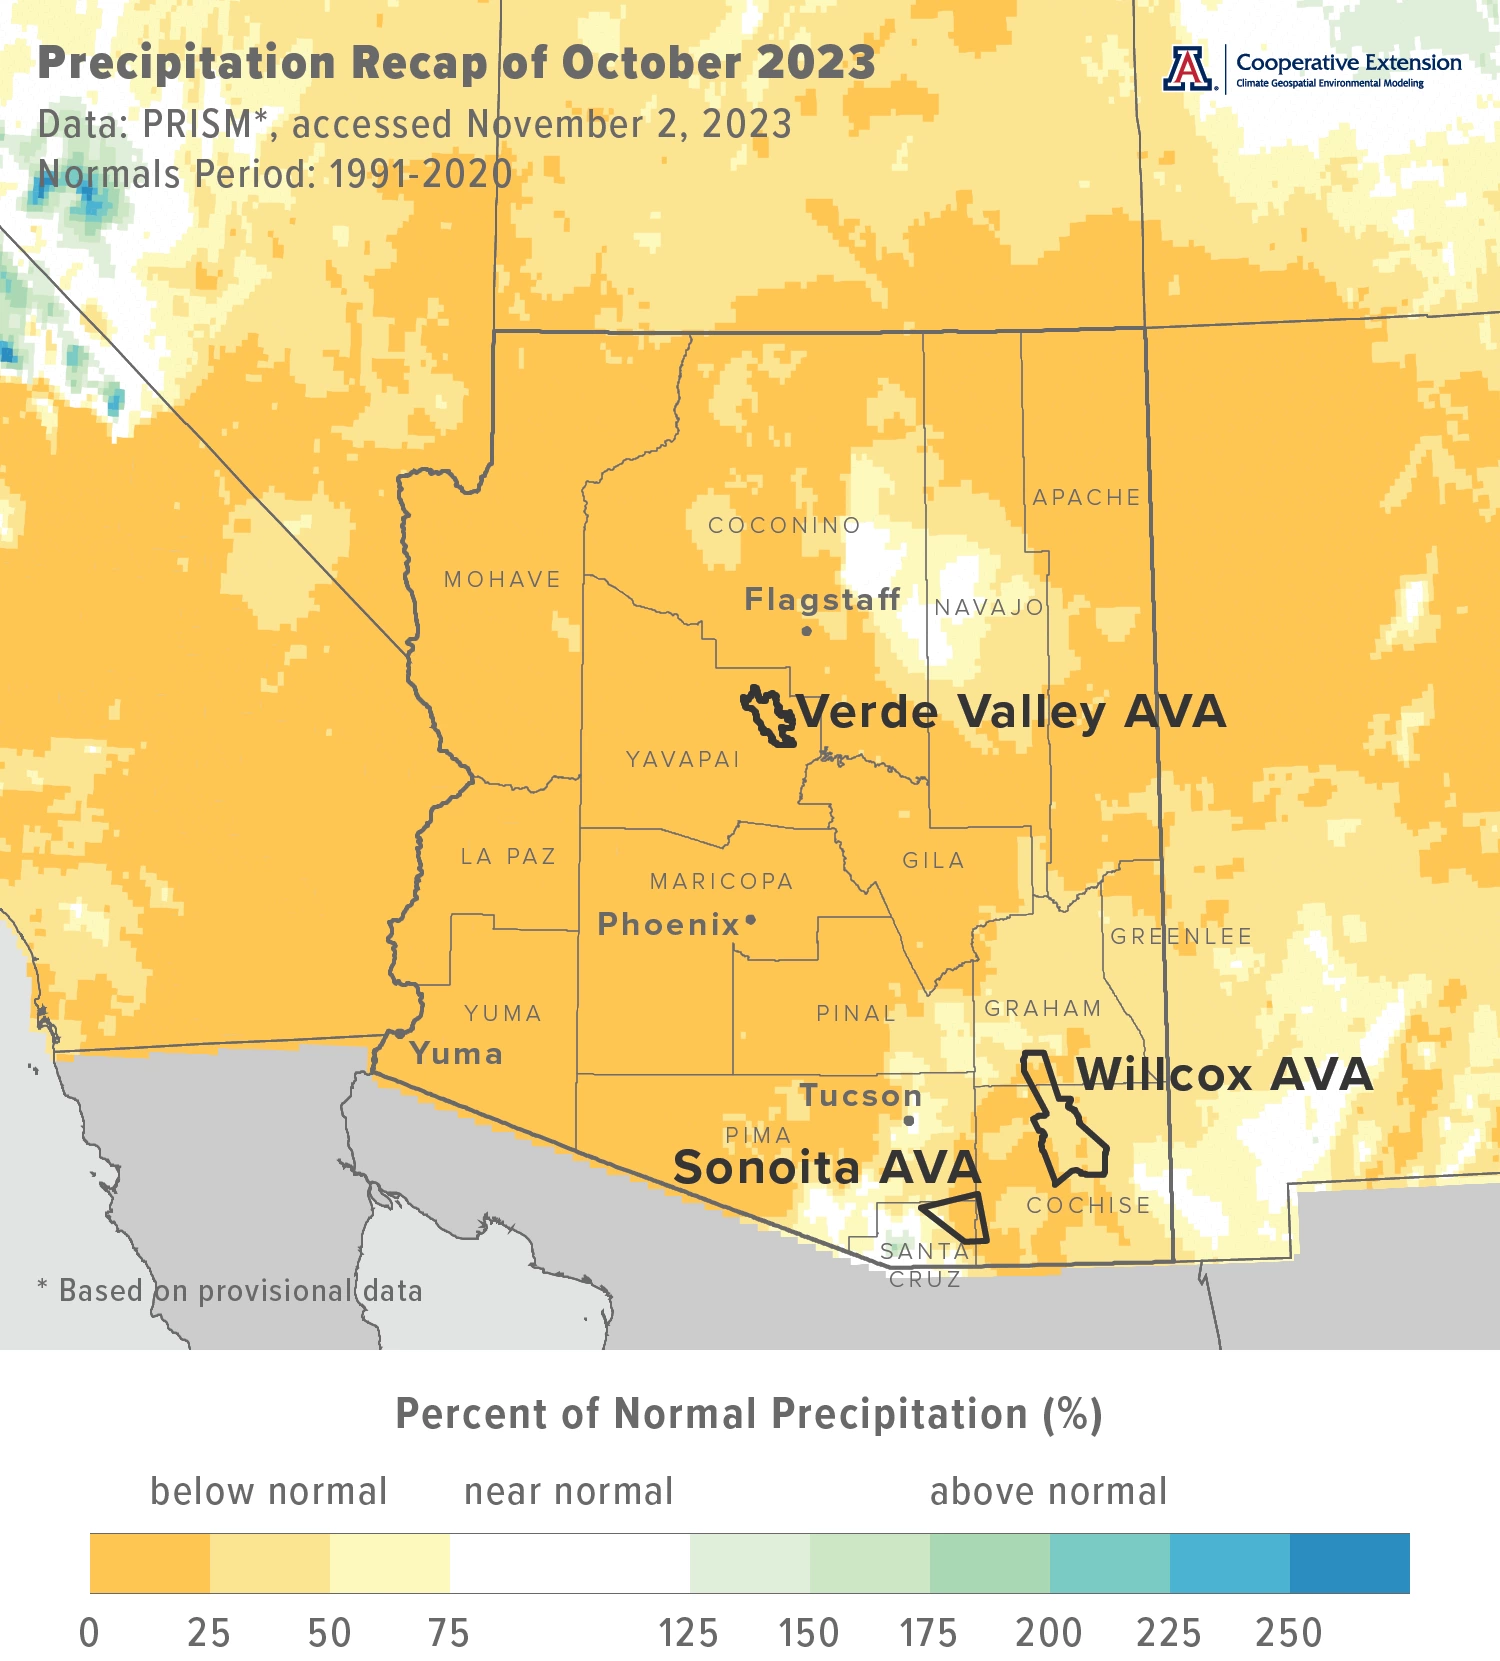
Monthly precipitation totals were less than 25 % of normal for most of the state (dark yellow areas on map), including parts of the Willcox AVA, much of the Sonoita AVA, and all of the Verde Valley AVA. Only some locations in northeastern and southeastern Arizona recorded greater amounts, although many of those were only between 25 and 75 % of normal (light yellow and yellow areas on map). Precipitation during October 2022 was more than 125 % of normal for many parts of the state, with only locations in south-central and extreme northwestern Arizona recording below-normal amounts.
Area-average total precipitation in October 2023 was 0.25 inches for the Sonoita AVA, 0.04 inches for the Verde Valley AVA, and 0.20 inches for the Willcox AVA. Respective October normals are 0.95, 1.05, and 0.76 inches.
The continuation of relatively warm and dry conditions last month drove total reference evapotranspiration values for October to 4.92 and 5.09 inches for the AZMet Bonita and Willcox Bench stations, respectively, in the Willcox AVA. Those values bring respective growing season totals to 49.20 and 52.22 inches. Total precipitation from April through October, in contrast, is 1.12 at Bonita and 1.84 inches at Willcox Bench.
Dig into daily weather summaries from 2023 for the AZMet Bonita and Willcox Bench stations in the Willcox AVA
Learn more about PRISM climate data
Jeremy Weiss
The Outlook for November Temperature and Precipitation
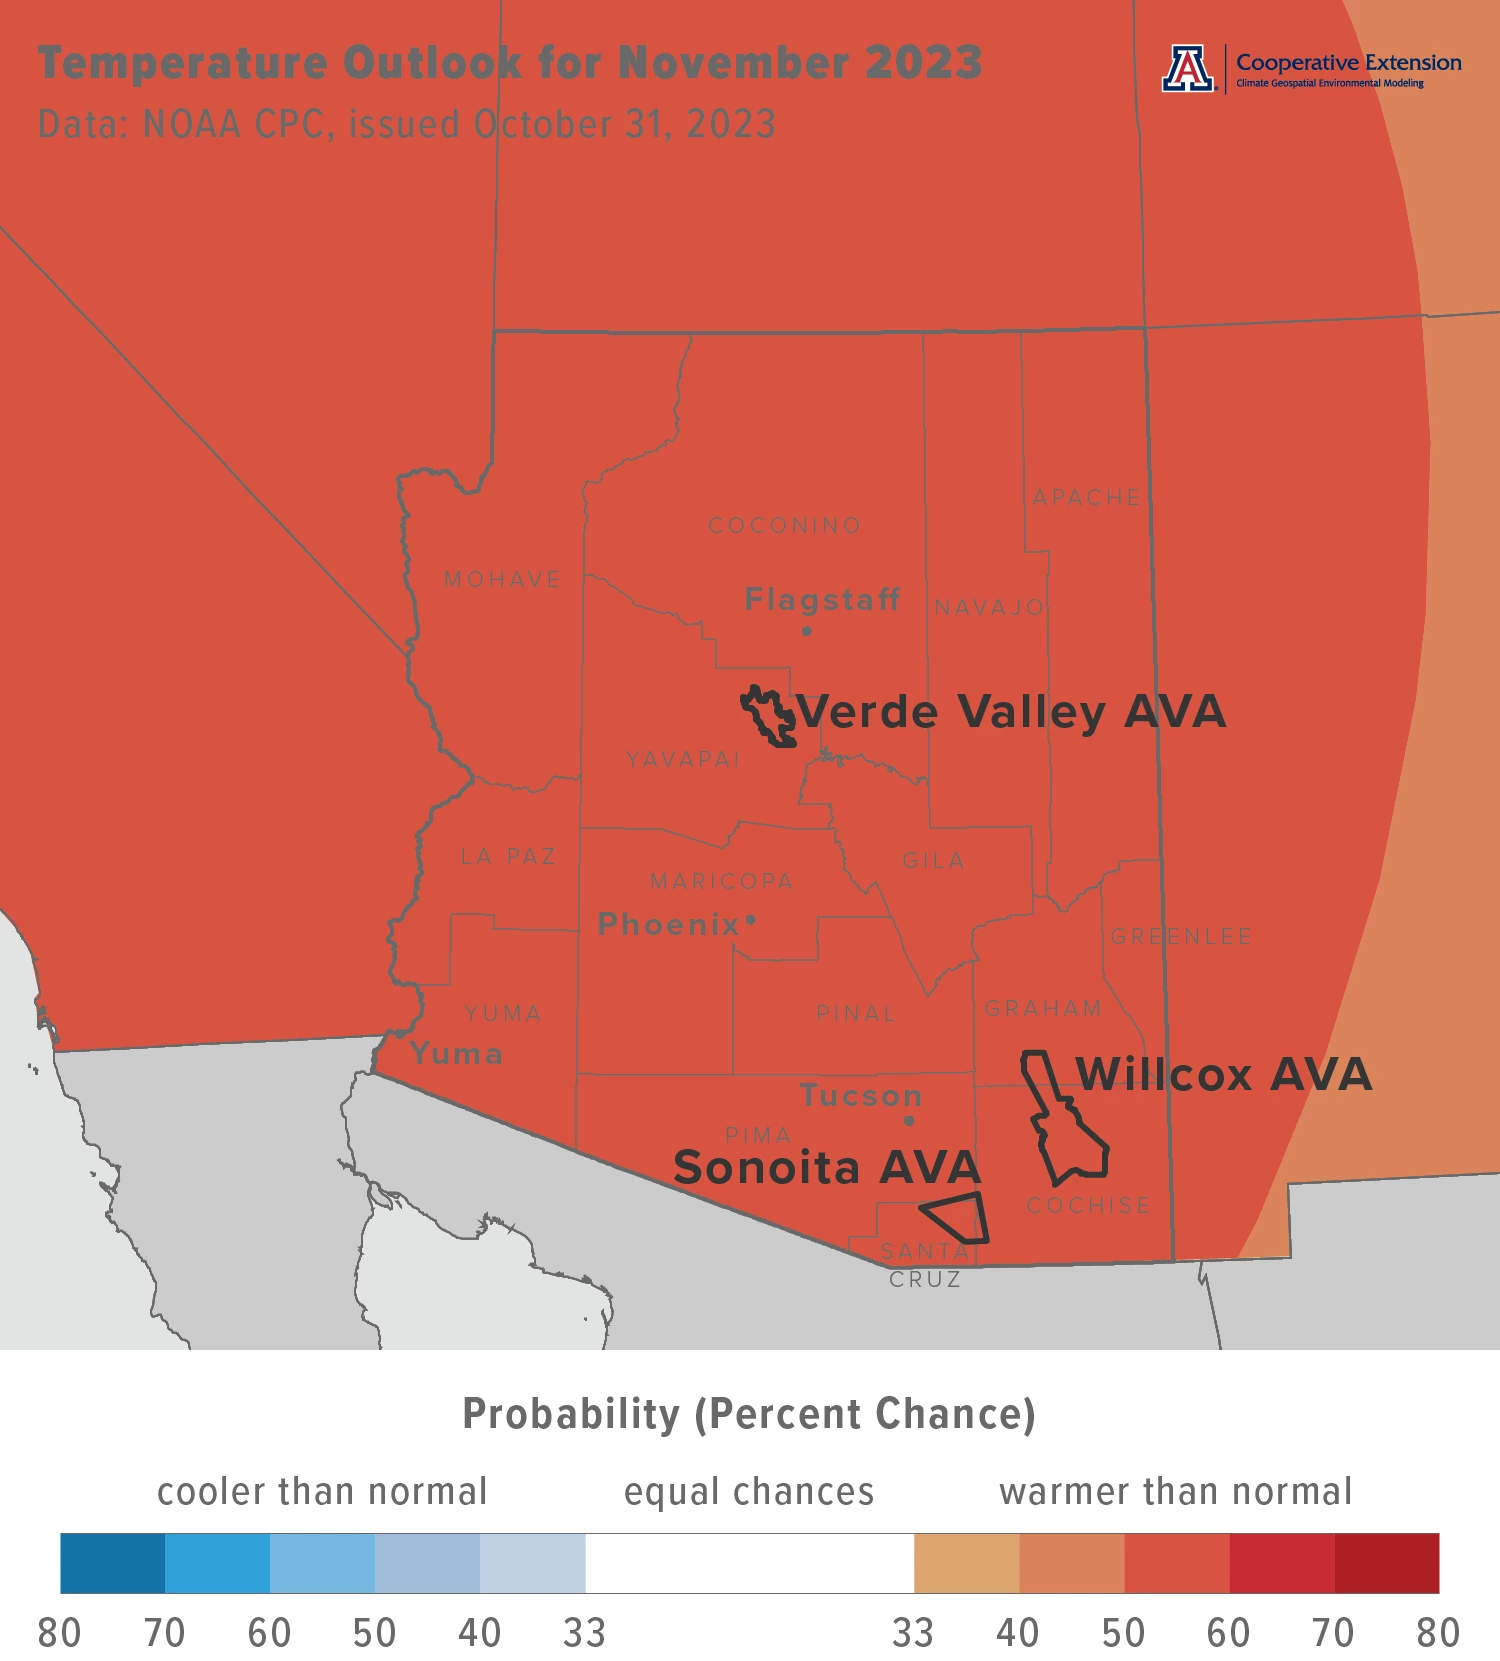
Temperatures over the course of this month have a moderate increase in chances for being above the 1991-2020 normal across all of Arizona (burnt orange area on map). Monthly temperatures in November last year were at least 3 to 5 °F below normal for almost the entire state.
Area-average maximum and minimum temperatures during November 2022 were 62.5 and 33.1 °F for the Sonoita AVA, 62.7 and 31.0 °F for the Verde Valley AVA, and 64.9 and 31.1 °F for the Willcox AVA. Respective November normals are 67.2 and 38.2 °F, 67.5 and 36.6 °F, and 68.6 and 36.7 °F.
Jeremy Weiss
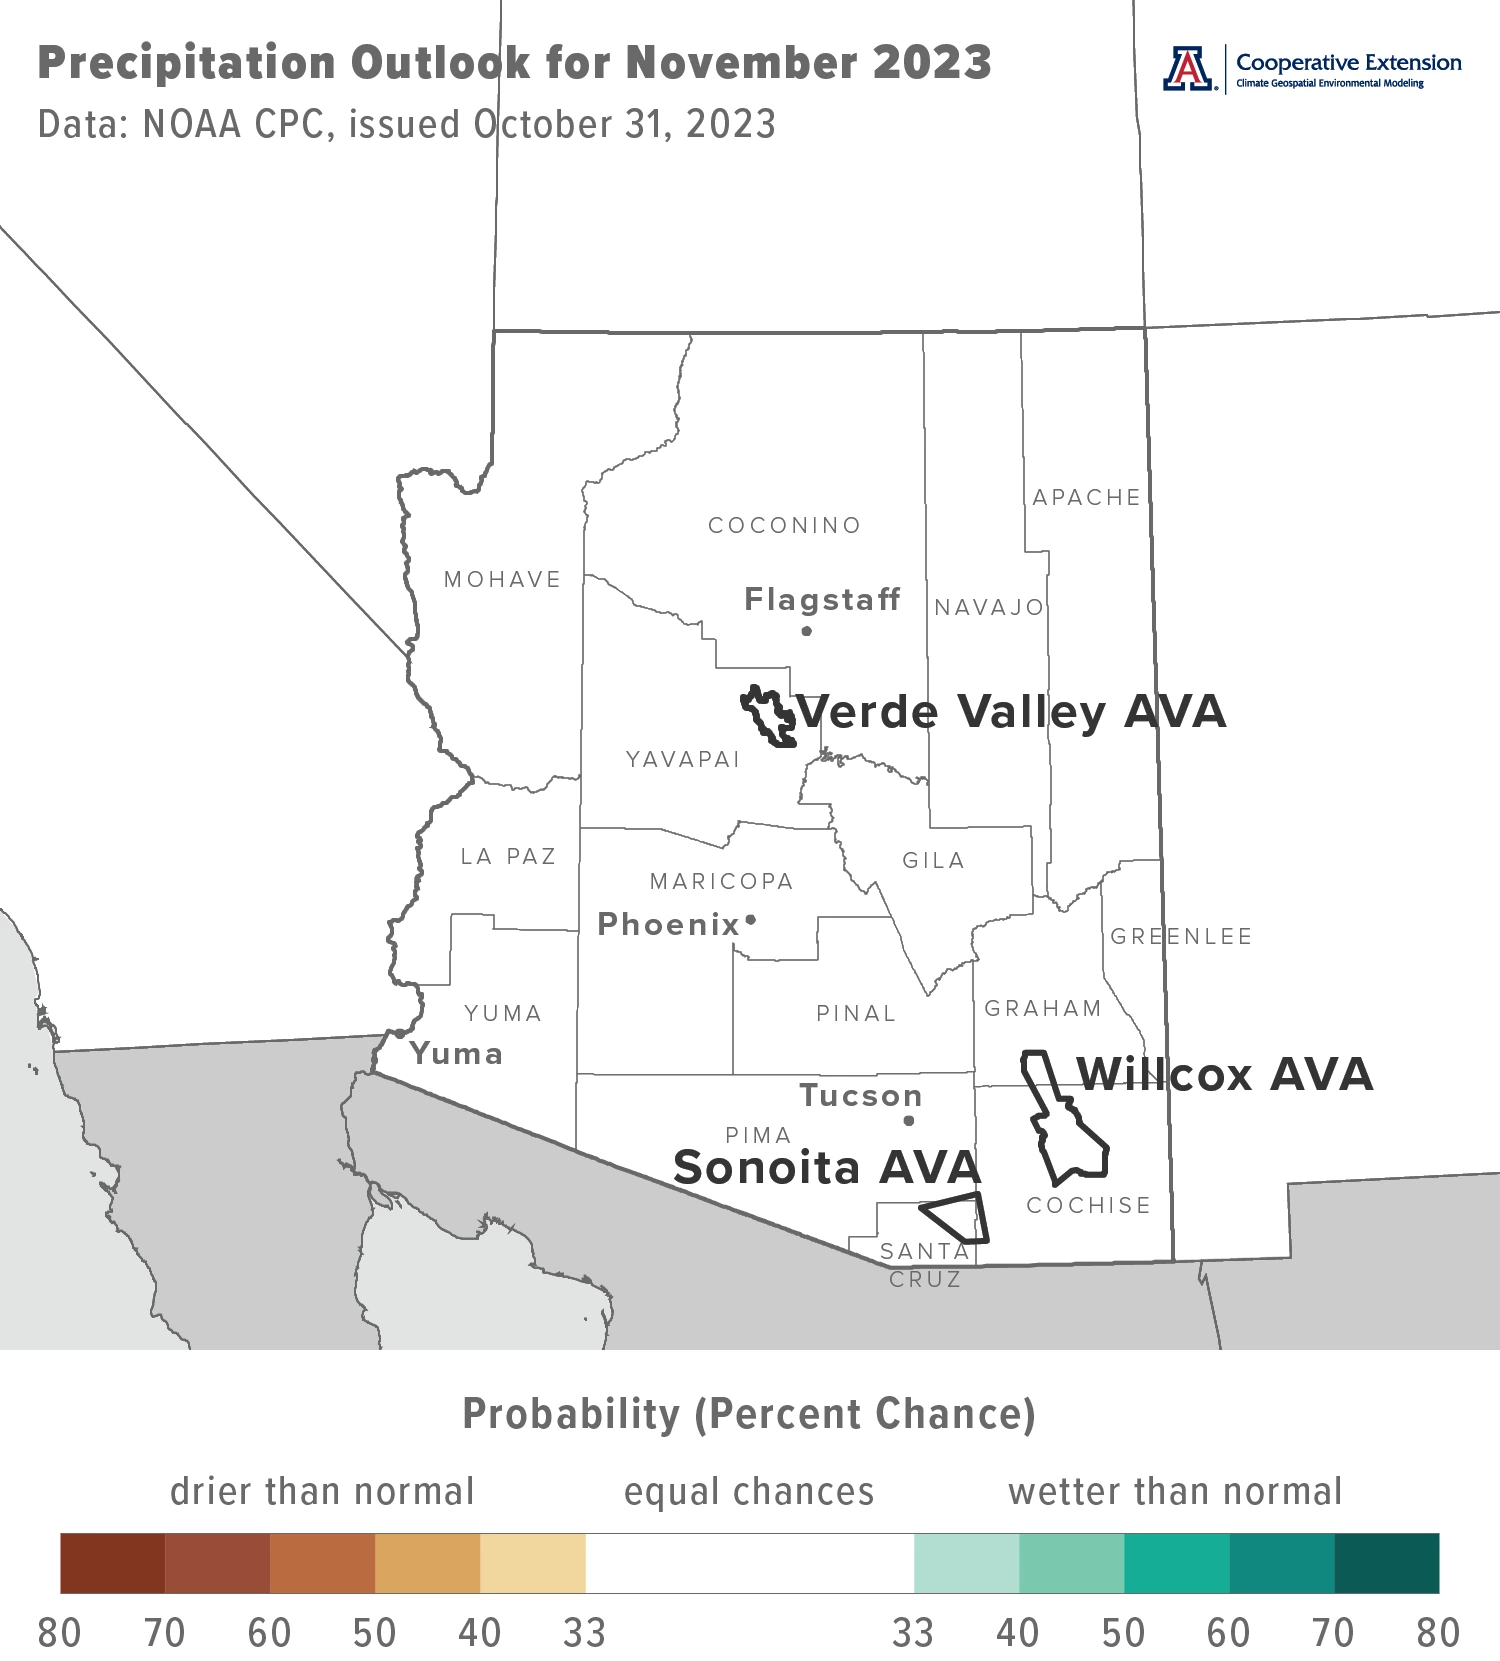
Precipitation totals for this month have equal chances for being below, near, or above normal for the entire state (white area on map). Precipitation during November 2022 was less than 50 % of normal for much of southern and north-central Arizona. Many areas in the northern half of the state measured between 50 and 150 % of normal.
Area-average precipitation totals in November 2022 were 0.21 inches for the Sonoita AVA, 0.28 inches for the Verde Valley AVA, and 0.08 inches for the Willcox AVA. Respective November normals are 0.84, 0.83, and 0.73 inches.
To stay informed of long-range temperature and precipitation possibilities beyond the coverage of a standard weather forecast, check in, too, with the six-to-ten-day outlook and eight-to-fourteen-day outlook issued daily by NOAA’s Climate Prediction Center.
Jeremy Weiss
A Review of 2023 Ripening Conditions for Arizona AVAs
For the past few issues, we’ve taken a few different looks at the conditions under which wine grapes ripen. In August and September, the focus was on exposure to maximum temperatures above 95 °F and minimum temperatures below 65 °F. Last month, it was a double header with the first on the connection between dew point and diurnal temperature range and the second on when temperatures at this part of the growing season are more likely to cross relevant thresholds. Why all the attention? Because temperature, precipitation, and humidity affect fruit quality and composition.
This month, we continue to characterize ripening conditions from another angle. The focus remains on the months of July, August, and September, when most varieties ripen in most locations during most years. The analysis, however, zooms out from the daily details appearing in previous issues and summarizes seasonal temperature and precipitation from this year in comparison to prior ones.
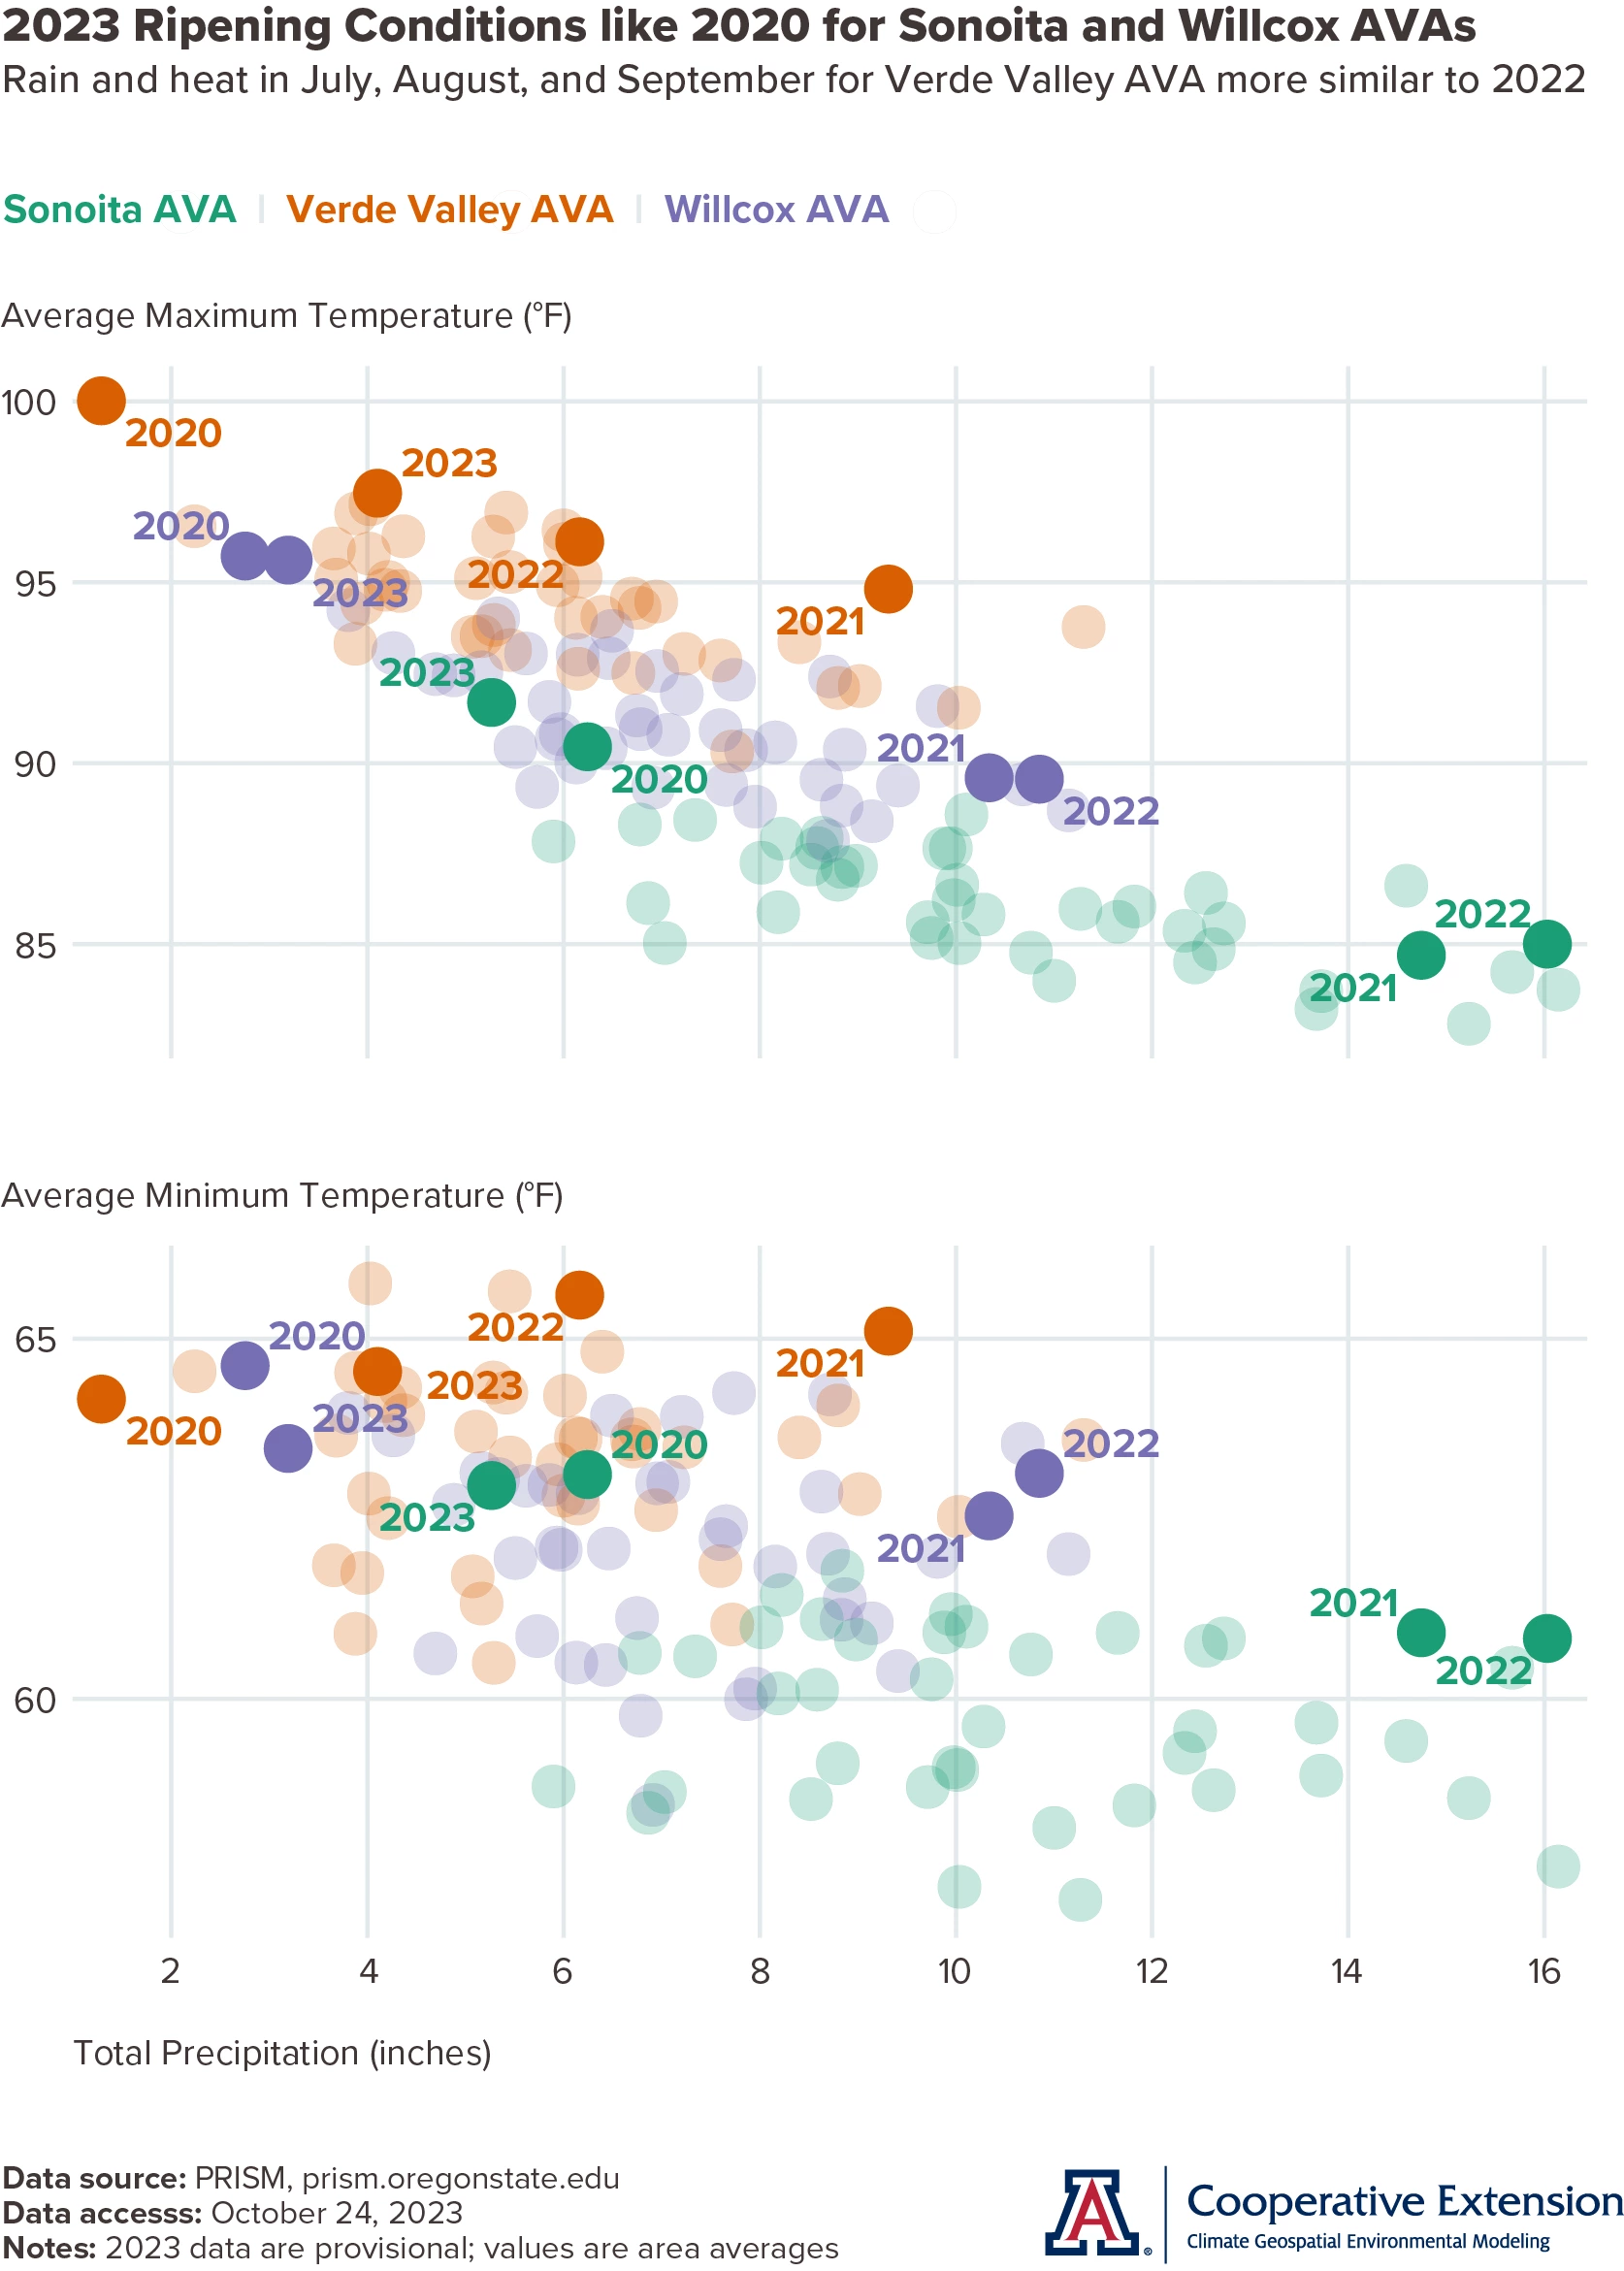
Ripening conditions in 2023 are like those in 2020 for the Sonoita and Willcox AVAs (green and purple points, respectively, in top and bottom graphs). This means that they are among the hottest and driest over the past four-plus decades. Data in these graphs go back to 1981. Like 2020, conditions this year essentially made the Sonoita AVA more like an average dry year in the Willcox AVA (green non-transparent point among purple semi-transparent points), and the Willcox AVA more like an average dry year in the Verde Valley AVA (purple non-transparent point among orange semi-transparent points). This may not be a meaningless statement, as conditions corresponding to the three AVAs tend to stratify, more so with maximum temperature and precipitation (orange, purple, and green points in top graph) than minimum temperature and precipitation (orange, purple, and green points in bottom graph). That is, the Verde Valley AVA generally is warmer and drier than the Willcox AVA, which generally is warmer and drier than the Sonoita AVA. We’ll return shortly to this point in the context of fruit composition.
Among recent vintages, ripening conditions in 2023 for the Verde Valley AVA are more similar to, albeit drier than, those in 2022 (non-transparent orange points in top and bottom graphs). Both years are among the warmest over the past four-plus decades.
To the extent that temperature and precipitation affect fruit composition, we would expect conditions in 2023 to result in composition values that are relatively less distinguishable among the state AVAs for a given variety. Whether it is maximum temperature and precipitation (top graph) or minimum temperature and precipitation (bottom graph), points for the current vintage cluster near one another. That is, ripening conditions in 2023 are similar for the three AVAs. This contrasts with a vintage like 2022, in which points do not cluster and conditions are not as similar.
Although we’ve written about this before, it bears repeating that the sequence of ripening conditions over the past four vintages could qualify as ‘weather whiplash’, a phrase used to describe a quick change from one set of extremes to an opposite set, particularly for the Sonoita and Willcox AVAs. Regardless of such conceptualization, this volatility is in line with the expectation for a more variable and extreme summer climate both now and in the coming years. For Arizona viticulture, performance of varieties during these vintages may suggest what their role might be in monsoon hedging and be an indication of their future viability.
Jeremy Weiss
Extra Notes
The current El Niño event has a greater than 95 % chance to continue through the January through March timeframe, when its influence on regional temperature and precipitation is potentially at its greatest. Furthermore, the odds that it becomes a “strong” event now are between 75 and 85 %. Despite that possible categorization, please keep in mind that chances of any related anomalies in our winter weather often are lower than chances of the event itself.
Cooperative Extension is presenting the Winter Viticulture Symposium from 7:30 am to 3:30 pm on December 6, 2023, at the University of Arizona Controlled Environment Agriculture Center in Tucson. There will be presentations and discussions about vineyard irrigation, soil and soil fertility, entomology, pathology, weather and climate, and small-business development, a workshop-style review of the 2023 growing season, as well as lunch sponsored by the Arizona Wine Growers Association. The symposium is free, but registration is required and space is limited. Please contact Sierra Sheeks to register or for more information.
A new Extension bulletin about breakout group discussions at the 2023 Arizona Viticulture Summit last March is now available. In addition to a summary of the discussions, the authors identify the topics that occurred most frequently among the thematic areas of viticultural production, industry and economic development, operations management, technology integration, and customer acquisition and fulfillment and brand development.
The Arizona Pest Management Center with University of Arizona Cooperative Extension recently posted a brief summary on the western grapeleaf skeletonizer, including information on its description and identification, life stages, host plants, damage to grapevines, and management.
The Arizona Water Map Poster by the Water Resources Research Center at the University of Arizona is available both in print and as a PDF download. It provides a concise visual representation of Arizona’s water resources. In addition to the main map, there are multiple inset images around the edges of the poster displaying several different kinds of visual data to provide additional information and context. These include Arizona’s average annual water use, Colorado River apportionments, water use by groundwater basin, land ownership, annual precipitation by planning area, subsidence and storage, and water system connections. The land ownership inset, for example, is useful for illustrating how little Arizona land is privately held. The water map insets are now available on the WRRC website as PNG files for individual download and use.
For those of you in southeastern Arizona, including the Sonoita and Willcox AVAs, Cooperative Extension manages an email listserv in coordination with the Tucson forecast office of the National Weather Service to provide information in the days leading up to agriculturally important events, like fall freezes and the occasional storm. Please contact us if you'd like to sign up.
And for those of you in north-central and northeastern Arizona, including the Verde Valley AVA, Cooperative Extension also now manages an email listserv in coordination with the Flagstaff forecast office of the National Weather Service to provide similar information for this part of the state. Please contact us if you'd like to sign up.
Undergraduate students in the College of Agriculture and Life Sciences at the University of Arizona are looking for internships with businesses and companies in the viticulture and winery industries. Please contact Danielle Buhrow, Senior Academic Advisor and Graduate Program Coordinator in the Department of Agricultural and Resource Economics, for more information.
Please feel free to give us feedback on this issue of the Climate Viticulture Newsletter, suggestions on what to include more or less often, and ideas for new topics.
Did someone forward you this newsletter? Please contact us to subscribe.
Have a wonderful November!
With current and past support from:
