< Back to Climate Viticulture Newsletter
Hello, everyone!
This is the April 2023 issue of the Climate Viticulture Newsletter – a quick look at some timely climate topics relevant to wine grape growing in Arizona.
March Recap | April Outlook | Start of the Growing Season | Dormant Season Review | Extra Notes
A Recap of March Temperature and Precipitation
Monthly average temperatures were 1 to 4 °F below the 1991-2020 normal for much of the southeastern and east-central parts of Arizona (light blue, blue, and dark blue areas on map), including the Sonoita and Willcox AVAs. Much of the rest of the state, including the Verde Valley AVA, saw temperatures more than 4 °F below normal (light purple and dark purple areas on map). For reference, monthly temperatures in March last year were within 2 °F of normal for much of the state.
Area-average maximum and minimum temperatures during March 2023 were 64.1 and 35.5 °F for the Sonoita AVA, 59.9 and 35.7 °F for the Verde Valley AVA, and 65.8 and 35.8 °F for the Willcox AVA. Respective March normals are 67.1 and 36.9 °F, 68.0 and 37.6 °F, and 69.4 and 37.1 °F.

Jeremy Weiss
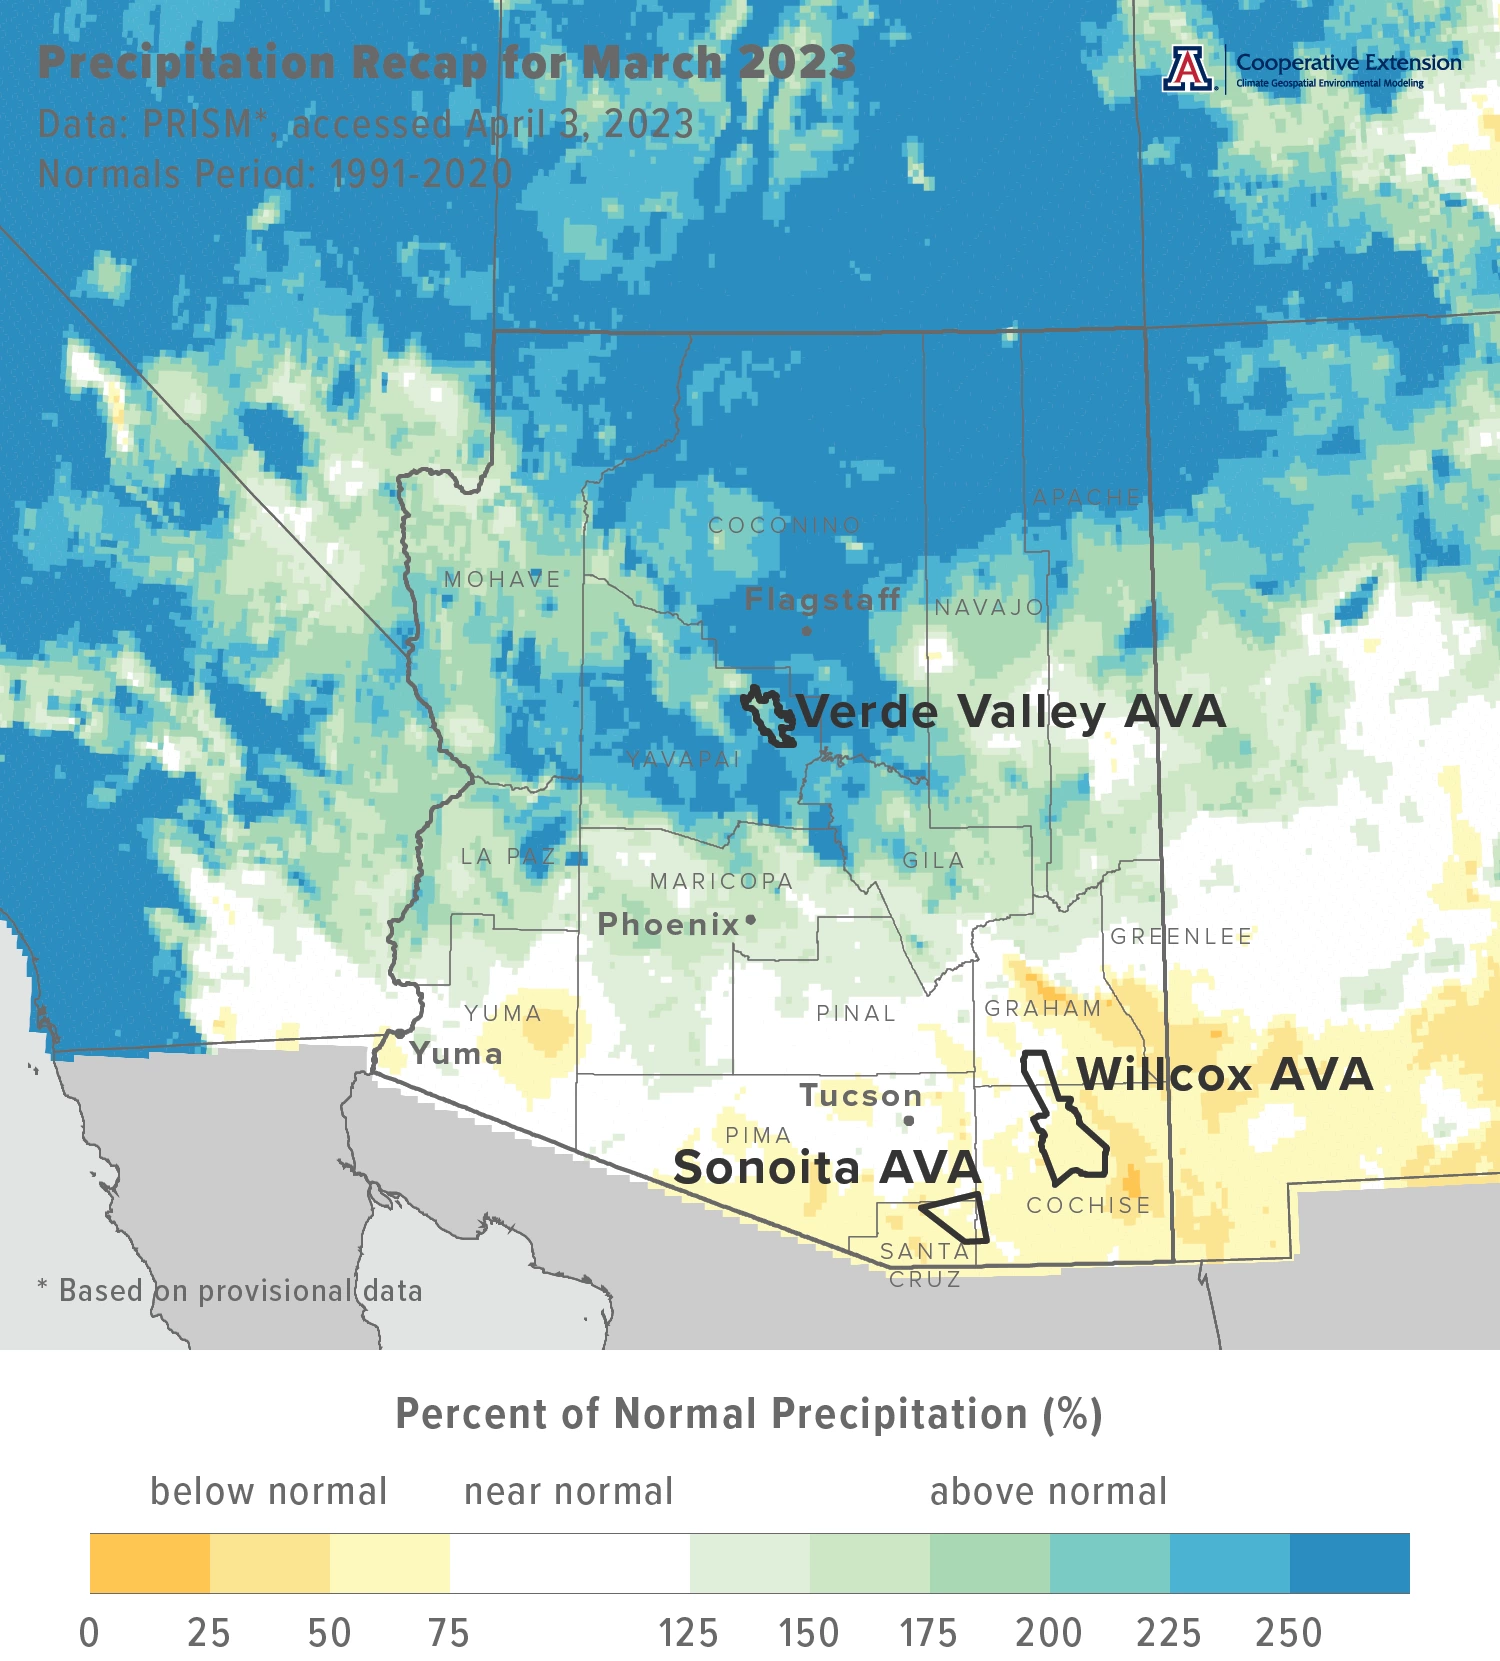
Monthly precipitation totals were more than 200 % of normal for many areas in the northern half of the state (aqua, blue, and dark blue areas on map), including the Verde Valley AVA. These and other areas with above-normal amounts (light green, green, and dark green areas on map) transitioned to areas in southeastern Arizona where monthly totals mostly were 50 to 75 % of normal, including much of the Sonoita and Willcox AVAs (light yellow areas on map). Precipitation during March 2022 was less than 50 % of normal for much of the southern and western halves of Arizona. Some areas, like the Sonoita and Verde Valley AVAs fared marginally better with amounts 50 to 100 % of normal. Only a few locations in northwestern Arizona managed above-normal totals.
Area-average total precipitation in March 2023 was 0.66 inches for the Sonoita AVA, 3.01 inches for the Verde Valley AVA, and 0.50 inches for the Willcox AVA. Respective March normals are 0.97, 1.31, and 0.76 inches.
Based on the daily weather summaries since November for the AZMet Bonita and Willcox Bench stations in the Willcox AVA, precipitation last month brings dormant-season totals at these locations to 3.89 and 2.94 inches, respectively. Total reference evapotranspiration during the November-March period nonetheless remains higher, with respective values of 14.2 and 14.8 inches, illustrating a need for attention to winter irrigation and to issues like delayed spring growth. We review dormant-season temperature and precipitation conditions for all three Arizona AVAs below.
Dig into daily weather summaries from 2023 for the AZMet Bonita and Willcox Bench stations in the Willcox AVA
Learn more about PRISM climate data
Jeremy Weiss
The Outlook for April Temperature and Precipitation
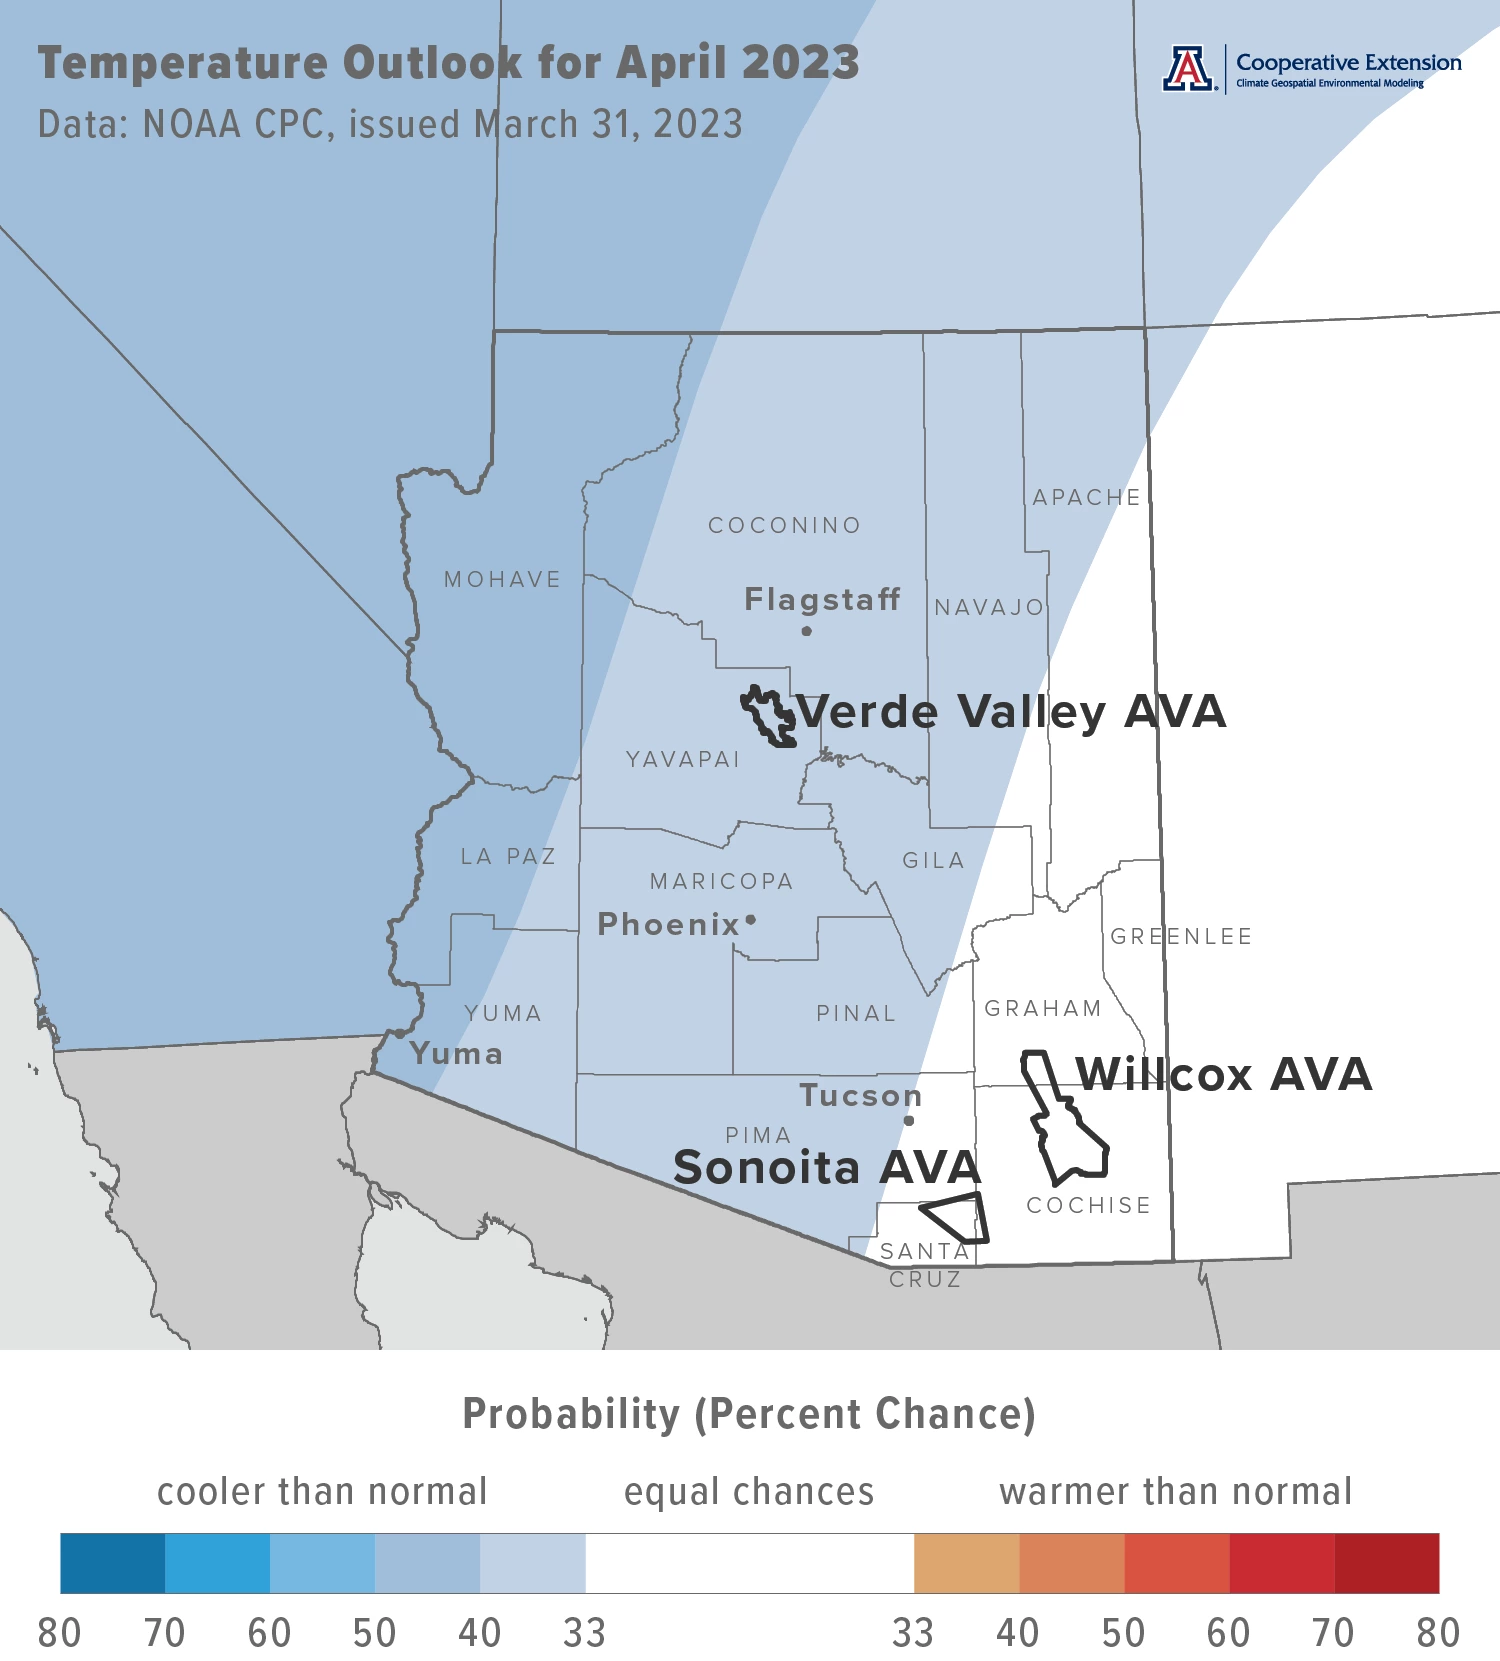
Temperatures over the course of this month have a slight increase in chances for being below the 1991-2020 normal across the northwestern two-thirds of Arizona (light blue and blue areas on map). For the southeastern one-third, there are equal chances for below-, near-, or above-normal temperatures (white area on map). Monthly temperatures in April last year were 2 to 4 °F above normal for much of the state.
Area-average maximum and minimum temperatures during April 2022 were 77.6 and 44.0 °F for the Sonoita AVA, 80.4 and 44.2 °F for the Verde Valley AVA, and 80.7 and 43.2 °F for the Willcox AVA. Respective April normals are 73.5 and 41.9 °F, 75.5 and 42.6 °F, and 76.7 and 42.0 °F.
As things head into the start of the 2023 growing season, it is the first time since 2020 that an April outlook isn’t leaning towards warmer-than-normal monthly temperatures. Should this April come in cooler than the past two, one thing that vines could show is slower progress between early growth stages due to less heat accumulation.
Jeremy Weiss
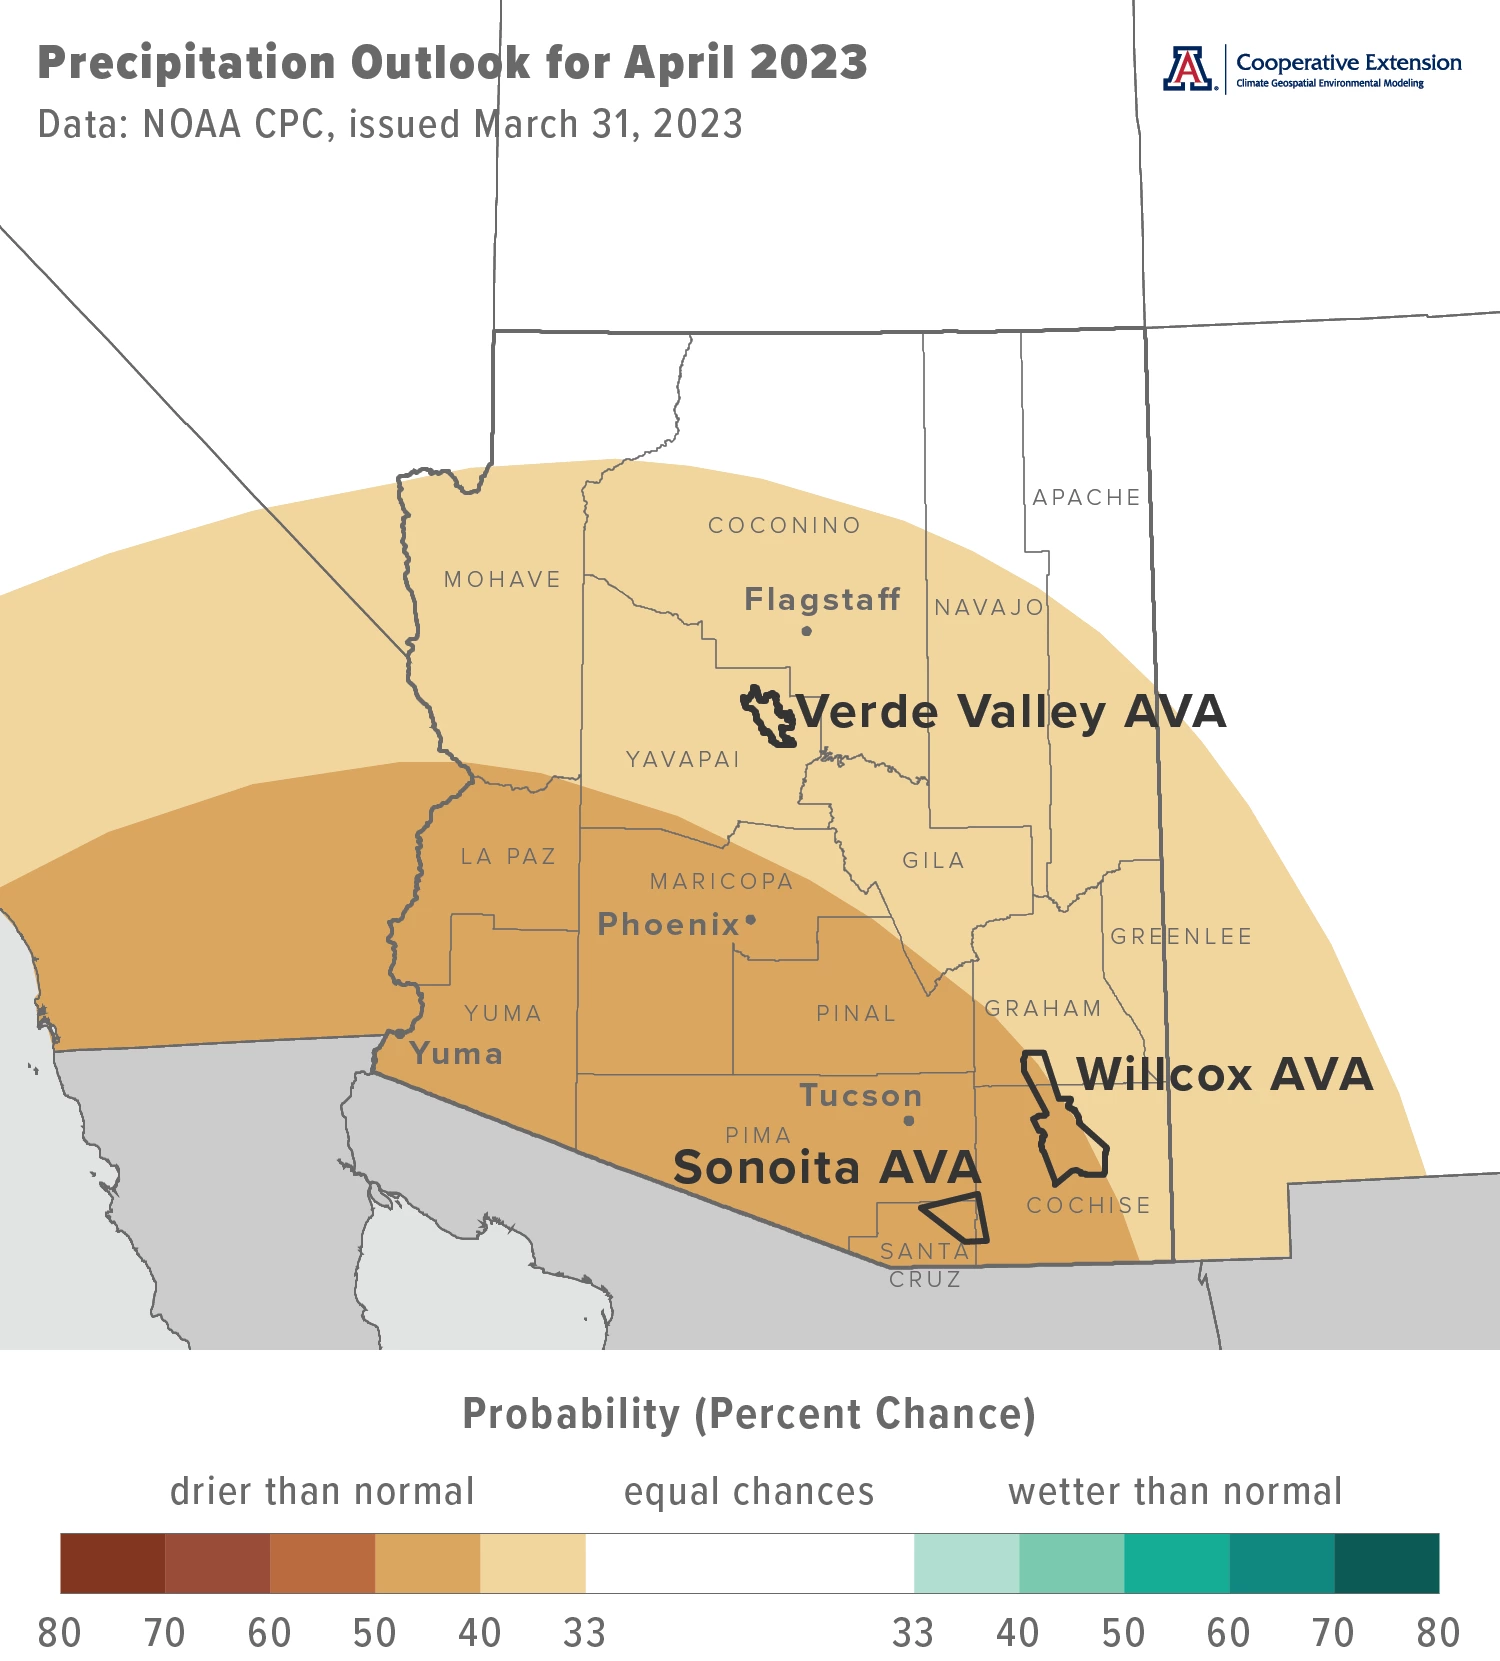
Precipitation totals for this month have a slight increase in chances for being below normal across all but the northern tier of the state (light tan and tan areas on map). For the northern tier, there are equal chances for below-, near-, or above-normal totals (white area on map). Precipitation during April last year was less than 25 % of normal for almost all of Arizona.
Area-average precipitation totals in April 2022 were 0.00 inches for the Sonoita AVA, 0.00 inches for the Verde Valley AVA, and 0.00 inches for the Willcox AVA. Respective April normals are 0.38, 0.55, and 0.25 inches.
To stay informed of long-range temperature and precipitation possibilities beyond the coverage of a standard weather forecast, check in, too, with the six-to-ten-day outlook and eight-to-fourteen-day outlook issued daily by NOAA’s Climate Prediction Center.
Jeremy Weiss
Vine Dormancy and the Start of the Growing Season
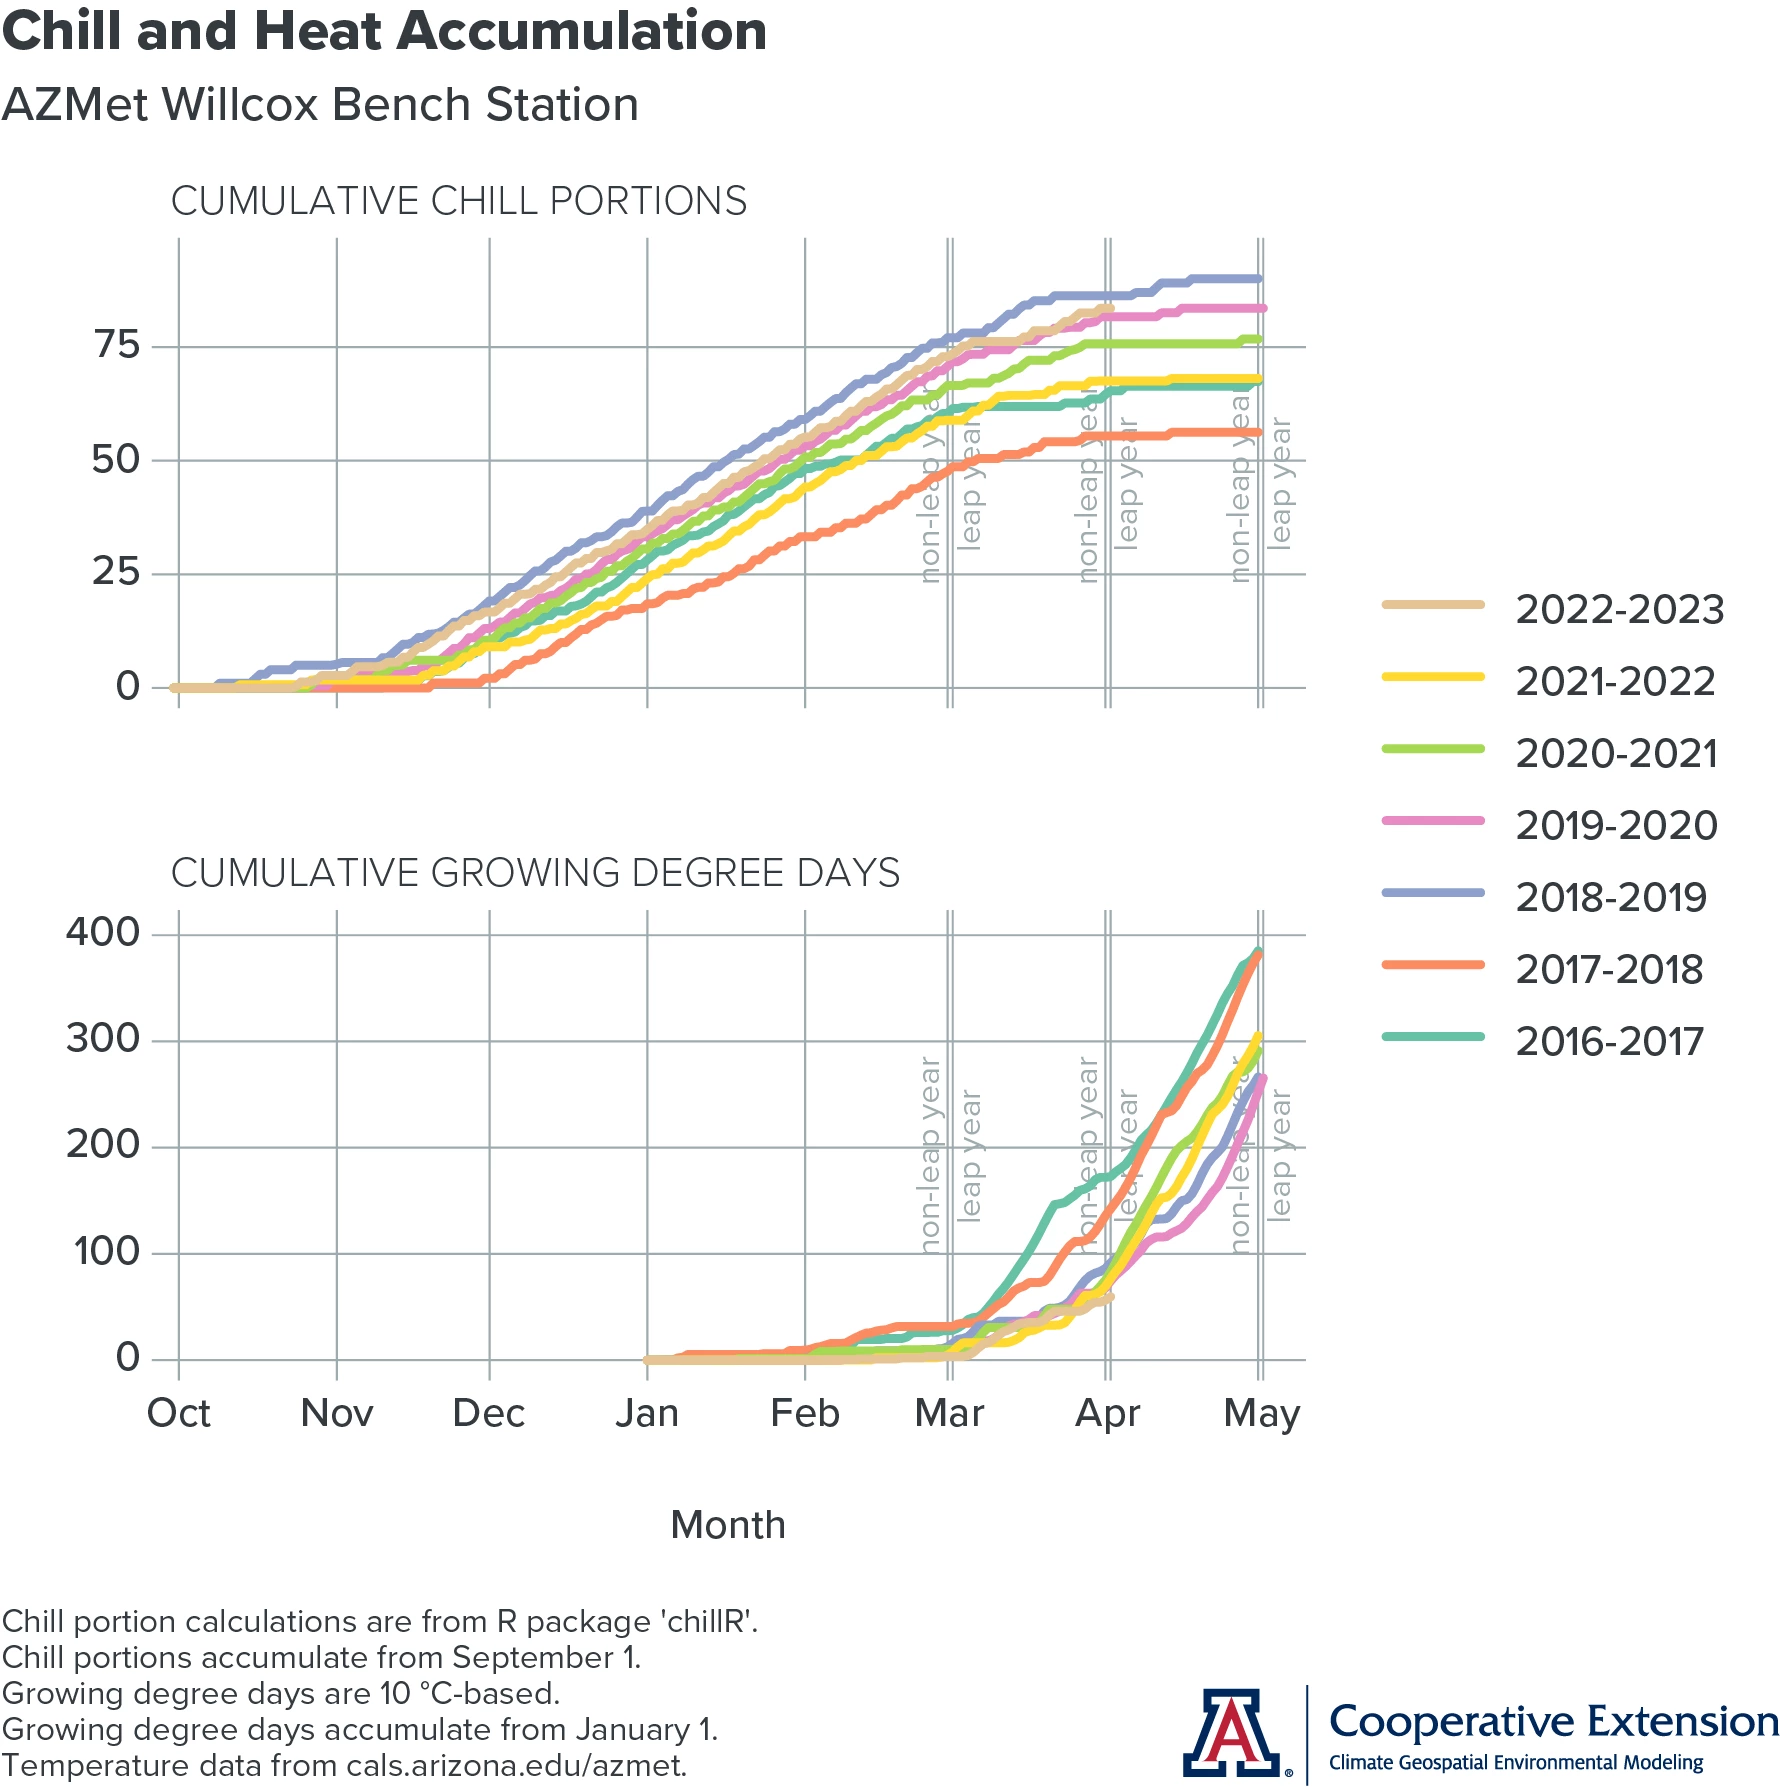
Temperature conditions at the AZMet Willcox Bench station in the south-central part of the Willcox AVA so far this dormant season have resulted in cumulative chill portion values that are most similar to those from 2019-2020 and 2018-2019 (tan, pink, and blue lines in top graph, respectively). Cumulative growing degree day values for this dormant season are most like those from those two past dormant seasons (tan, pink, and blue lines in bottom graph, respectively), as well as from the past two, 2021-2022 and 2020-2021 (yellow and green lines in bottom graph, respectively).
Fortunately, having the same dormant seasons listed for these two measures related to vine dormancy makes it easier to use past ‘analog’ years to estimate bud break dates. Based on the above, timing of bud break in 2023 still looks on track to be most like that from springs 2020 and 2019, and earlier than springs 2022 and 2021, at least at this location.
It might seem counterintuitive that bud break this year occur earlier than that from springs 2022 and 2021, as monthly average temperatures since last November have been cooler than those from the past two dormant seasons. Although cooler, temperatures over the past few months have led to higher chill accumulation than in those two years. We suspect this has resulted in part from fewer days with daytime temperatures above the chilling-temperature range, which can effectively negate some of the accumulated chill. With greater chill accumulation, less heat accumulation is needed for vines to start the growing season, in a process explained through deacclimation kinetics. As with other aspects of vine growth, mapping measured temperatures to ranges and thresholds important to plant physiology is one way to better understand, explain, and predict what happens in the vineyard.
To continue tracking chill and heat accumulation during the month, visit our related early-stage, interactive web application that updates daily.
Jeremy Weiss
A Review of the 2022-2023 Dormant Season
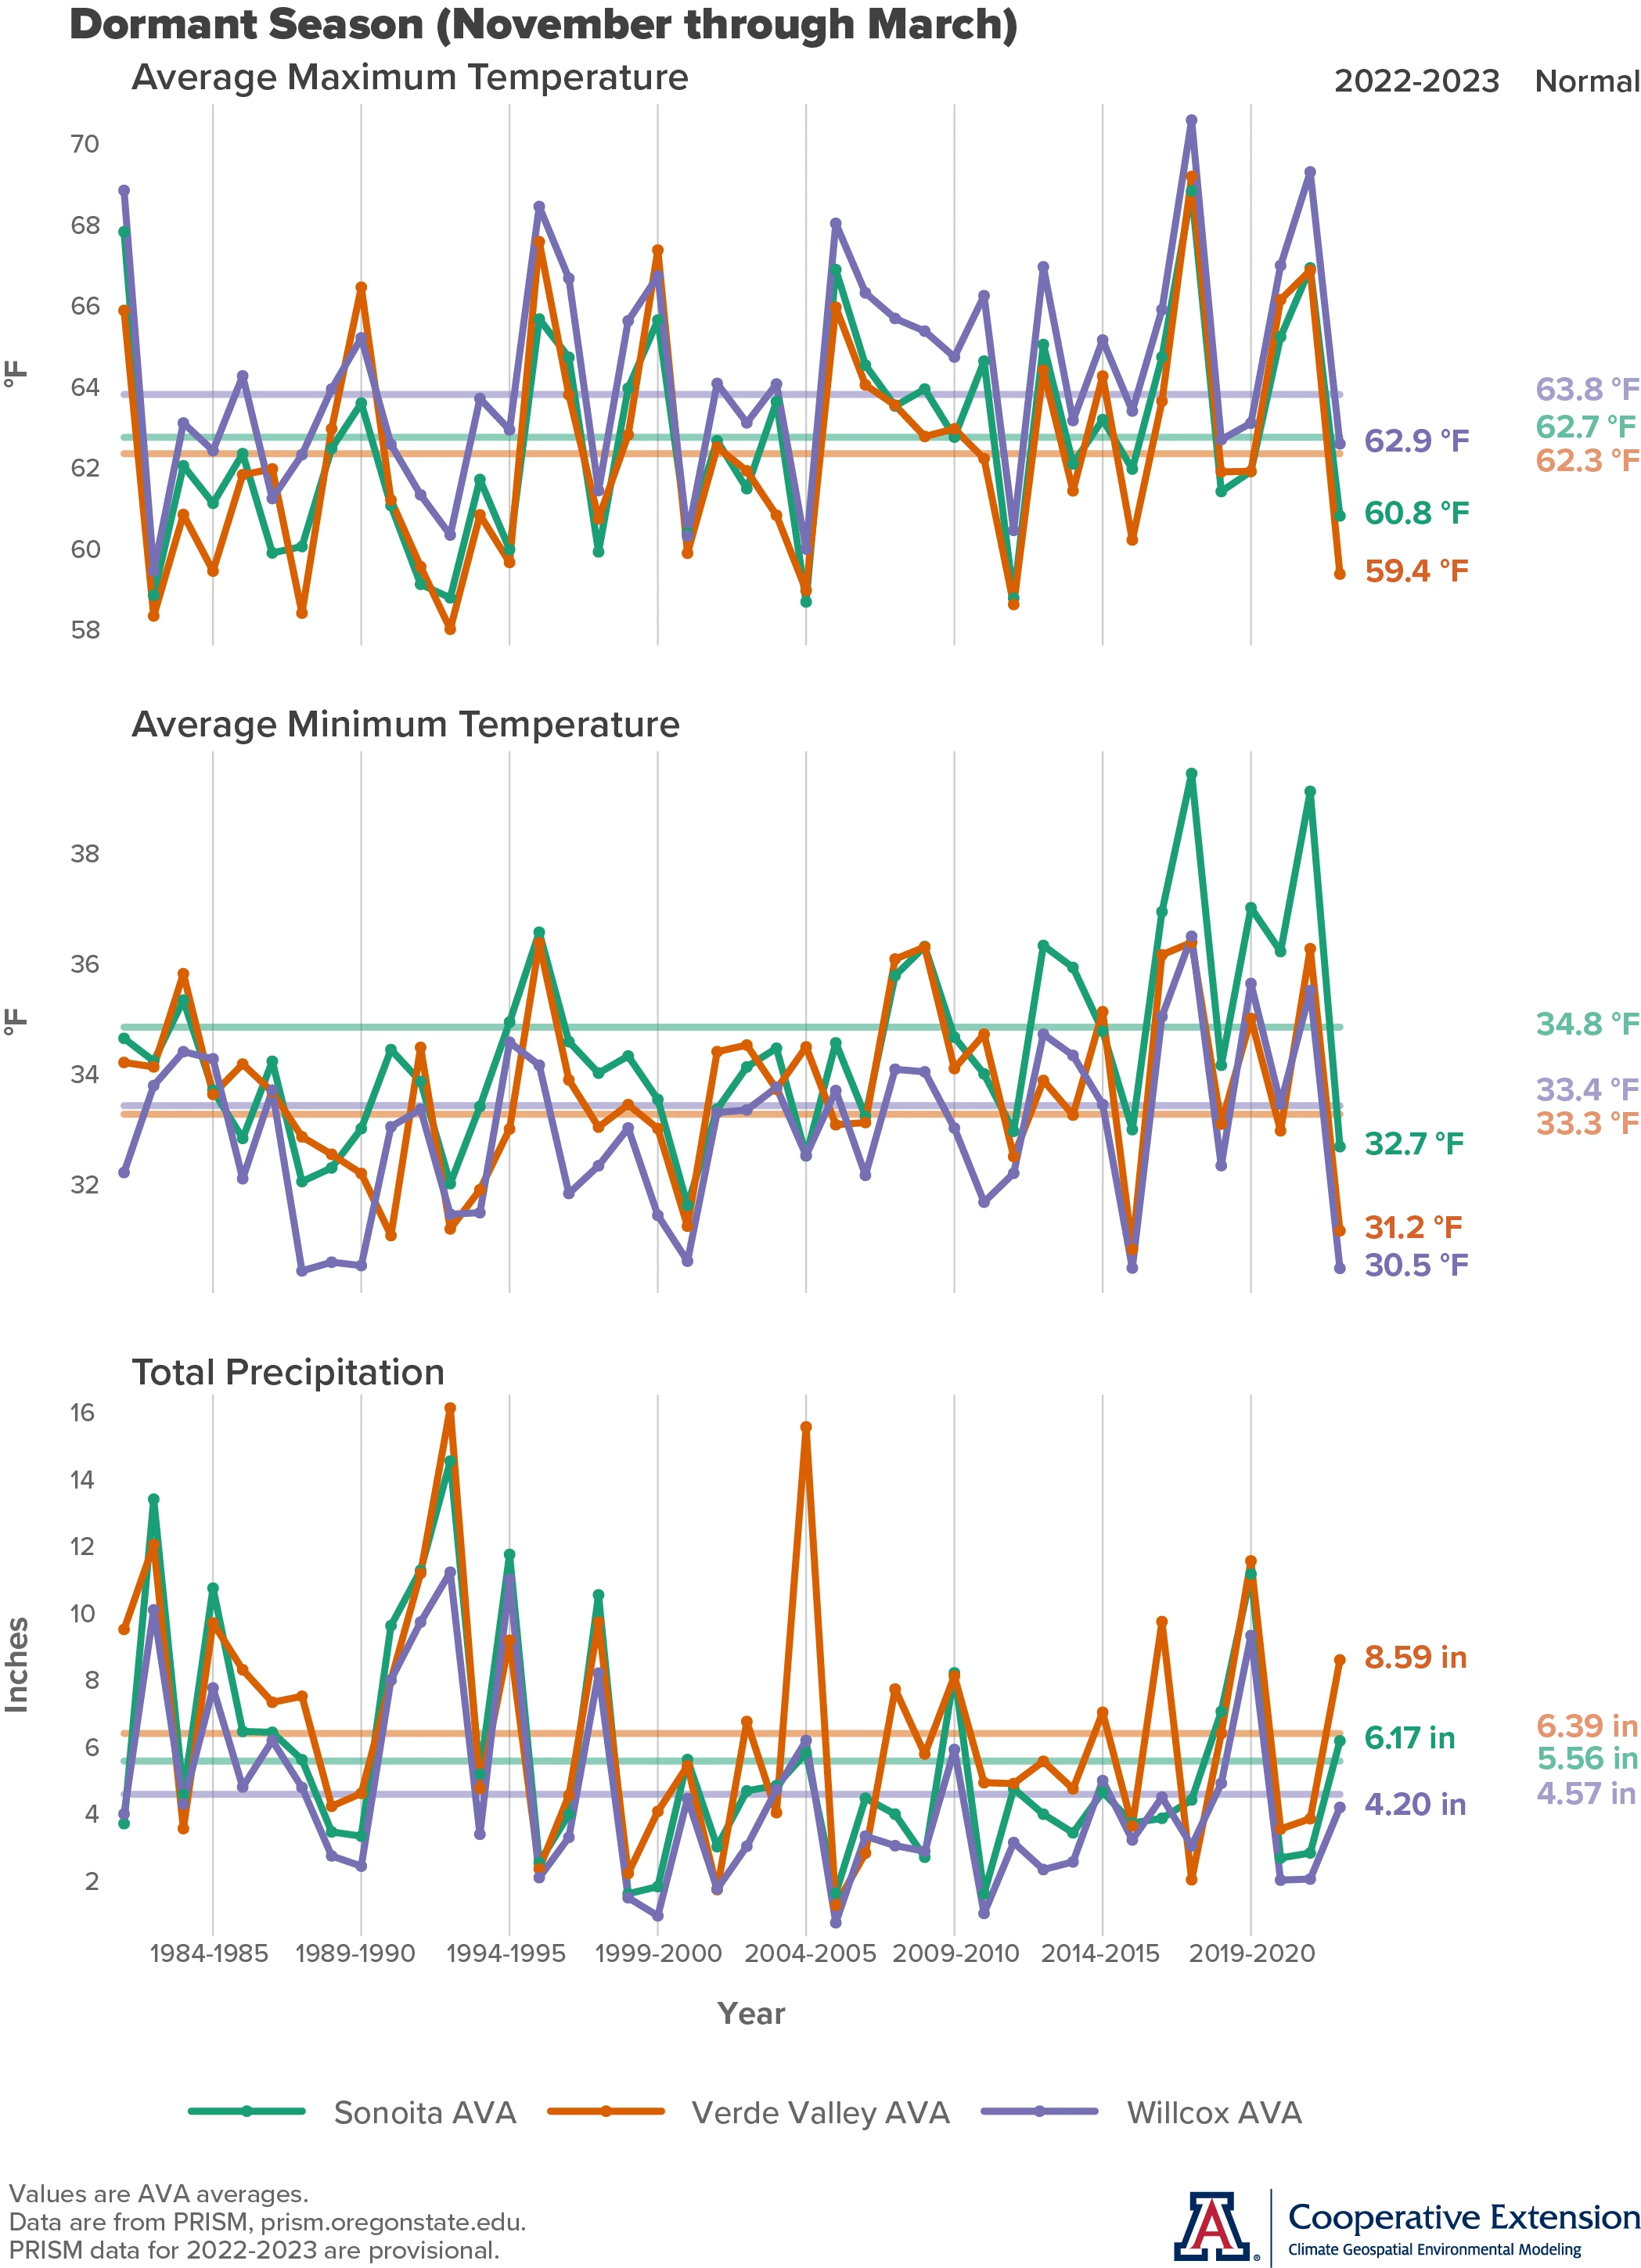
With the start of the 2023 growing season, it’s time to review this past dormant season. Much like the 2022 growing season review in the recent December and January newsletter issues, we focus on average maximum and minimum temperatures (top and middle graphs, respectively) as well as total precipitation (bottom graph) in the three Arizona AVAs.
Average maximum temperatures during the period from November through March were below the 1991-2020 normal (semi-transparent horizontal lines on graphs) for all three Arizona AVAs. For the Sonoita and Willcox AVAs (green and purple lines on graphs, respectively), these differences were about 1 to 2 °F, whereas it was about 3 °F for the Verde Valley AVA (orange lines on graphs). As noted in the previous section, we suspect this resulted in fewer days with daytime temperatures above the chilling-temperature range, which can effectively negate some of the accumulated chill. Past dormant seasons with similar average maximum temperatures include 2015-2016 and 2011-2012.
Average minimum temperatures during this past dormant season also were below the 1991-2020 normal for all three Arizona AVAs. For the Sonoita and Verde Valley AVAs these differences were about 2 °F, whereas it was about 3 °F for the Willcox AVA. Past dormant seasons with similar average minimum temperatures include 2015-2016 and 2000-2001.
Precipitation totals from November through March were within about 10 % of normal for the Sonoita and Willcox AVAs, with amounts 0.61 inches above at the former and 0.37 inches below at the latter. Similar past dormant seasons include 2018-2019. For the Verde Valley AVA, total precipitation during the past five months was about 135 % of, or 2.2 inches greater than, normal. Similar past dormant seasons include 2019-2020 and 2016-2017. For all three Arizona AVAs, precipitation this dormant season was greater than the previous two.
Jeremy Weiss
Extra Notes
Last call to all growers, viticulturists, and vineyard owners! University of Arizona Cooperative Extension is wrapping up a Statewide Viticulture Needs Assessment and needs your help. Topics will include production, irrigation management, soil fertility, and management of pests, pathogens, and disease, among others. Your anonymous feedback is essential and will inform Cooperative Extension as to how it can best serve the wine grape industry. Please click here to access the survey, and contact Matt Halldorson, Yavapai County Director and Associate Agent in Agriculture and Natural Resources with Cooperative Extension, with any questions.
A big thank you to all who attended and participated at the Viticulture Planning Summit in early March. Copies of presentations and information from the break-out sessions will be available soon.
It’s once again wildland fire season in the Southwest. There is an above-normal potential this month for significant wildland fires across southeastern Arizona, and a below-normal potential across northeastern Arizona. Normal potential for significant wildland fires exists for the rest of the state.
The Water Resources Research Center at the University of Arizona recently updated their Water Factsheet for Cochise County, which is where about three-quarters of the Willcox AVA is located. The updated factsheet includes information about the recently approved and designated Douglas AMA, or Active Management Area.
For those of you in southeastern Arizona, including the Sonoita and Willcox AVAs, Cooperative Extension manages an email listserv in coordination with the Tucson forecast office of the National Weather Service to provide information in the days leading up to agriculturally important events, like spring freezes and high-wind days. Please contact us if you'd like to sign up.
And for those of you in north-central and northeastern Arizona, including the Verde Valley AVA, Cooperative Extension also now manages an email listserv in coordination with the Flagstaff forecast office of the National Weather Service to provide similar information for this part of the state. Please contact us if you'd like to sign up.
Undergraduate students in the College of Agriculture and Life Sciences at the University of Arizona are looking for internships with businesses and companies in the viticulture and winery industries. Please contact Danielle Buhrow, Senior Academic Advisor and Graduate Program Coordinator in the Department of Agricultural and Resource Economics, for more information.
Please feel free to give us feedback on this issue of the Climate Viticulture Newsletter, suggestions on what to include more or less often, and ideas for new topics.
Did someone forward you this newsletter? Please contact us to subscribe.
Have a wonderful April!
With current and past support from:
