< Back to Climate Viticulture Newsletter
Hello, everyone!
This is the November 2021 issue of the Climate Viticulture Newsletter – a quick look at some timely climate topics relevant to winegrape growing in Arizona and New Mexico.
A Recap of October Temperature and Precipitation
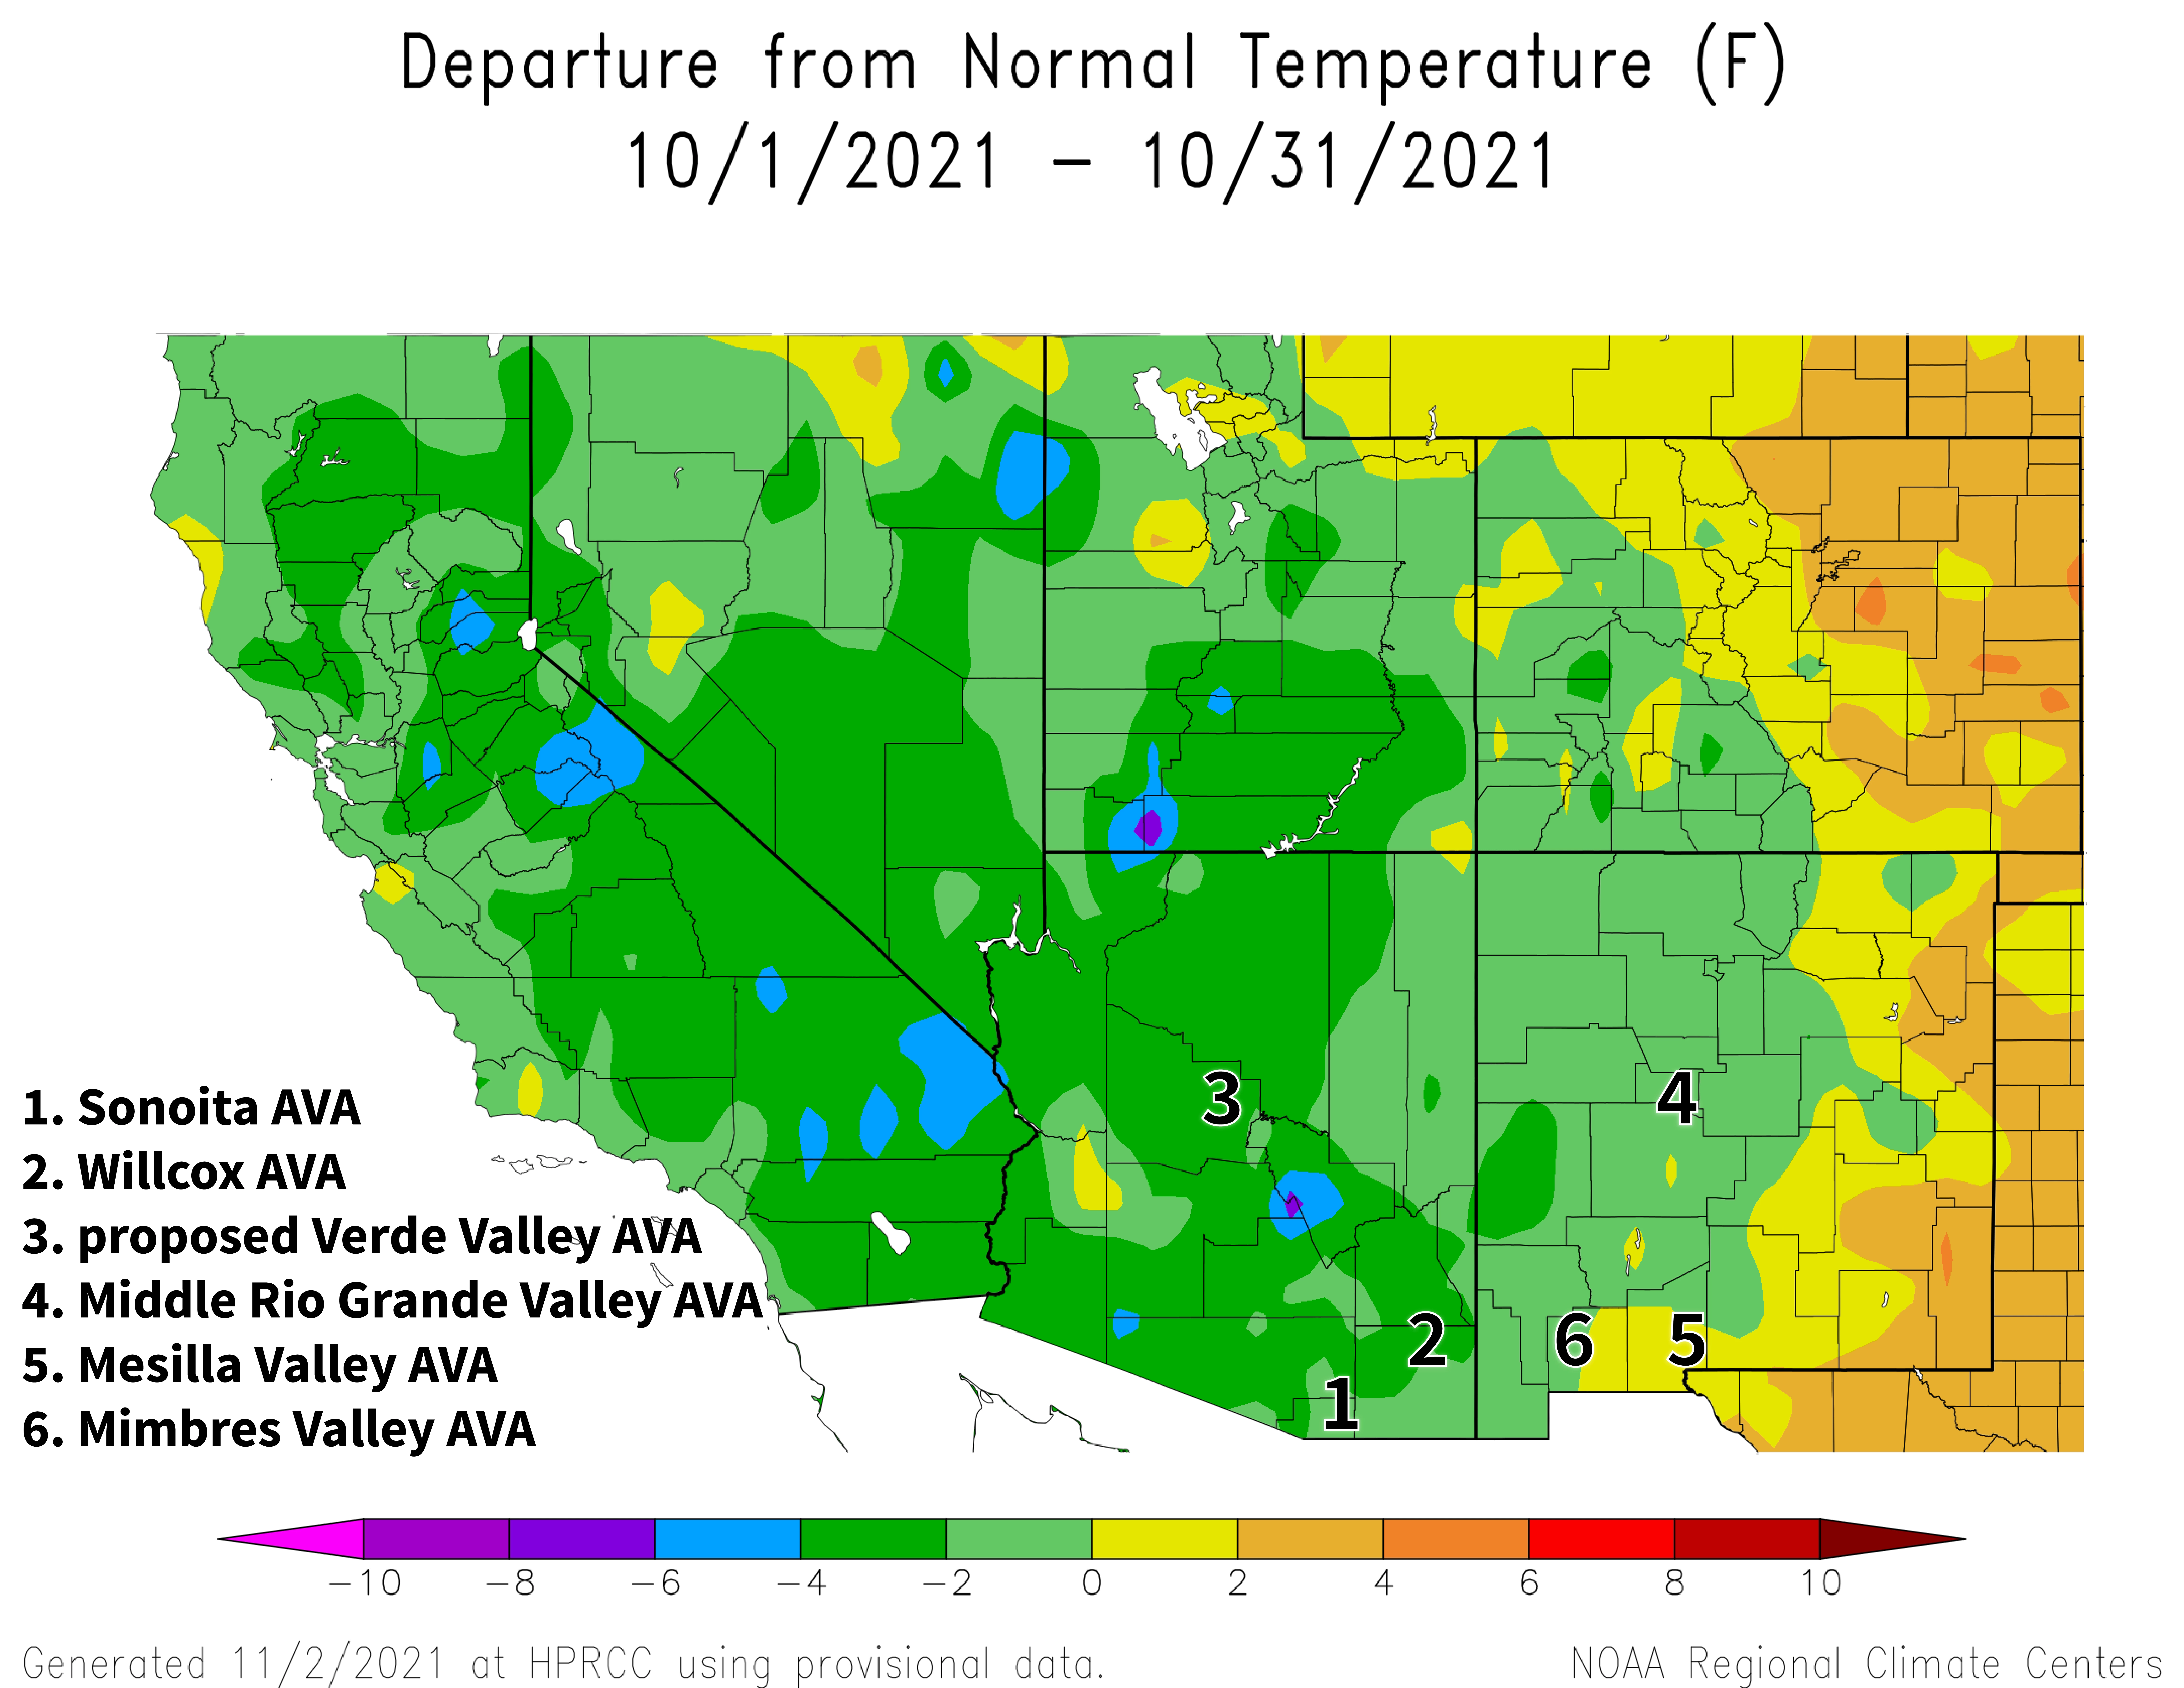
Monthly average temperatures ran from relatively cool in the west to relatively warm in the east across the region. Western and central Arizona were 2 to 4 °F below the 1991-2020 normal (dark green areas on map), whereas eastern Arizona and western and central New Mexico were within 2 °F of normal (light green and yellow areas on map). Much of extreme eastern New Mexico measured temperatures 2 to 4 °F above normal (orange area on map). For reference, monthly temperatures in October last year were 2 to 6 °F warmer than the 1981-2010 normal for much of Arizona and many areas in the western two-thirds of New Mexico.
For many locations apart from some in the relatively warmer growing areas in the region, the first fall freezes came about in the middle and latter parts of the month. Fortunately, these events didn’t seem as severe as those in October 2019 and October 2020, when the mix of well-below-freezing temperatures and lack of cold hardiness in vines likely led to no or slow growth the following springs. Perhaps more vineyards will see a more gradual and less shocking progression with vine dormancy this year compared to past two.
NOAA ACIS
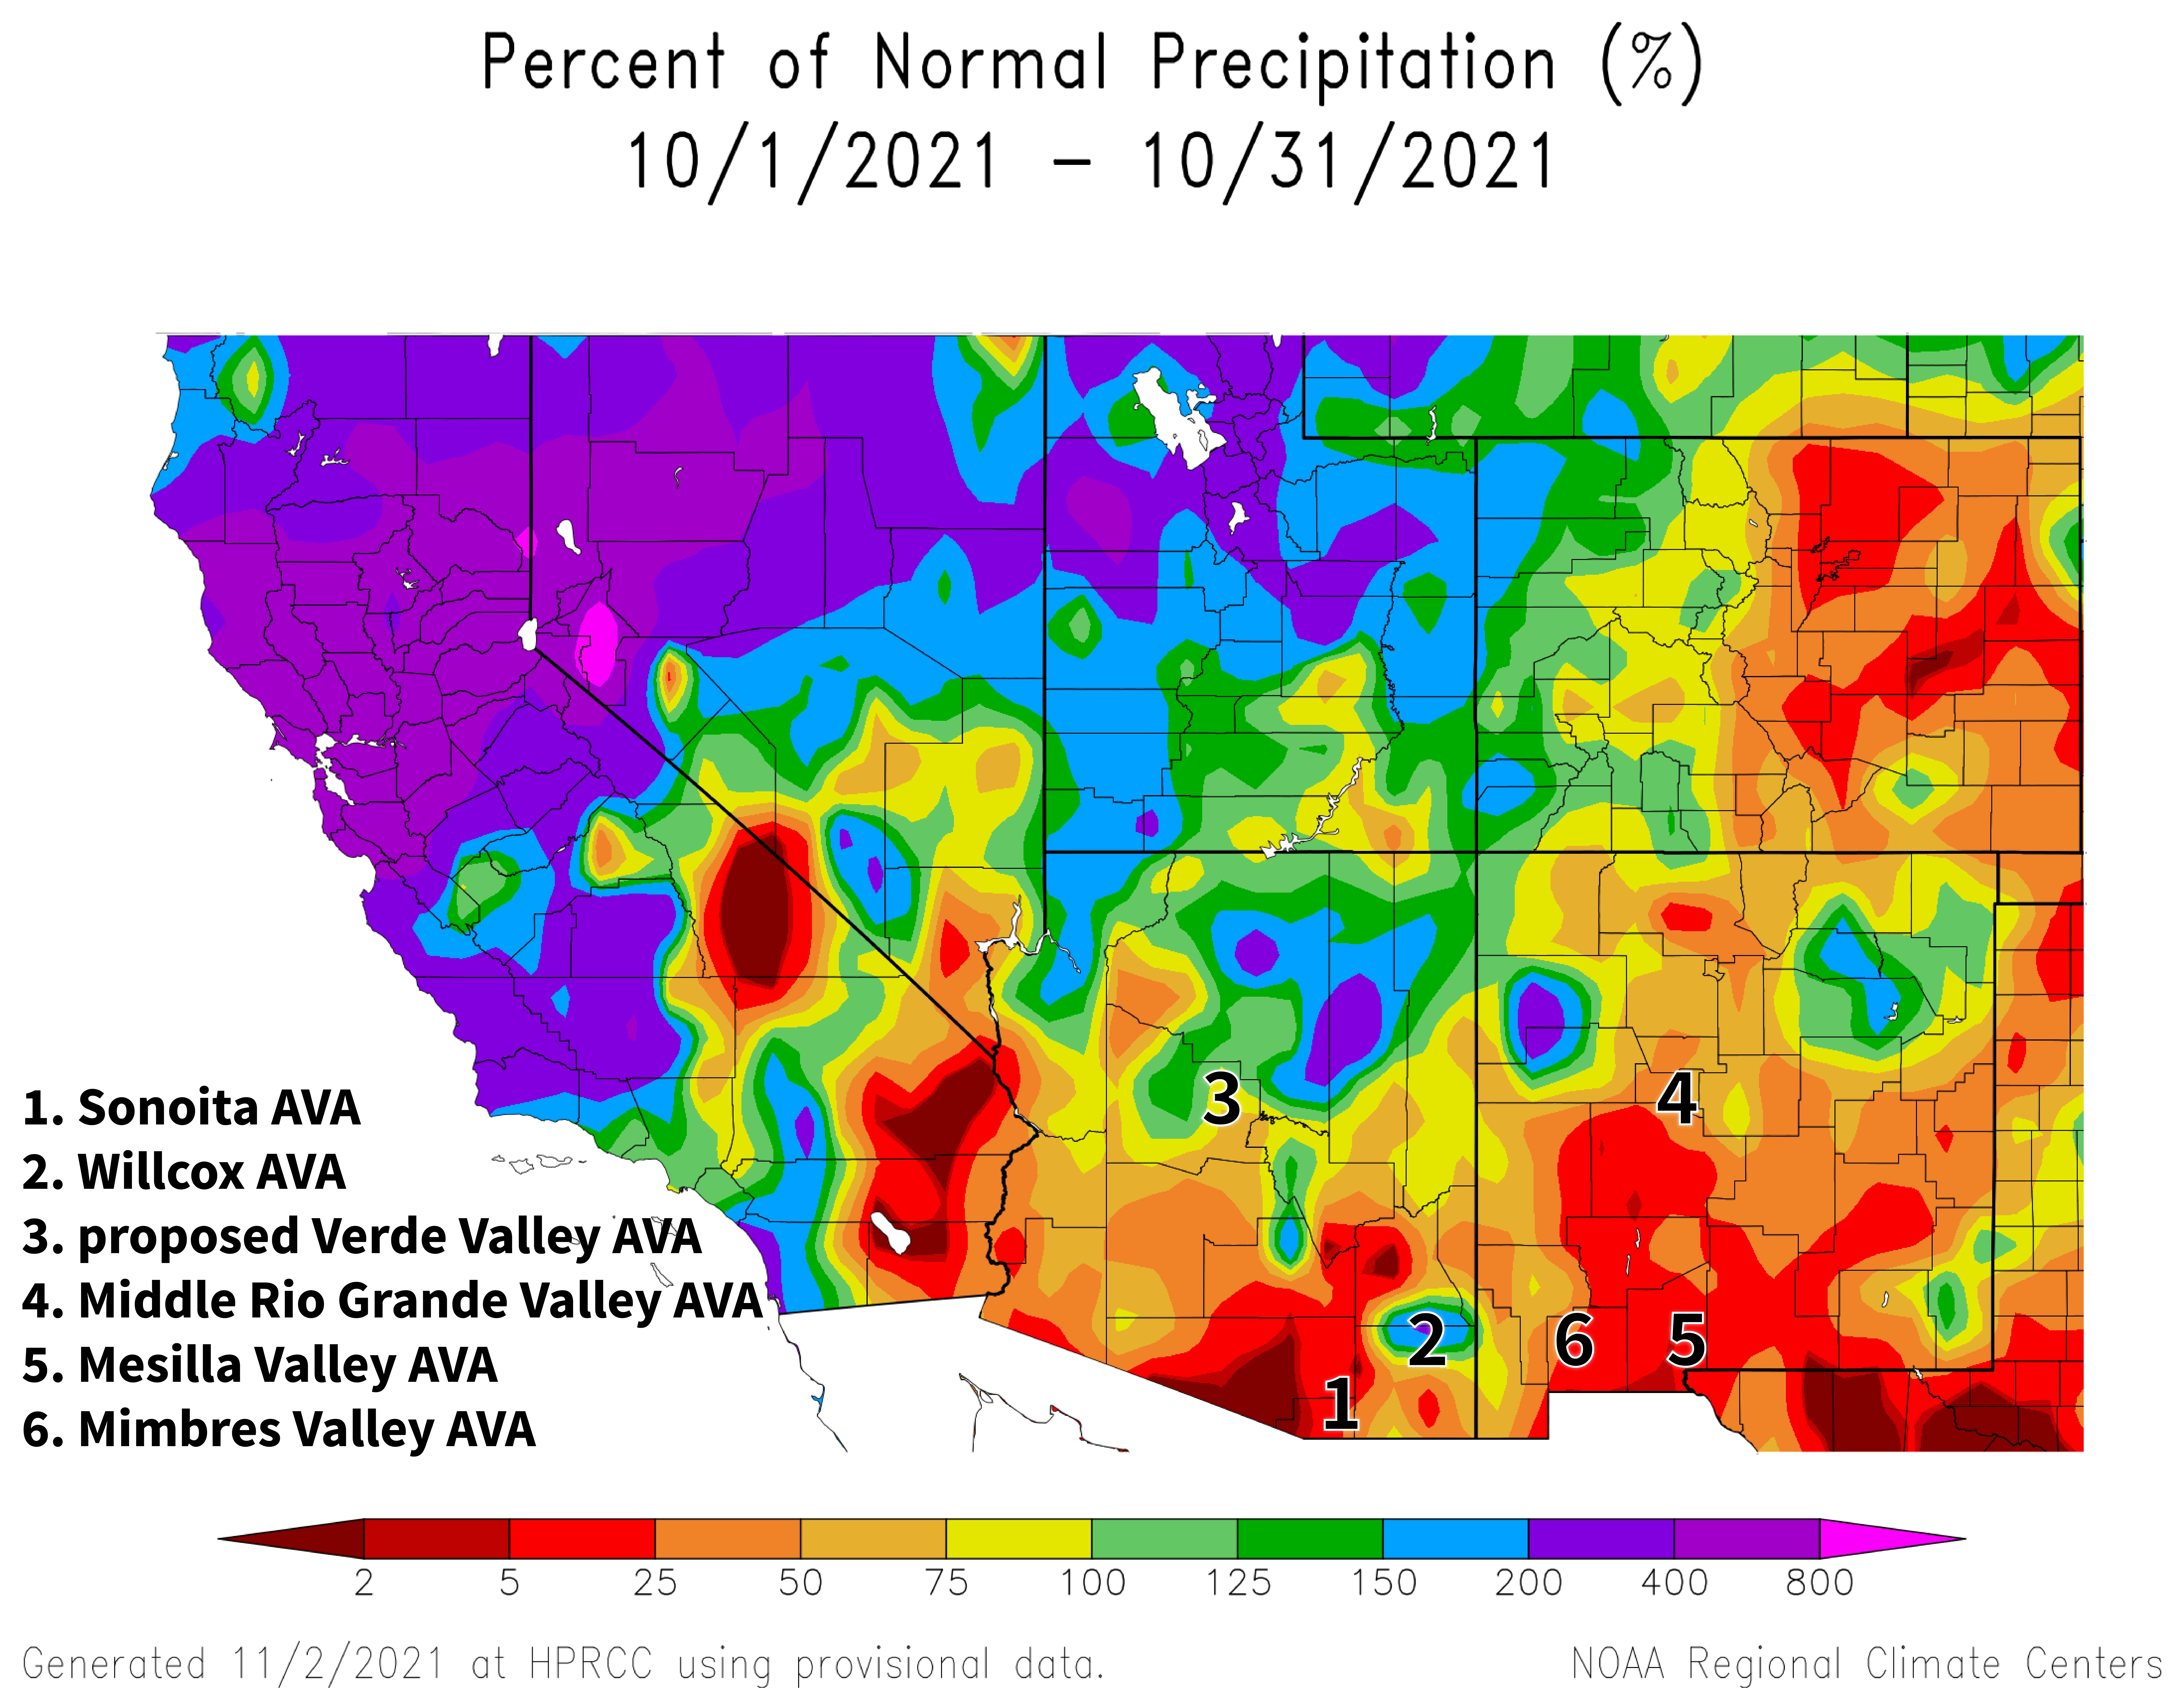
For the most part, only parts of northern Arizona and northern New Mexico received monthly precipitation totals near or above the 1991-2020 normal (yellow, green, blue, and purple areas on map). Otherwise, amounts were below 75 % of normal for the rest of the region (orange and red areas on map). Precipitation during October 2020 was below 75 % of the 1981-2010 normal for almost all of the region.
Perhaps it wasn’t surprising that October was on the dry side for many growing areas. There were no effects of tropical cyclones on the weather, which lined up with expectations in early summer of near- to below-normal overall activity for the eastern Pacific hurricane season. Plus, a ‘double-dip’ La Niña event continued to take shape. More on this below.
View more NOAA ACIS climate maps
NOAA ACIS
The Outlook for November Temperature and Precipitation
Temperatures for the coming month have moderate chances for being above the 1991-2020 normal for almost all of the region (dark orange area on map). Only across western Arizona and extreme northeastern New Mexico are such chances slightly less (orange area on map). As a comparison, monthly temperatures in November last year were 2 to 6 °F warmer than the 1981-2010 normal for almost all of the Southwest.
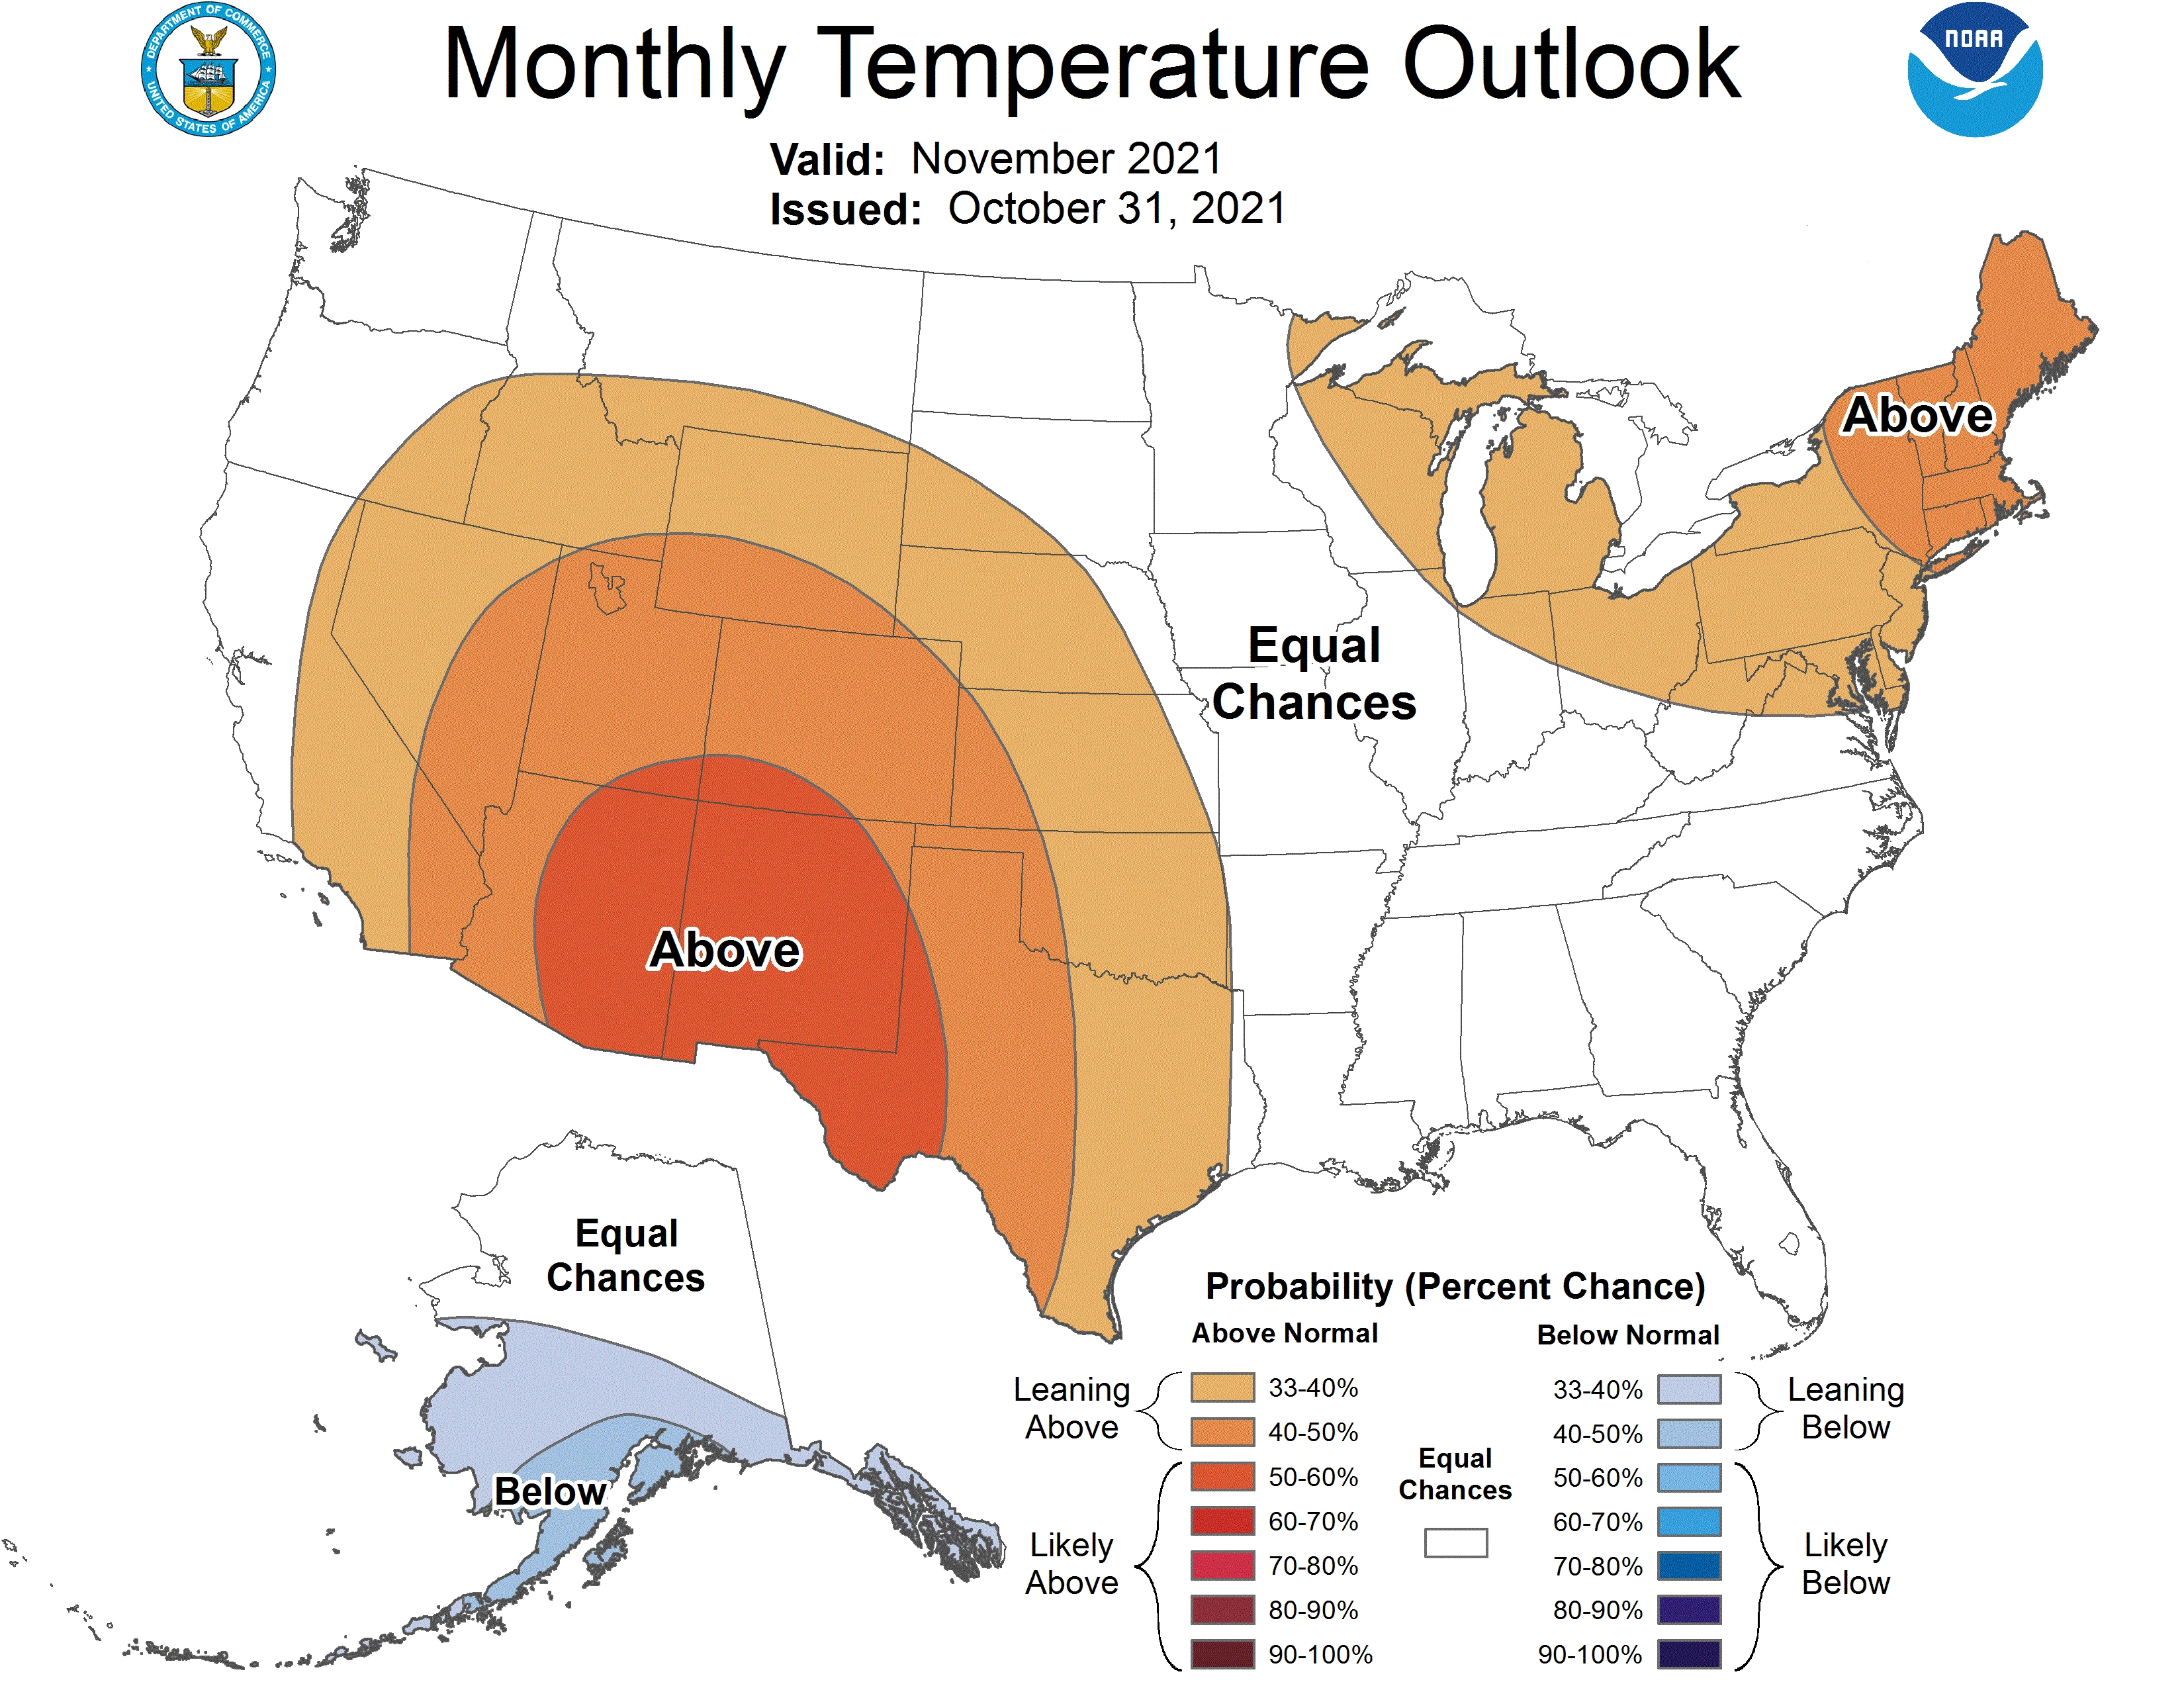
NOAA CPC
Precipitation totals for the coming month have slight chances for being below the 1991-2020 normal for almost all of the region (tan and light-brown areas on map). For extreme northwestern Arizona, there are equal chances for below-, near-, or above-normal amounts (white area on map). Precipitation during November 2020 was less than 50 % of the 1981-2010 normal for almost all of the region.
For those locations where vines escaped freezing temperatures in October relatively unscathed, the combination of dry conditions last month and the prospect for them to continue with warmer-than-normal temperatures this month might call for a soil moisture balancing act between promoting good progress towards dormancy and preventing the vineyard from drying out too much.
To stay informed of long-range temperature and precipitation possibilities beyond the coverage of a standard weather forecast, check in, too, with the six-to-ten-day outlook and eight-to-fourteen-day outlook issued daily by NOAA’s Climate Prediction Center.
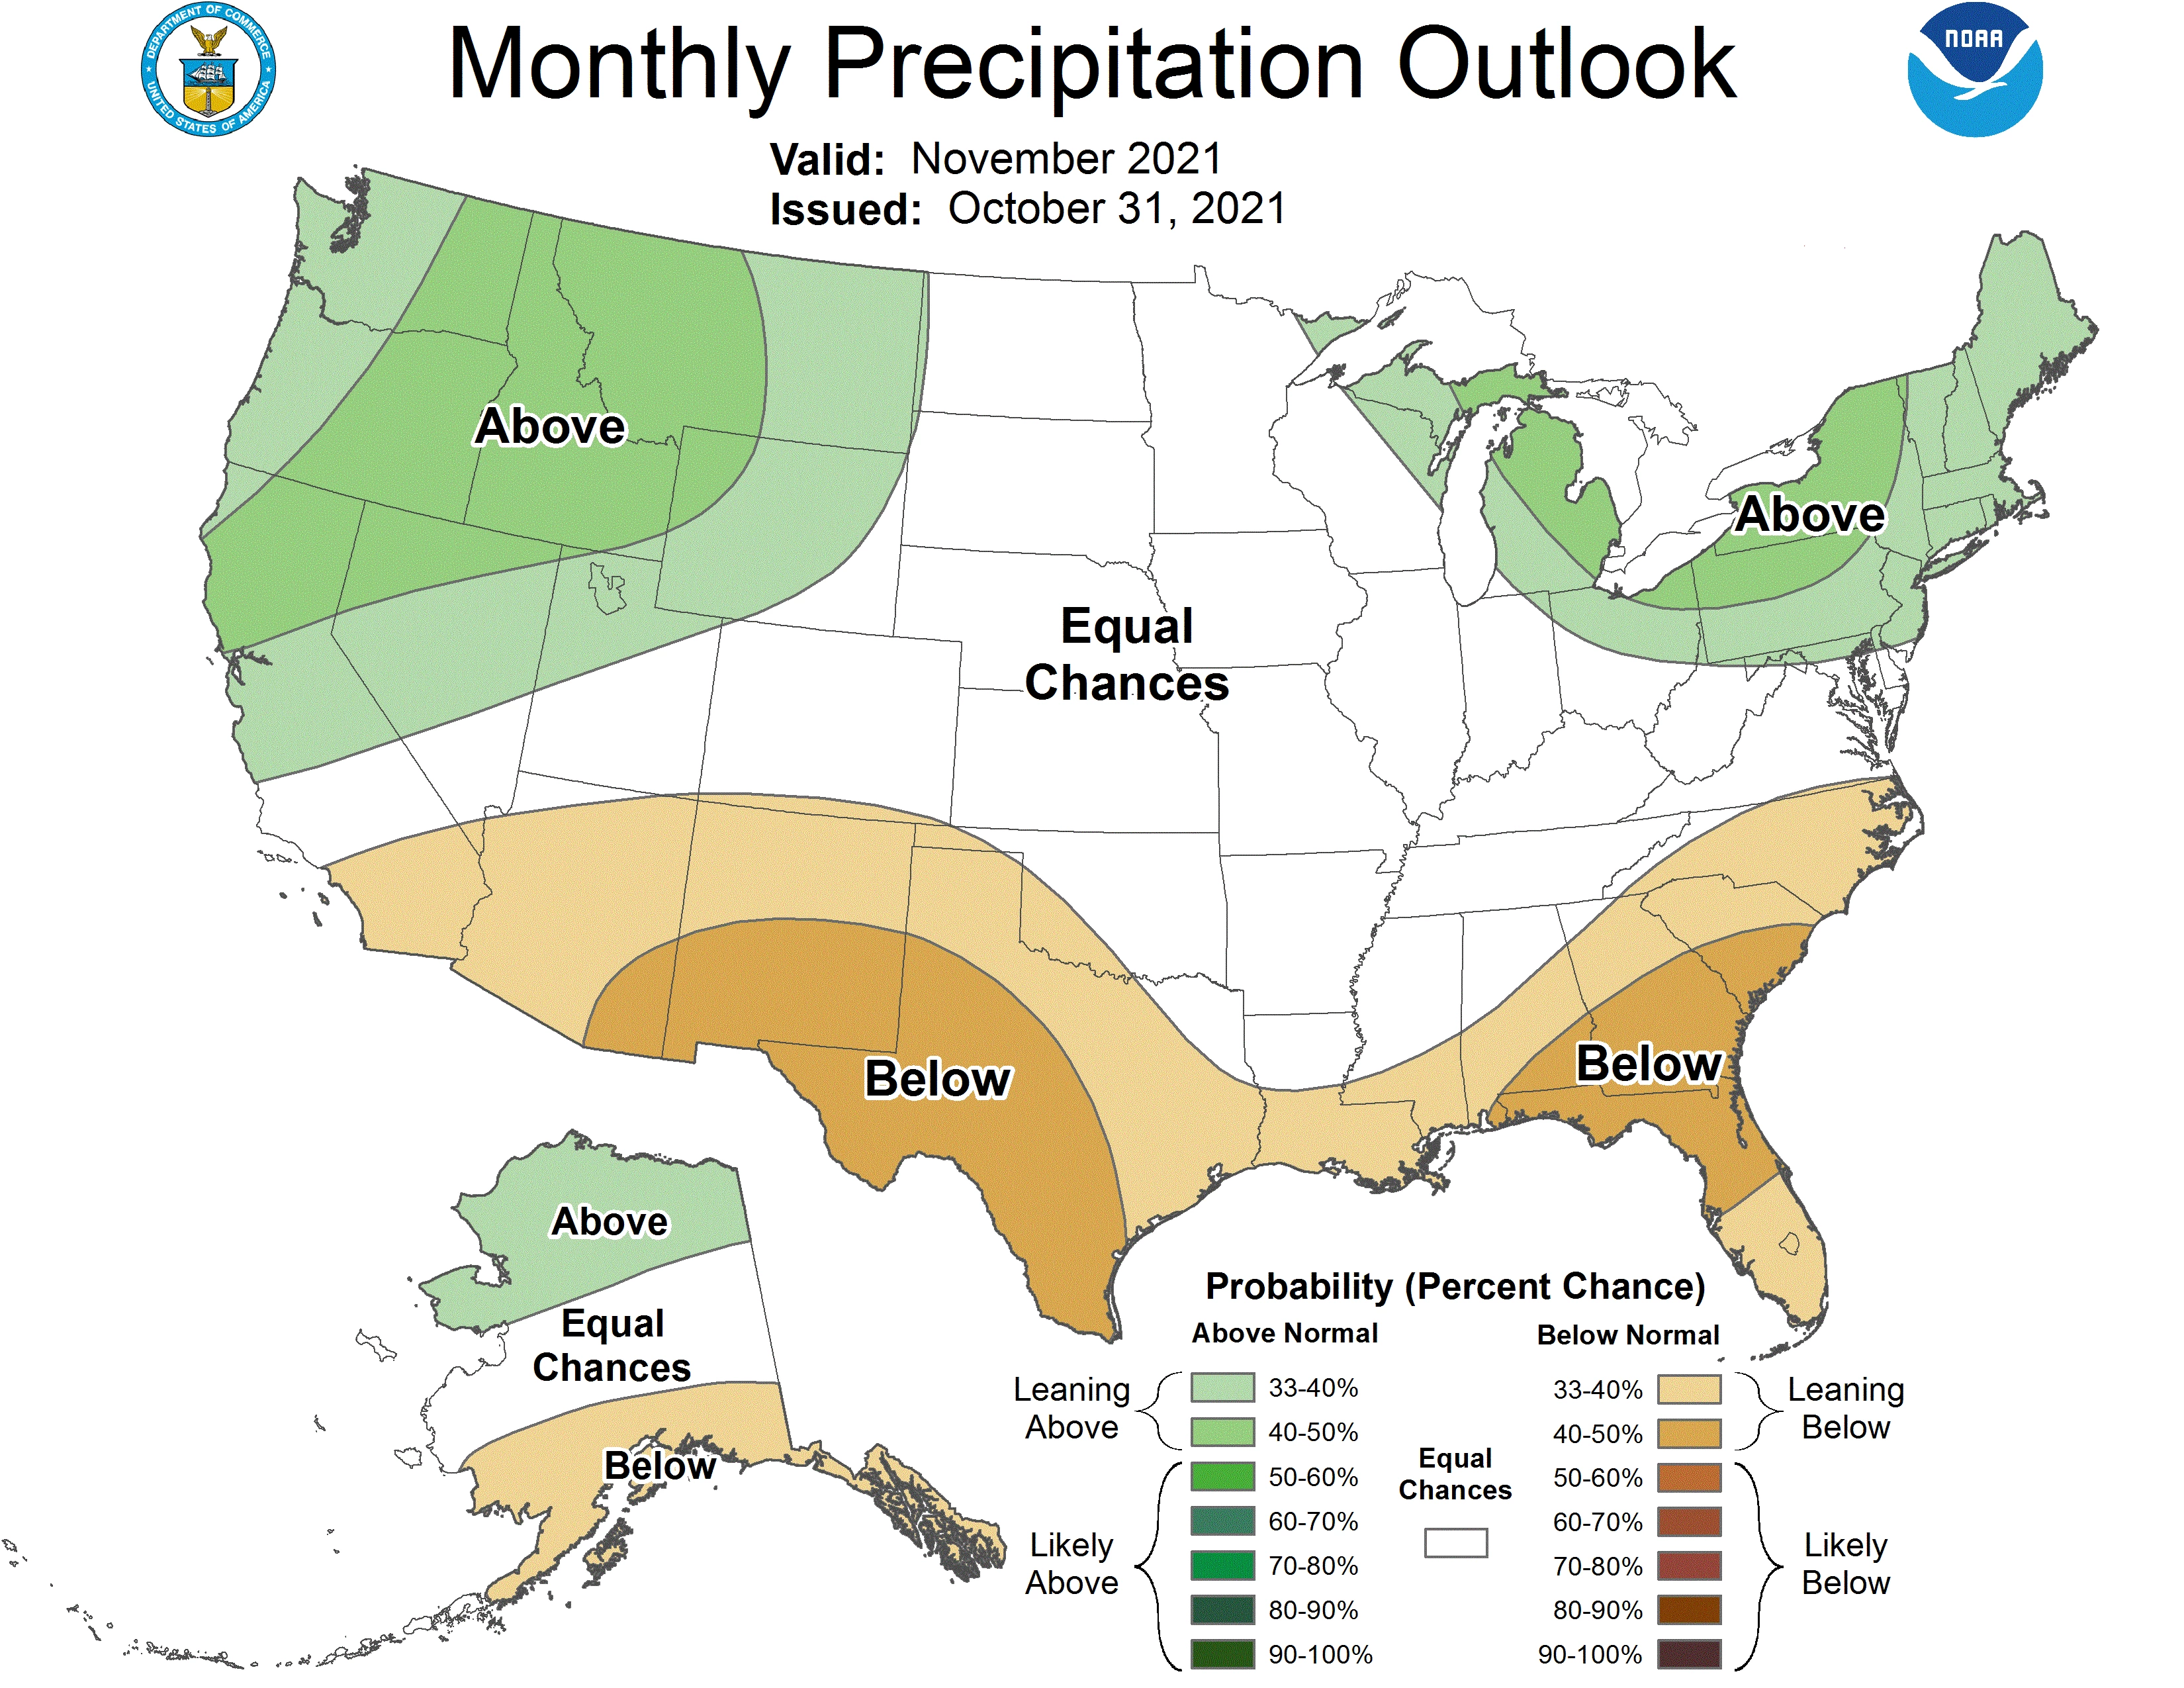
NOAA CPC
La Niña 2020-2021
The anticipated ‘double-dip’ La Niña event has arrived and will lead to La Niña conditions during our cool-season months for a second consecutive year. The most recent official forecast for ENSO, or El Niño Southern Oscillation – parts of the atmosphere and ocean across the tropical Pacific Ocean that cause El Niño and La Niña events – now has a 87 % chance for this event to continue through the winter. As we know, La Niña events generally mean below-average precipitation for the Southwest during the cooler months of the year, which won’t help the continuing regional drought conditions.
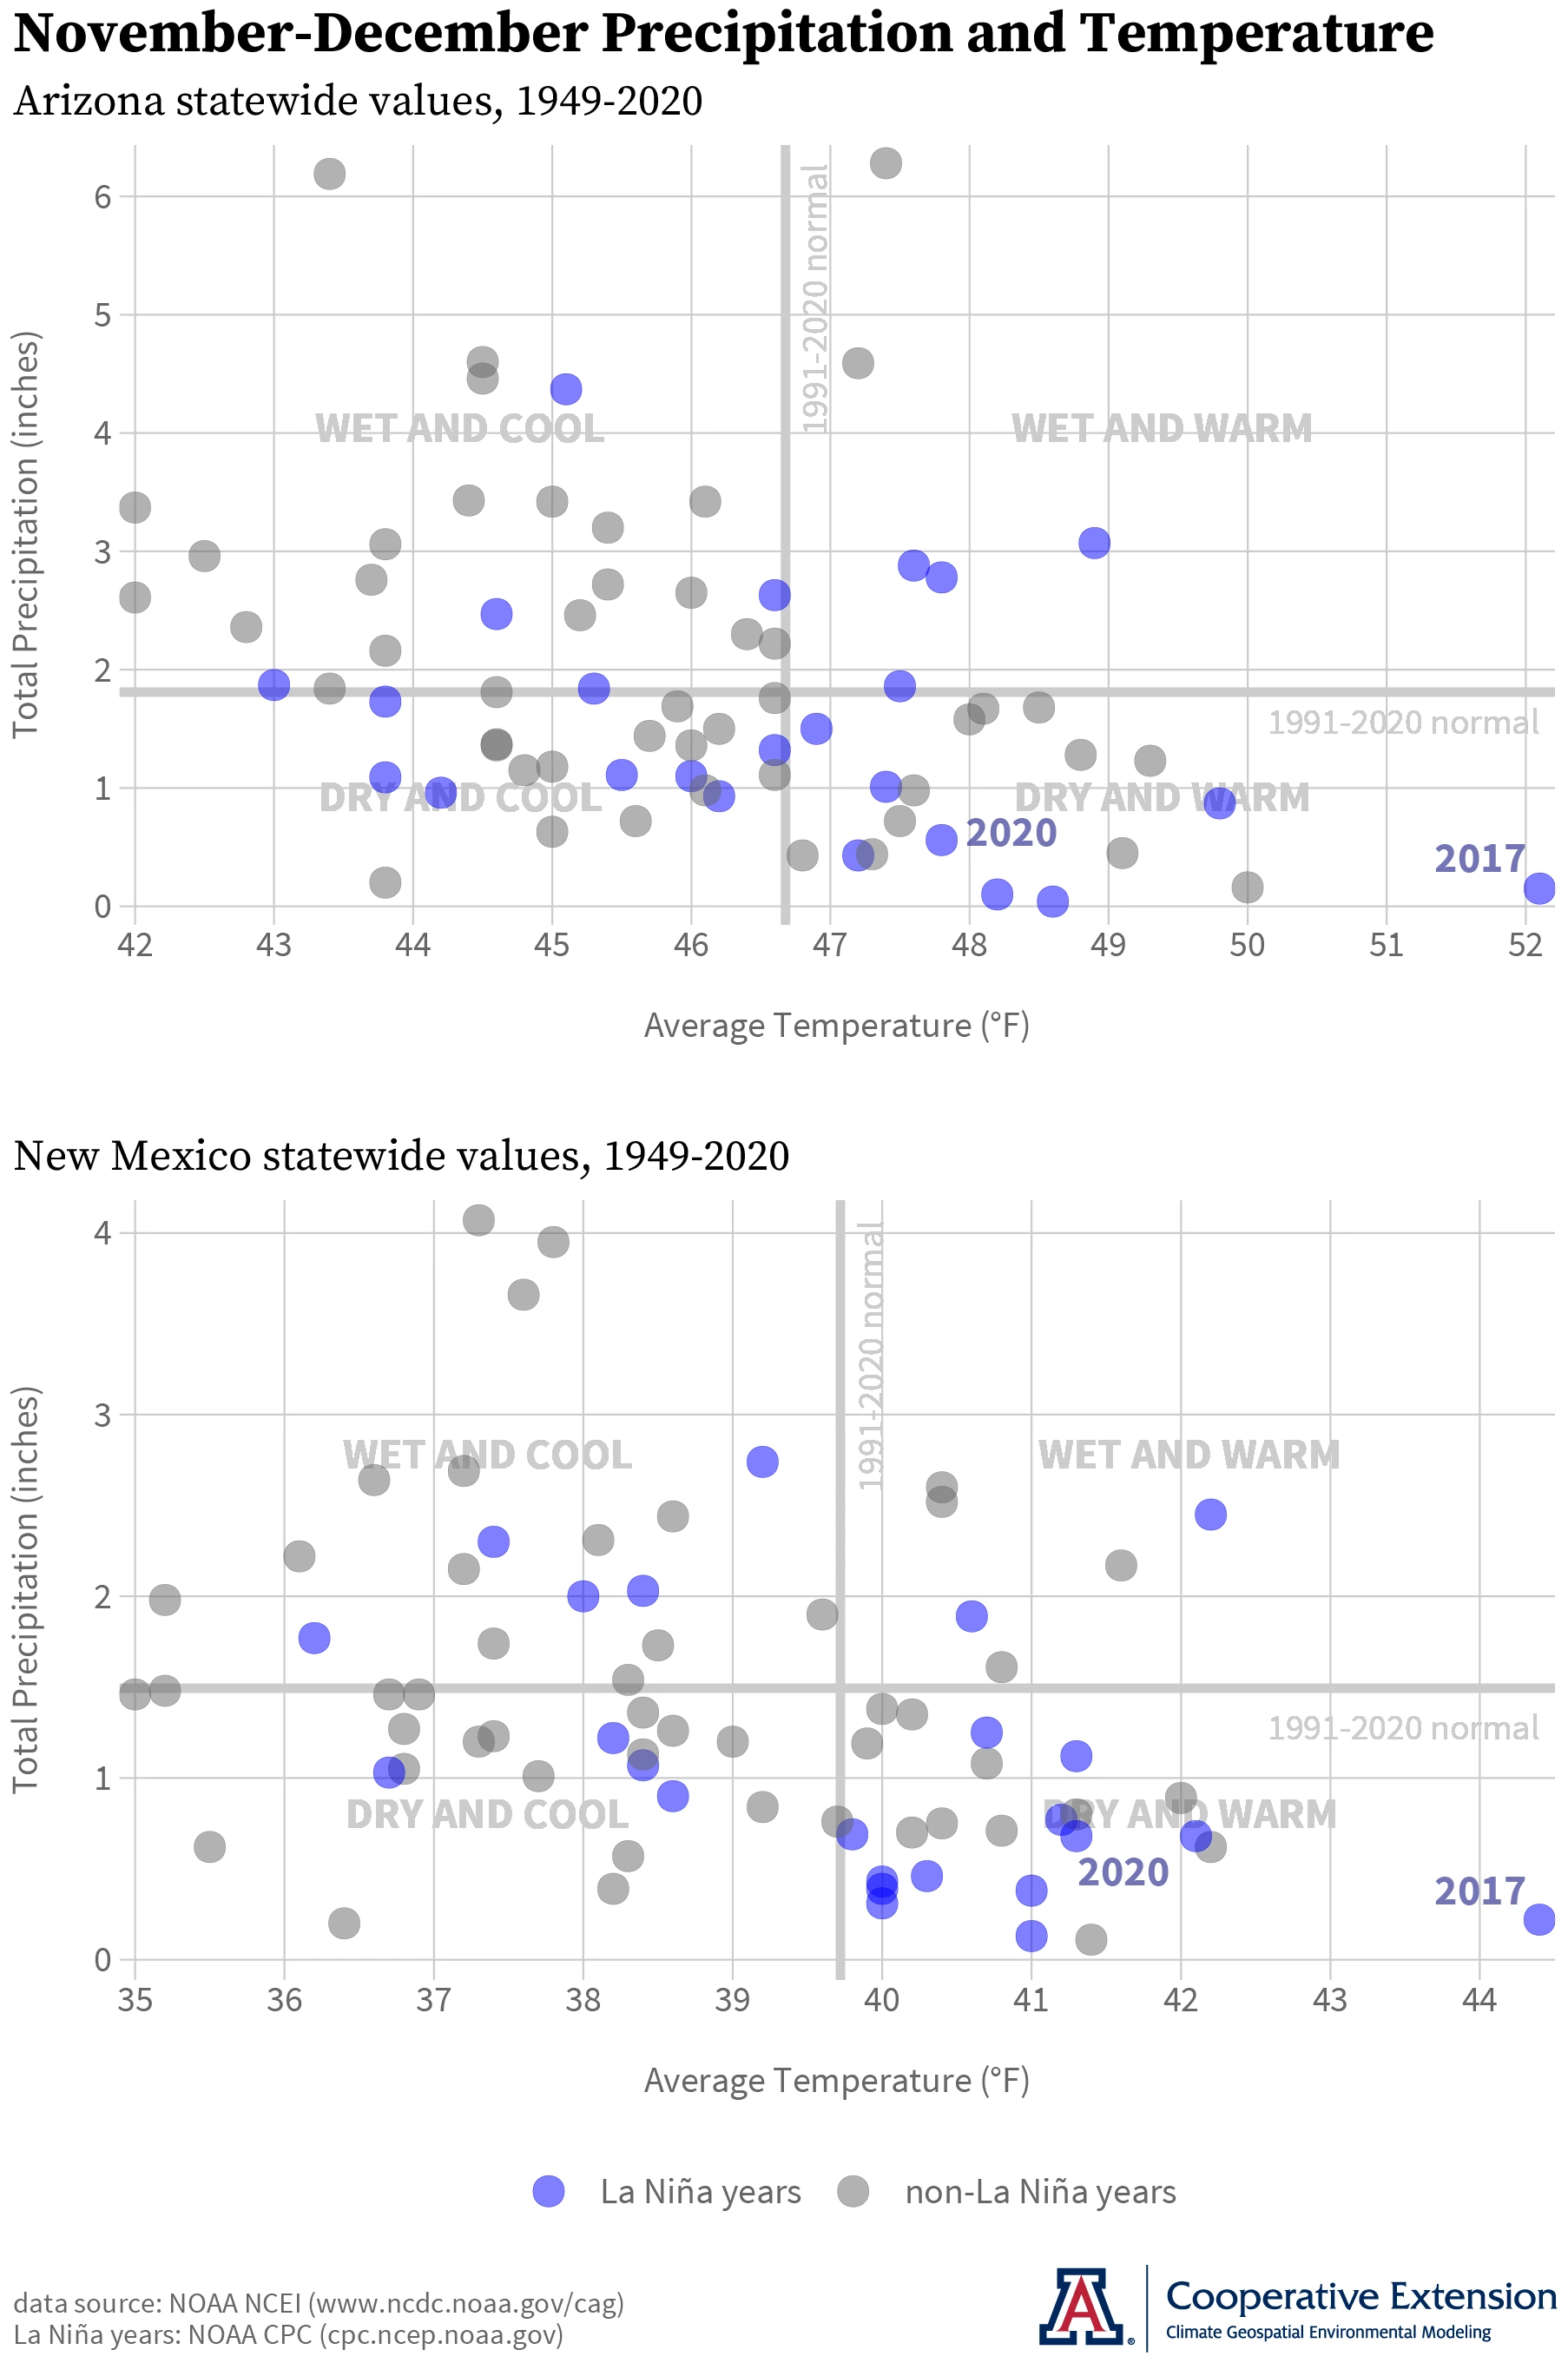
Focusing here on the last couple of months of the calendar year, total precipitation for the November-December period has been below the 1991-2020 normal for the majority of La Niña events since 1949 in both Arizona (blue dots below thick gray horizontal line in upper graph) and New Mexico (blue dots below thick gray horizontal line in lower graph). For temperatures averaged over this two-month period, below- and above-normal conditions are roughly more equal in number (blue dots to the left and right of thick gray vertical line in both graphs). La Niña events with below-normal precipitation often have occurred with above-normal temperatures (blue dots in the ‘Dry and Warm’ quadrant of both graphs), with events last year and in 2017 among them. This is the general direction that the November outlook above seems to have us going.
Jeremy Weiss
Dates are set for both editions of the 2021 ‘Growing Season in Review’ workshops for Arizona Winegrape Growers. The workshop in the Verde Valley is on November 9, and the one in southeastern Arizona is on November 16. Registration is open and free. As in the 2019 edition, grower-to-grower discussions will be front and center.
In case you missed the past couple of newsletters, there is a new study on the economic activity associated with state winegrape growing, winemaking, wine sales, and investments in vineyard and winery establishments. Produced by Ashley Bickel, Dari Duval, and George Frisvold from the Department of Agricultural and Resource Economics at the University of Arizona, the study also accounts for economic activity that is supported in other industries through linkages and presents information about the size, structure, and vertical integration of Arizona’s wine industry.
Undergraduate students in the College of Agriculture and Life Sciences at the University of Arizona are looking for internships with businesses and companies in the viticulture and winery industries during 2021. Please contact Danielle Buhrow, Senior Academic Advisor and Graduate Program Coordinator in the Department of Agricultural and Resource Economics, for more information.
For those of you in southeastern Arizona, Cooperative Extension manages an email listserv in coordination with the Tucson forecast office of the National Weather Service to provide information in the days leading up to agriculturally important events, like the first fall freeze and the first winter storm. Please contact us if you'd like to sign up.
Please feel free to give us feedback on this issue of the Climate Viticulture Newsletter, suggestions on what to include more or less often, and ideas for new topics.
Did someone forward you this newsletter? Please contact us to subscribe.
Have a wonderful November!
With support from:
