< Back to Climate Viticulture Newsletter
Hello, everyone!
This is the 2020 August issue of the Climate Viticulture Newsletter – a quick look at some timely climate topics relevant to winegrape growing in Arizona and New Mexico.
A Recap of July Temperature and Precipitation
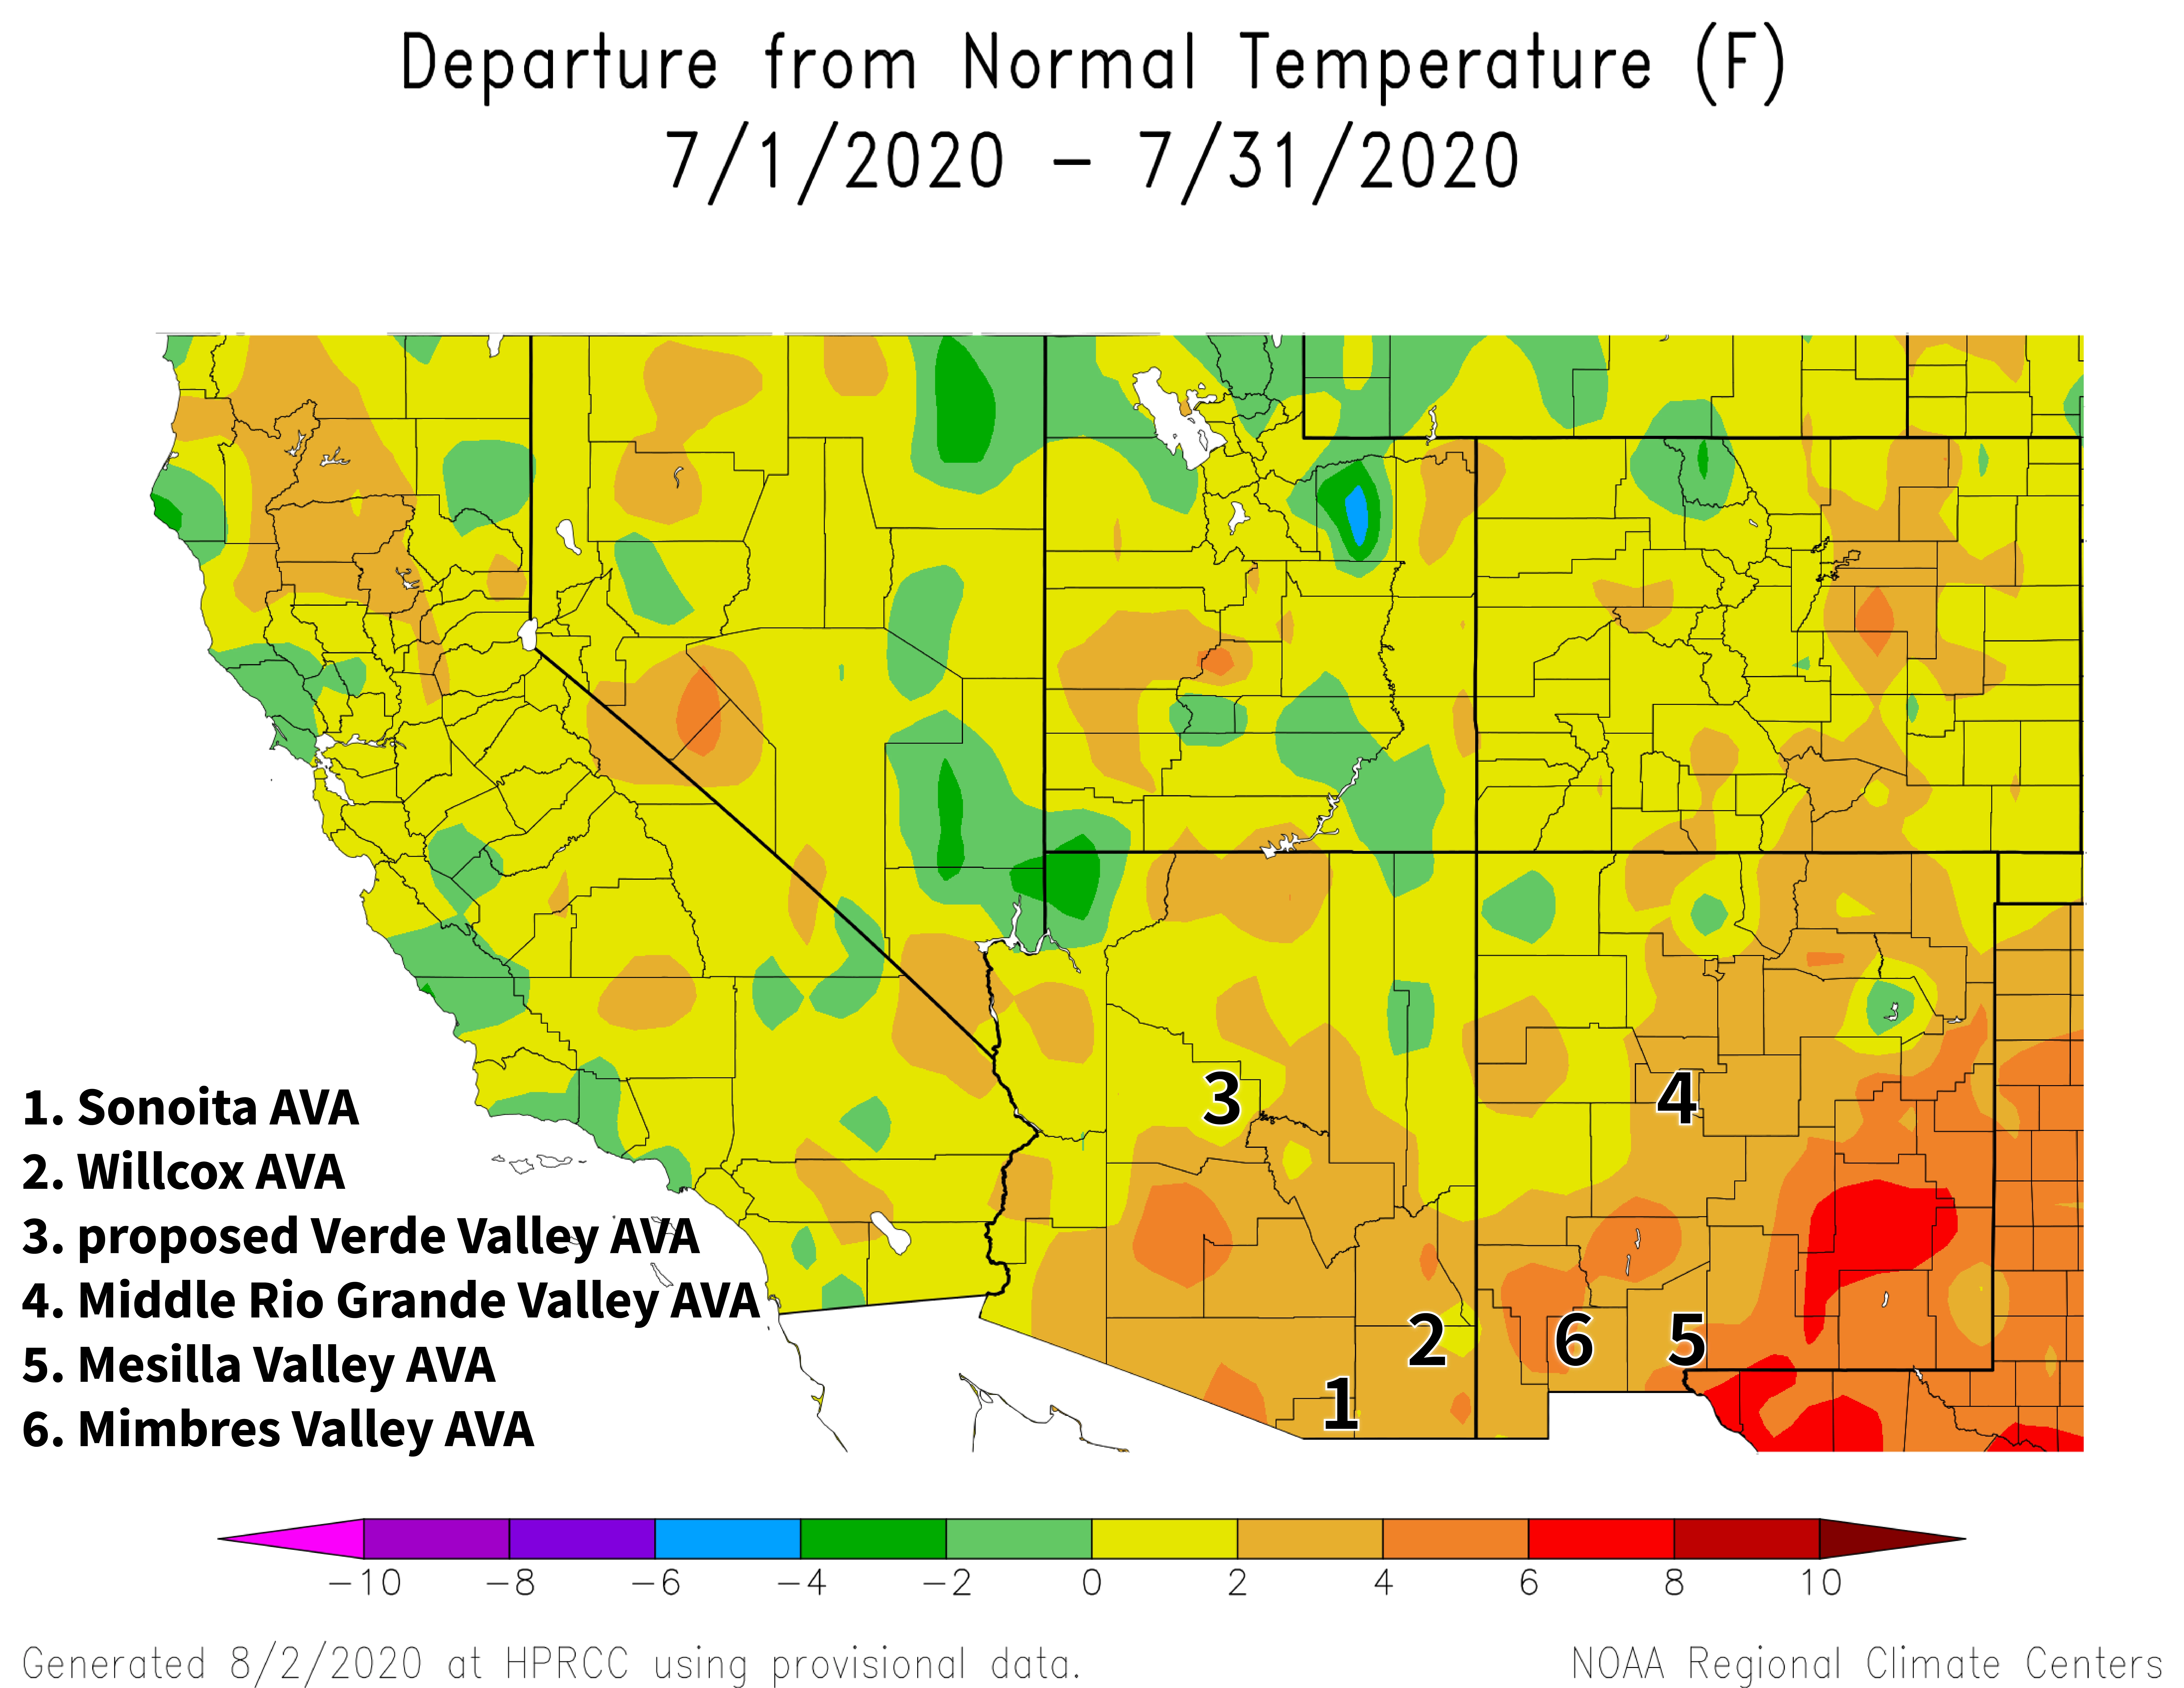
Average temperatures last month were near or up to 2°F warmer than the 1981-2010 normal for much of northern Arizona and northwestern New Mexico (yellow areas on map) and 2°F to 6°F warmer for almost all of southern Arizona and northeastern and southern New Mexico (light and dark orange areas on map). Near-record and record heat was part of the reason why. For established vineyards, canopy management, irrigation, and cover crops can be part of a grower’s toolbox to help minimize damage to vines and fruit when conditions get too hot. Consider adding row orientation and rootstocks to the toolbox if new plantings are planned. Temperatures during July last year were near or up to 4°F above normal in many areas.
NOAA ACIS
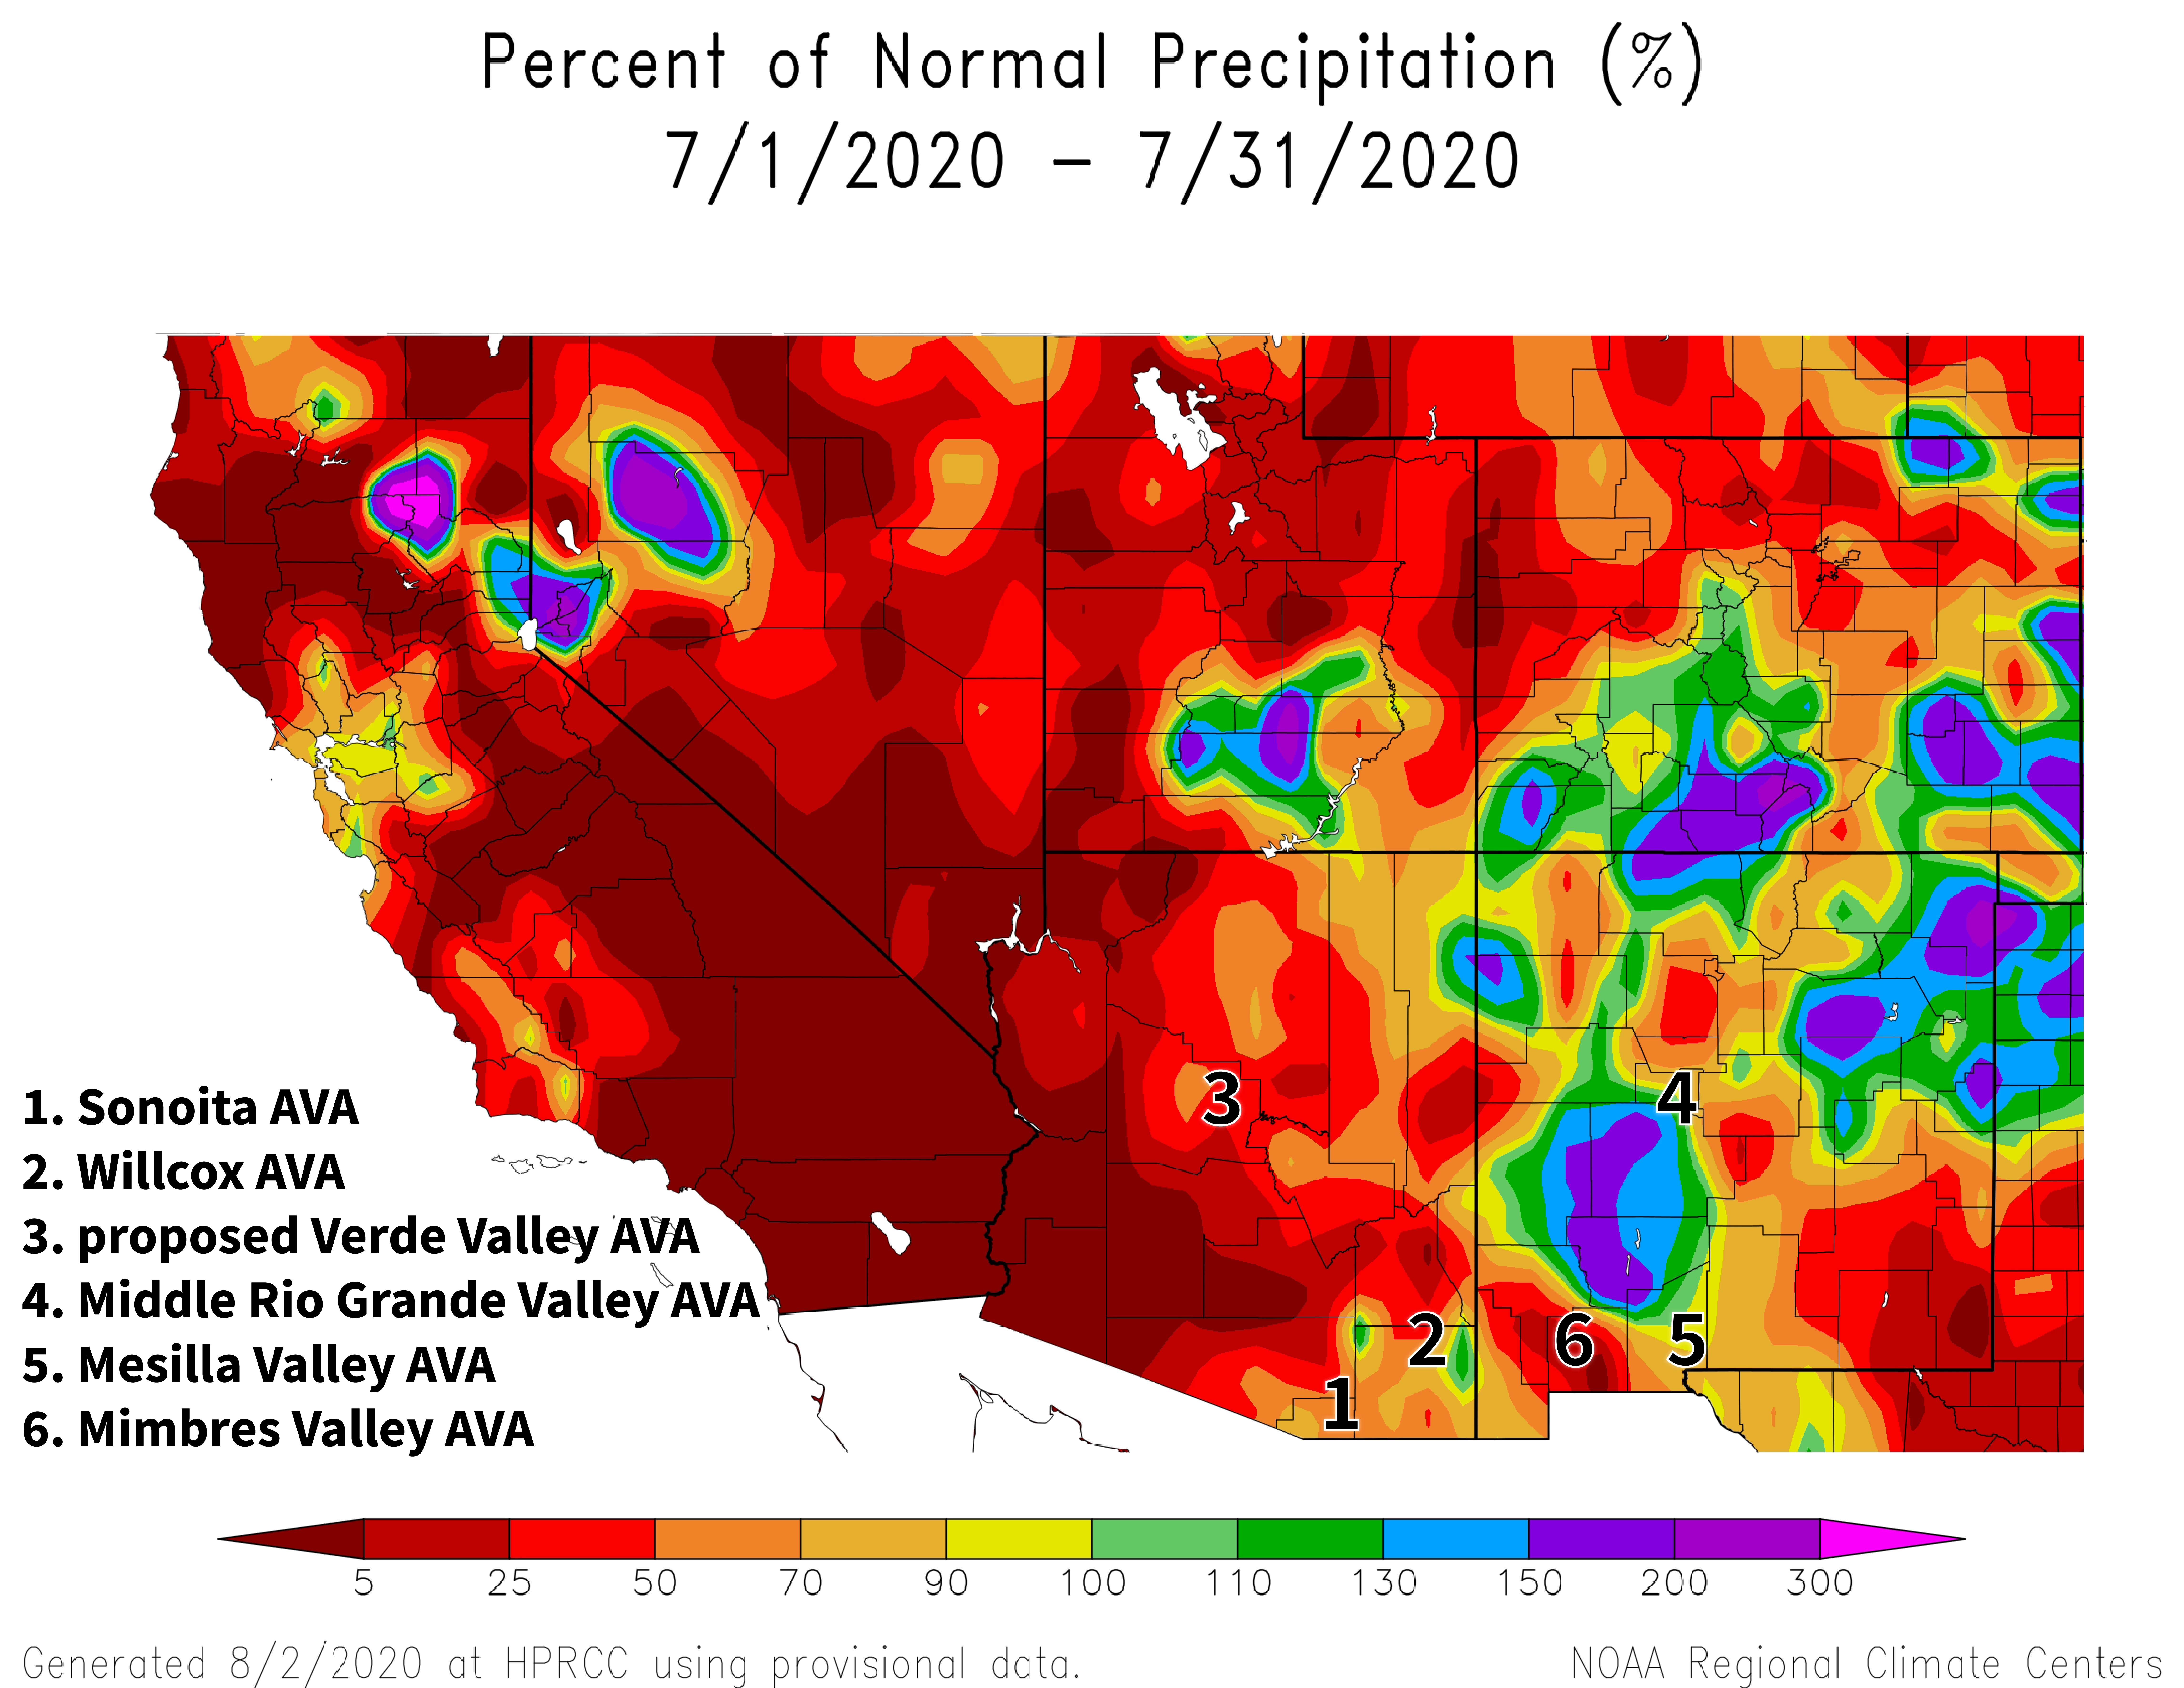
A late start to and a weak first half of the monsoon led to monthly precipitation totals that were below 70% of normal for most of Arizona (dark orange and red areas on map). This also was the case for several areas in New Mexico, but others received above-average amounts, particularly in the northern part of the state (dark green, blue, and purple areas on map). Precipitation totals for July last year were a similar story. Based on your comments from the 2019 Growing Season Review, a missing monsoon has both pluses such as “very little pest” and “easier to produce a quality crop” and minuses like “more irrigation” when vineyards “normally turn back water consumption”.
NOAA ACIS
The Outlook for August Temperature and Precipitation
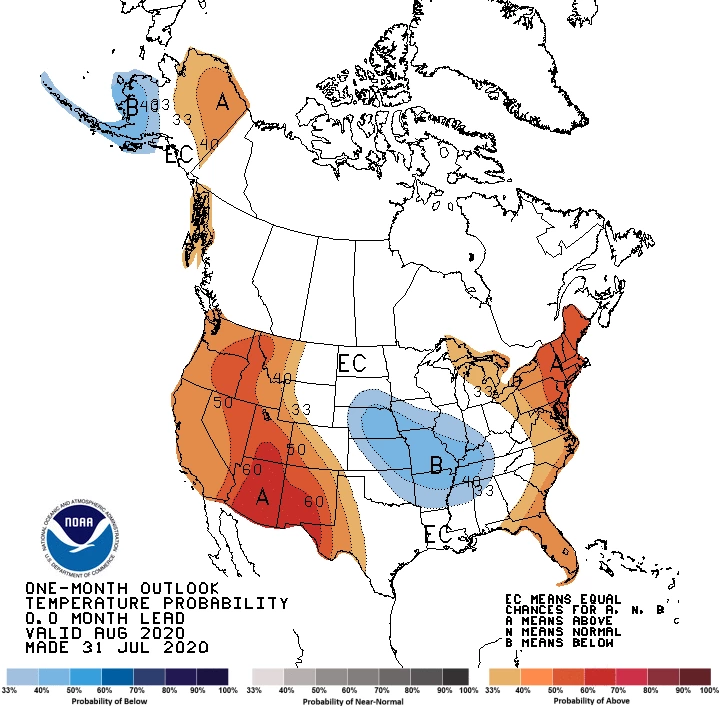
There is a moderate increase in chances for above-average temperatures across all of Arizona and the western two-thirds of New Mexico (dark orange and red areas on map). A slight increase in chances for above-average temperatures exists for the eastern third of New Mexico (lighter orange colors on map). In August 2019, temperatures were 2°F to 6°F above normal for much of the region. For relatively cooler growing areas, warmer-than-normal temperatures this time last year coincided with more growth on young vines at one vineyard. In relatively warmer ones, they were a factor that led to “a compact ripening period” in which Brix rose rapidly from the “low 20s to high 20s in 96 hours” at another. This dichotomy of impacts from above-normal temperatures is seen in many aspects of viticulture.
NOAA CPC
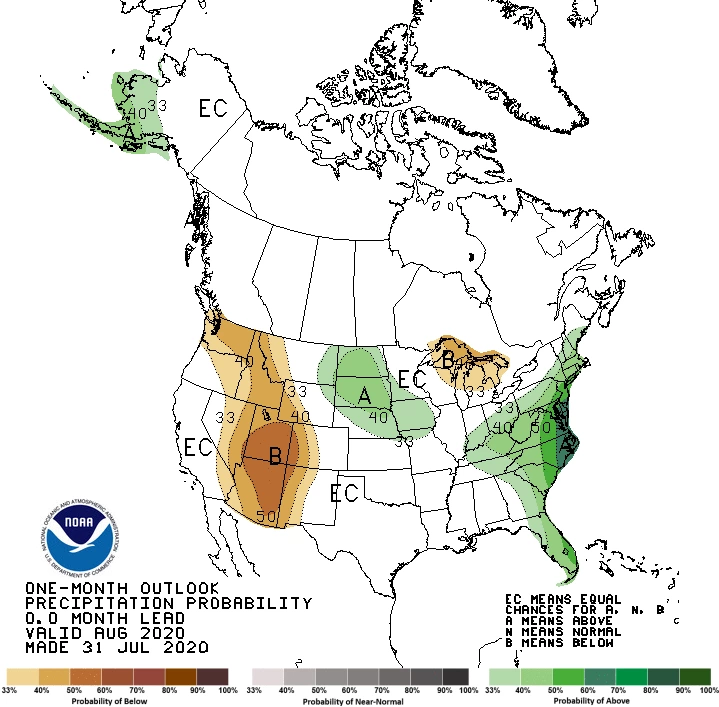
Expectations continue for a weak monsoon. A moderate increase in chances for below-normal precipitation exists for much of northern and eastern Arizona (brown area on map), whereas a slight increase in chances for below-normal precipitation covers the rest of the state as well as western New Mexico (light brown and tan areas on map). Equal chances for above-, near-, or below-normal precipitation exist for eastern New Mexico (white area on map). Monthly precipitation totals in August 2019 were less than 75% of normal for much of the region. With hot and dry conditions apparently on tap for the ripening period once again in 2020, field notes from last year could be a valuable reference.
NOAA CPC
Heat Accumulation So Far This Year
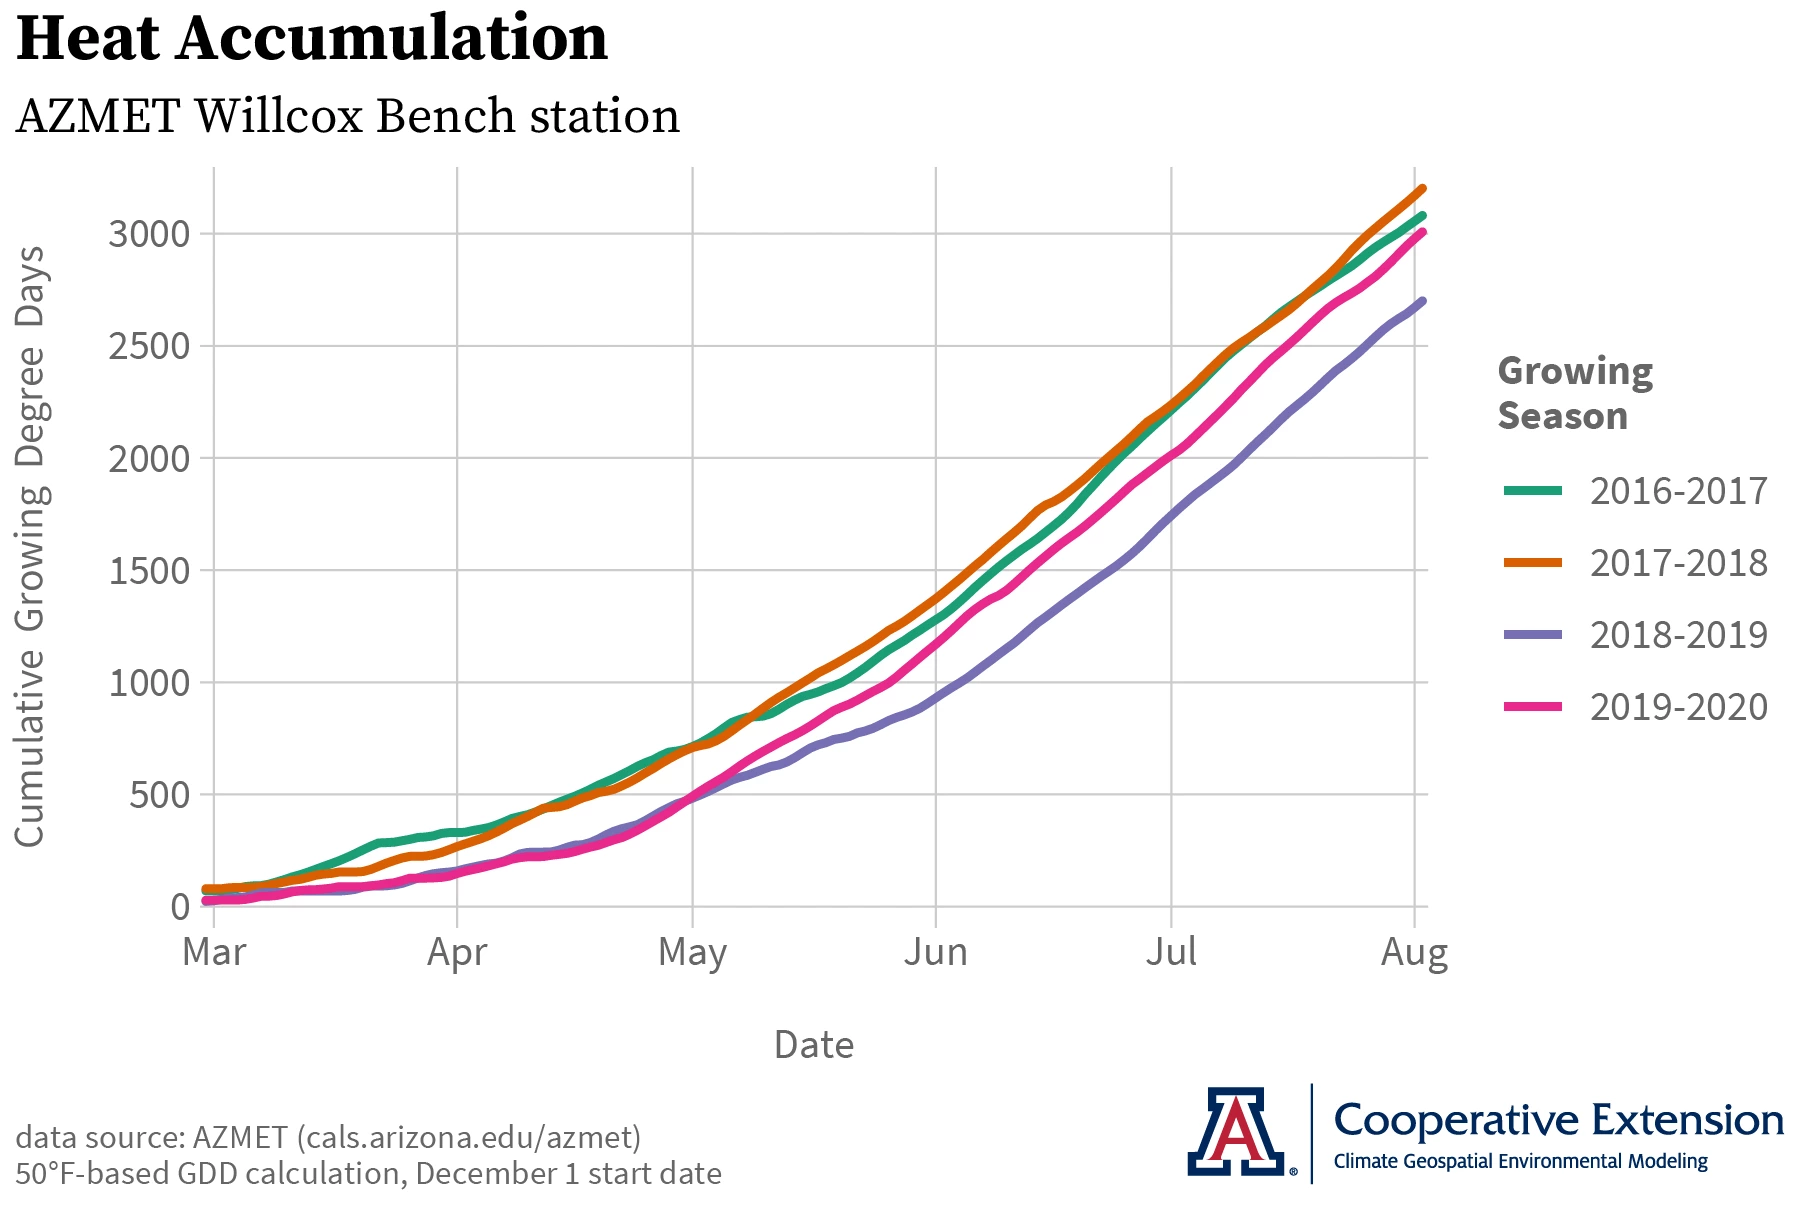
At the Arizona Meteorological (AZMET) Network Willcox Bench station in the south-central Willcox AVA, above-average temperatures last month once again kept cumulative growing degree days above the level they were at this time last year (pink and purple lines on graph), and closer to levels during 2018 and 2017 (orange and green lines on graph). Timing of vine growth stages near this location now looks to be ahead of last year and more similar to that of two and three years ago. Based on growing-degree-day information from the National Phenology Network, this also appears to be the case for other locations in the Willcox, Sonoita, and proposed Verde Valley AVAs in Arizona, as well as the Mesilla Valley, Mimbres Valley, and Middle Rio Grande Valley AVAs in New Mexico. As noted last month, however, effects of heat stress on phenology are not part of this cumulative growing degree day calculation, which could lead this assessment astray. Please let us know how growth stages this year compare to previous years in your vineyard, as we work to better understand the effects of this phenomenon in the region.
Jeremy Weiss
Temperature Ranges and the Ripening Period
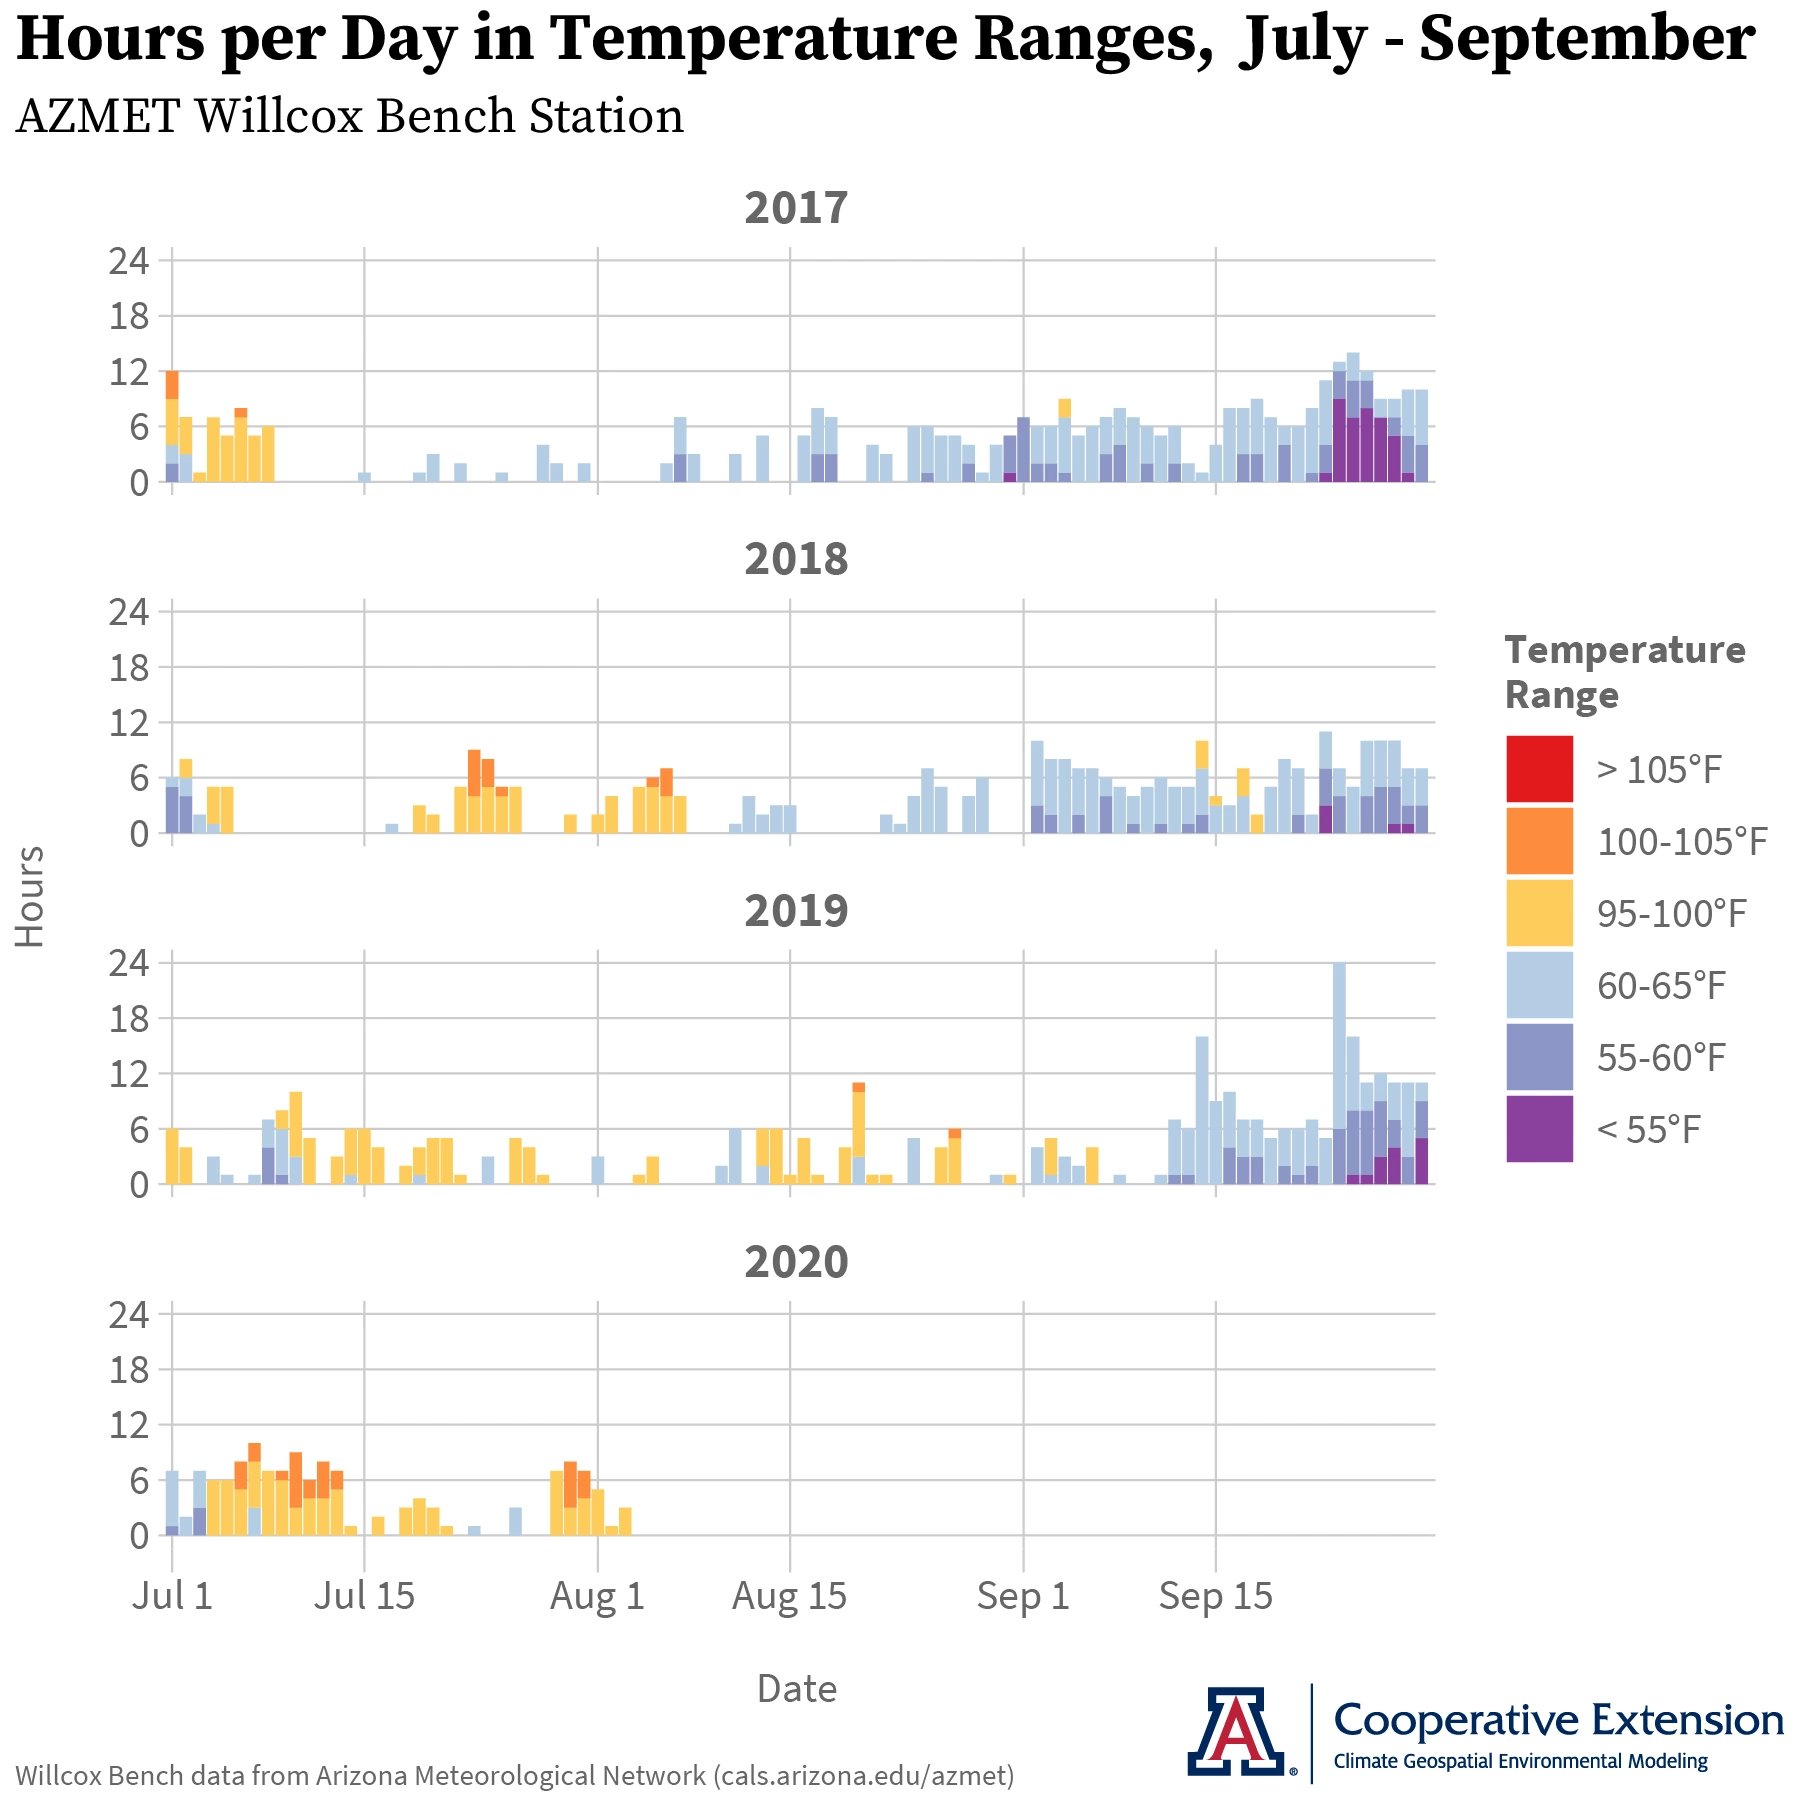
In addition to slowing down the growth rate of vines, high temperatures also affect fruit quality. But, effects are not limited to just daily maximums during the afternoon. How much daily minimum temperatures cool off at night, for example, may influence how much malic acid is consumed by respiration. Curious to learn more about this climatic context, Jesse Noble at Merkin Vineyards asked us to crunch the numbers for a few temperature ranges at the AZMET Willcox Bench station. So far in 2020, the number of hours above 95°F (orange and red bars on graph) during the ripening period are similar to those in 2019 and 2018, as are hours below 65°F (blue and purple bars on graph). Hours in the different temperature ranges during these three years are different from those in 2017, most notably from the lack of hours above 95°F during the latter part of July of that year. Please let us know if you would like us to run this analysis with hourly temperature data from your vineyard.
Jeremy Weiss
Once again, the latest forecast for ENSO (El Niño Southern Oscillation) – parts of the atmosphere and ocean across the tropical Pacific Ocean that cause El Niño and La Niña events – puts roughly equal chances on neutral or La Niña conditions happening this fall and winter. These conditions favor near- or below-normal hurricane activity to the west of Mexico and Central America, which may reduce our late-summer and early-autumn precipitation.
Isaac Mpanga, Area Associate Agent with Cooperative Extension in the Verde Valley, is leading a monthly series of remote meetings for commercial horticulture and small-scale farmers to share science-based information on topics like pests, diseases, marketing, and food safety. The goal is to help improve farm productivity, profitability, sustainability, and food security. Please email yavapaipres@cals.arizona.edu to register. The next meeting is August 17.
Estimates of winegrape water use for southeastern Arizona from AZMET are back in production after a brief hiatus. Please contact us to sign up for a weekly email that forwards this information. Thanks to Mark Jorve at Zarpara Vineyards for helping to get this effort up and running again.
For those of you in southeastern Arizona, Cooperative Extension manages an email listserv in coordination with the Tucson forecast office of the National Weather Service to provide information in the days leading up to agriculturally important events, like record-high temperatures and severe monsoon storms. Please contact us if you'd like to sign up.
Please feel free to give us feedback on this issue of the Climate Viticulture Newsletter, suggestions on what to include more or less often, and ideas for new topics.
Did someone forward you this newsletter? Please contact us to subscribe.
Have a wonderful August!
With support from:
