< Back to Climate Viticulture Newsletter
Hello, everyone!
This is the August 2025 issue of the Climate Viticulture Newsletter – a quick look at some timely climate topics relevant to wine grape growing in Arizona.
IN THIS ISSUE
- A Recap of July Temperature and Precipitation
- The Outlook for August Temperature and Precipitation
- Heat Accumulation during the Growing Season
- Extra Notes
A Recap of July Temperature and Precipitation
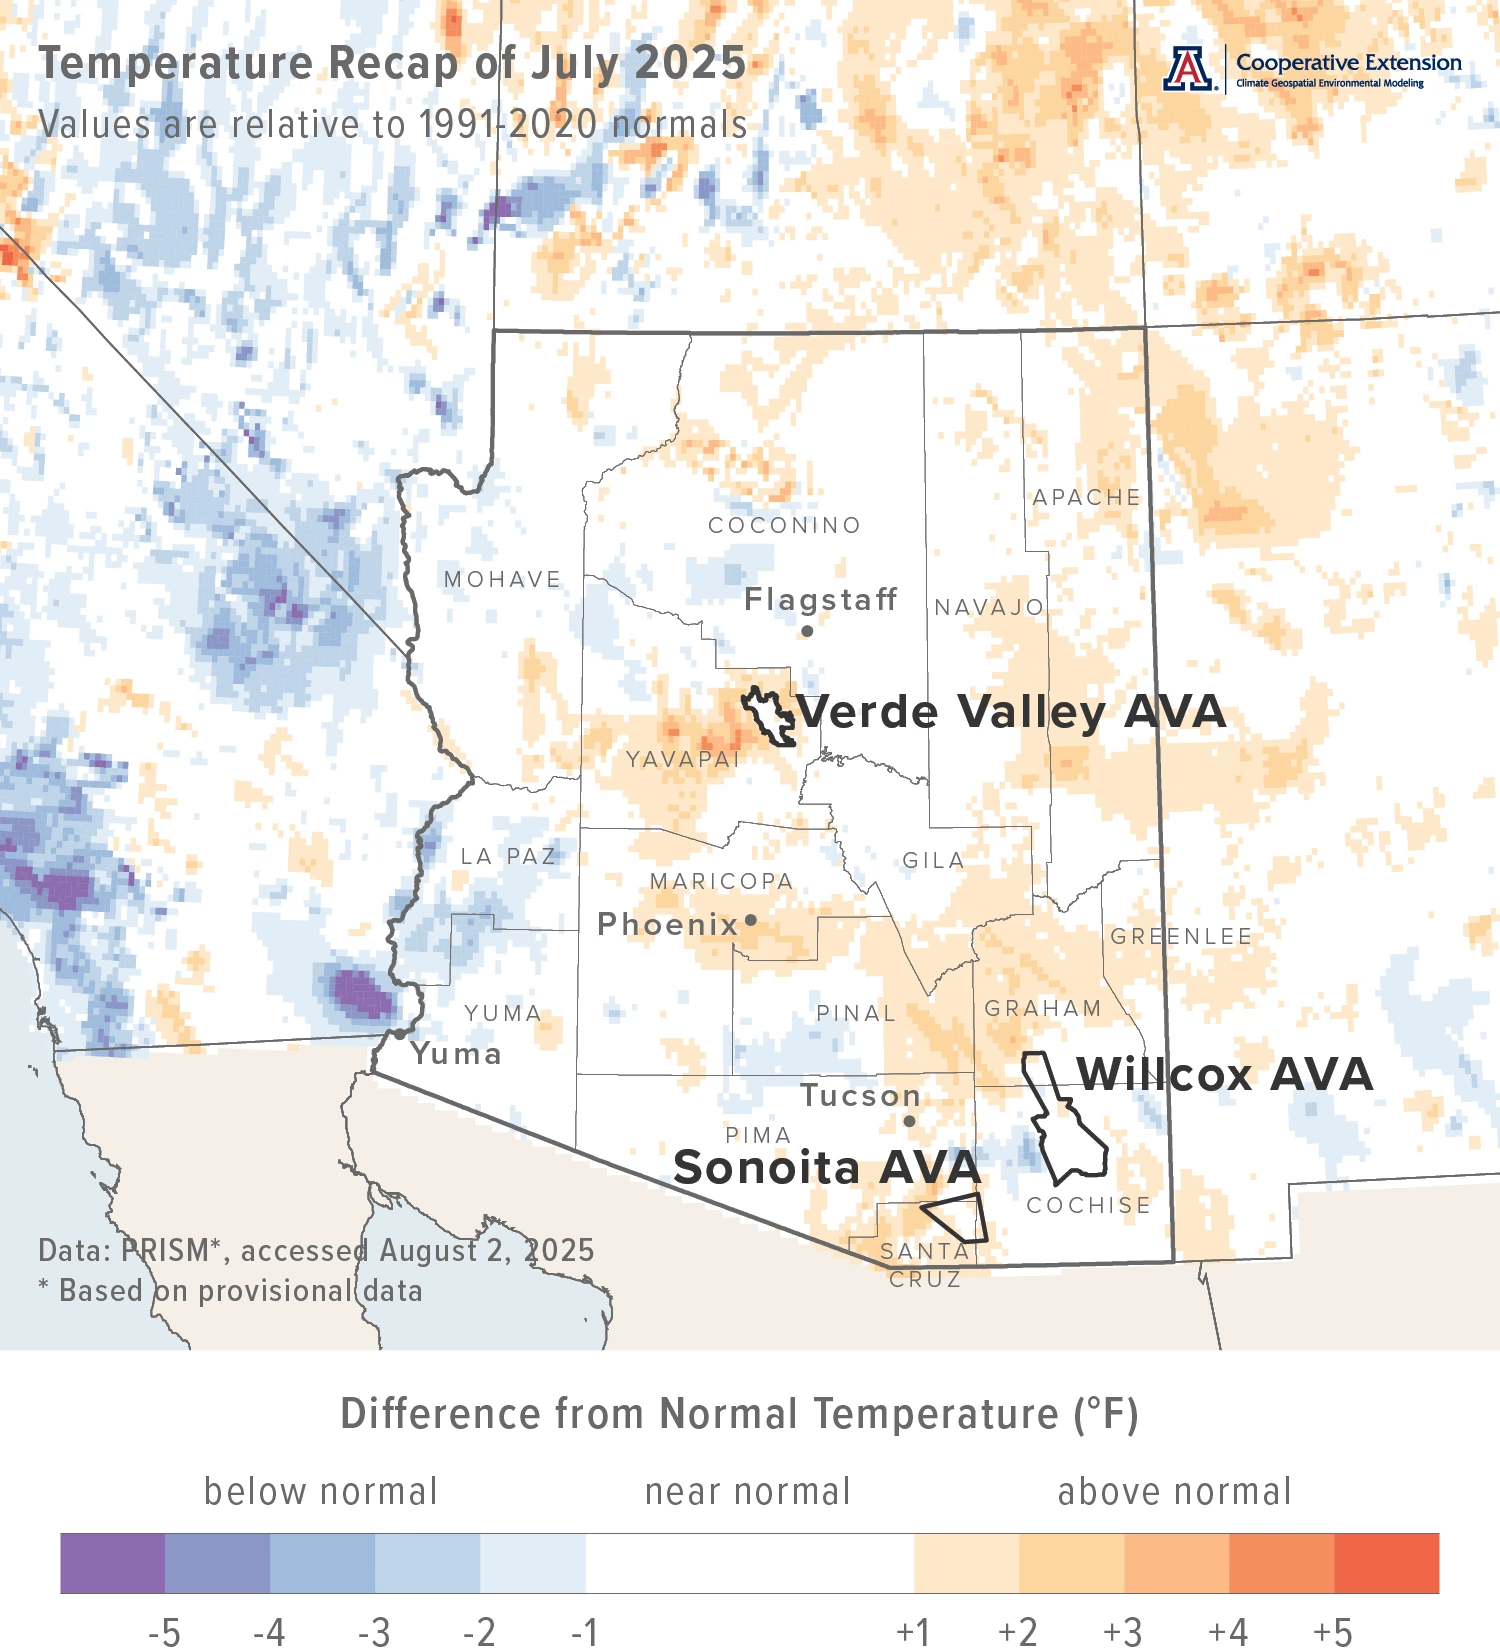
Monthly average temperatures were within 2 °F of the 1991-2020 normal for almost all of Arizona (light blue, white, and light orange areas on map), including all three Arizona AVAs. For reference, monthly average temperatures in July last year were 1 to 4 °F above normal for much of the southeastern, northeastern, and north-central parts of the state. Much of the rest of Arizona measured record-level temperatures of more than 4 °F above normal.
Area-average maximum and minimum temperatures during July 2025 were 89.7 and 64.0 °F for the Sonoita AVA, 99.7 and 66.4 °F for the Verde Valley AVA, and 93.6 and 65.0 °F for the Willcox AVA. Respective July normals are 88.5 and 62.8 °F, 98.1 and 66.0 °F, and 93.6 and 64.9 °F.
Temperature last month ranged between 103.6 and 55.0 °F at the AZMet Bonita station, 101.5 and 56.7 °F at the AZMet Elgin station, and 103.6 and 57.4 °F at the AZMet Willcox Bench station.
Jeremy Weiss
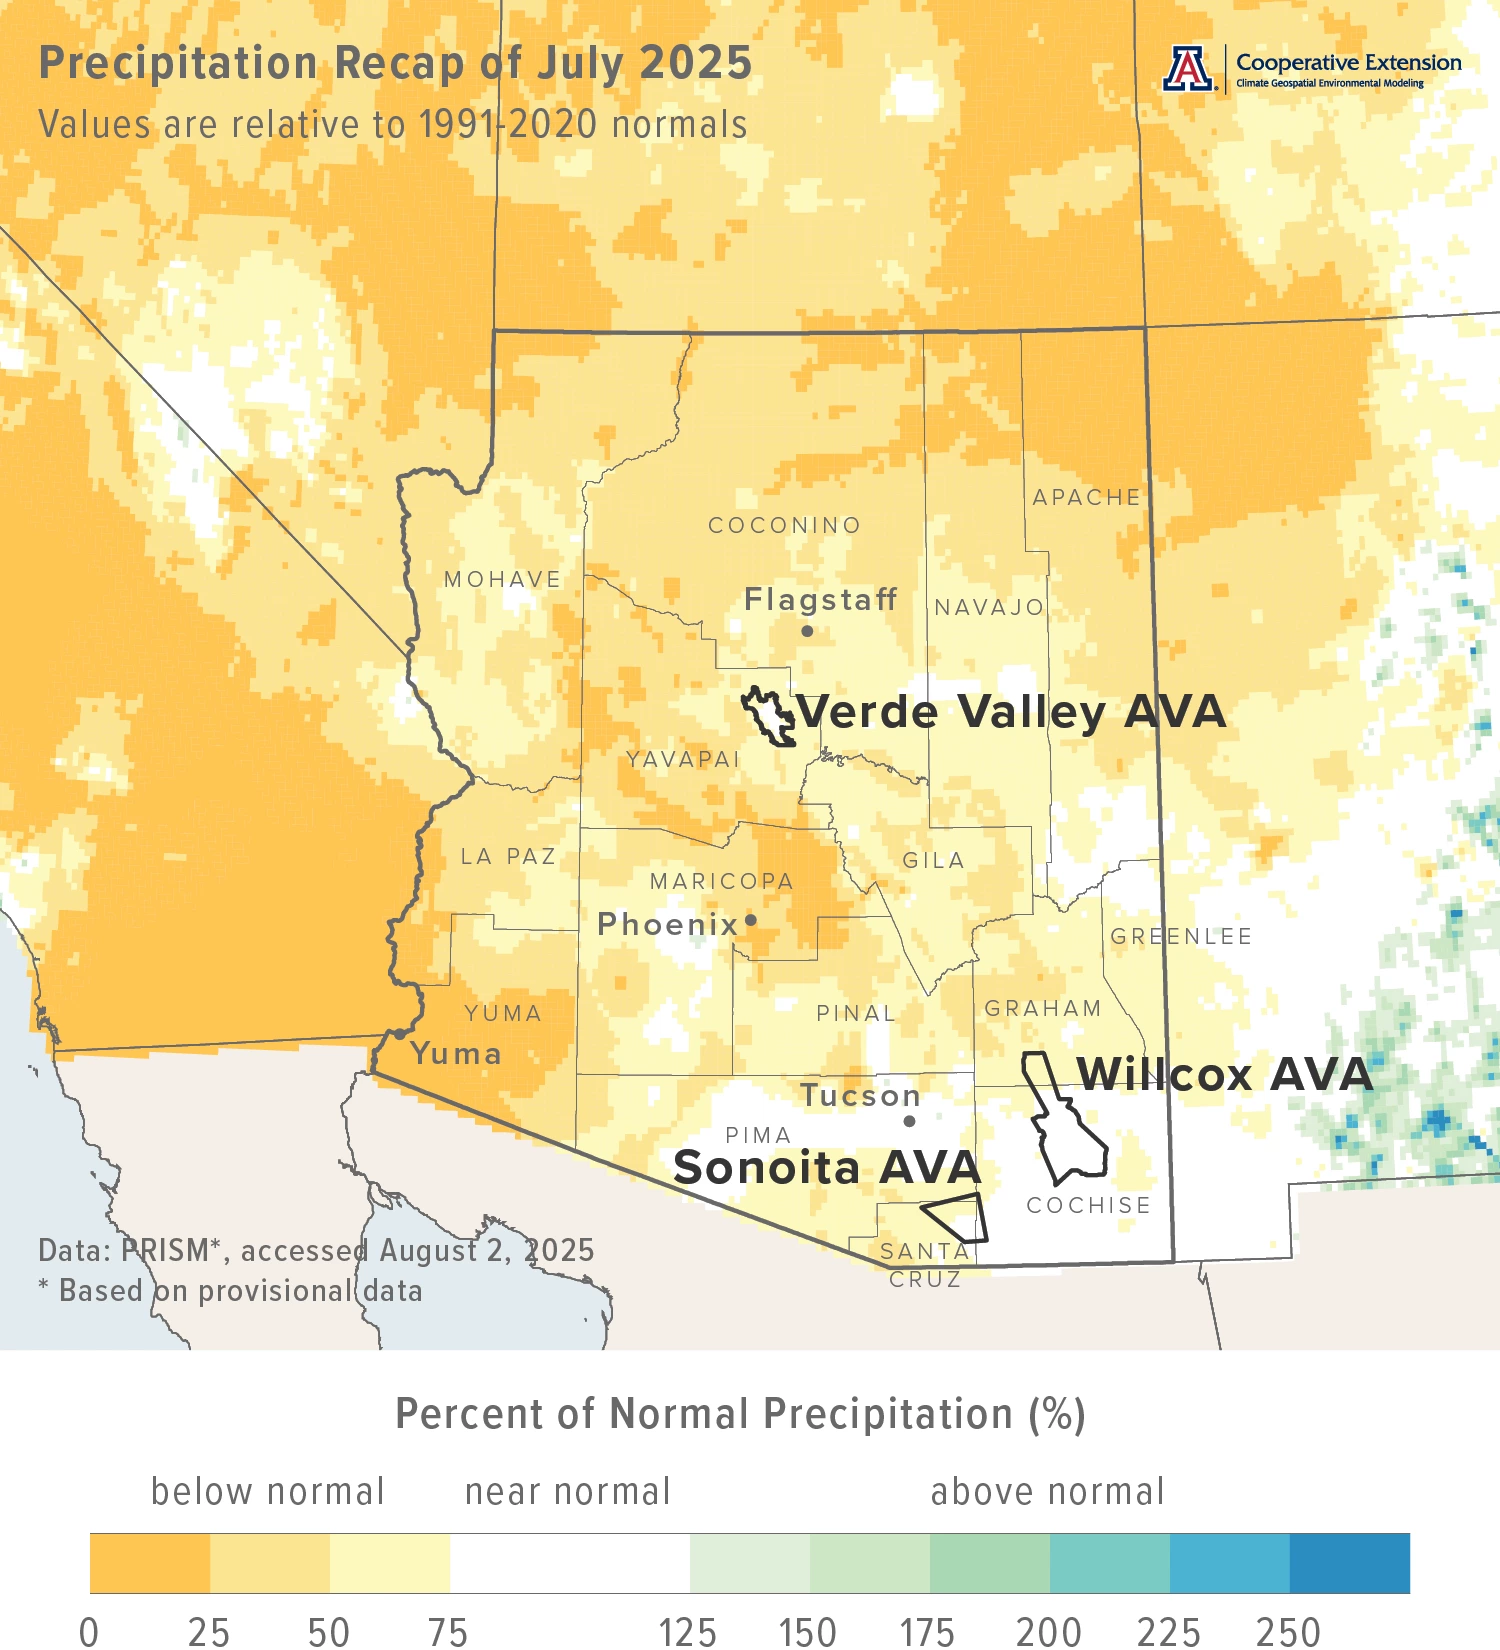
Monthly precipitation totals were less than 75 % of normal for much of the state (light yellow, yellow, and dark yellow areas on map). Along with parts of southeastern and east-central Arizona, only a few scattered locations recorded near-normal totals (white areas on map). Precipitation during July 2024 was near normal for much of the southeastern and north-central parts of Arizona. Much of the rest of the state recorded totals less than 75 % of normal.
Area-average total precipitation in July 2025 was 3.00 inches for the Sonoita AVA, 1.23 inches for the Verde Valley AVA, and 2.31 inches for the Willcox AVA. Respective July normals are 4.06, 1.75, and 2.67 inches.
Total precipitation last month was 2.10, 2.53, and 1.35 inches at the AZMet Bonita, Elgin, and Willcox Bench stations, respectively.
Dig further into daily weather summaries for the AZMet Bonita and Willcox Bench stations in the Willcox AVA and the AZMet Elgin station in the Sonoita AVA
View seasonal summaries of monsoon rainfall through regional maps and weather station statistics
Learn more about PRISM climate data
Jeremy Weiss
The Outlook for August Temperature and Precipitation
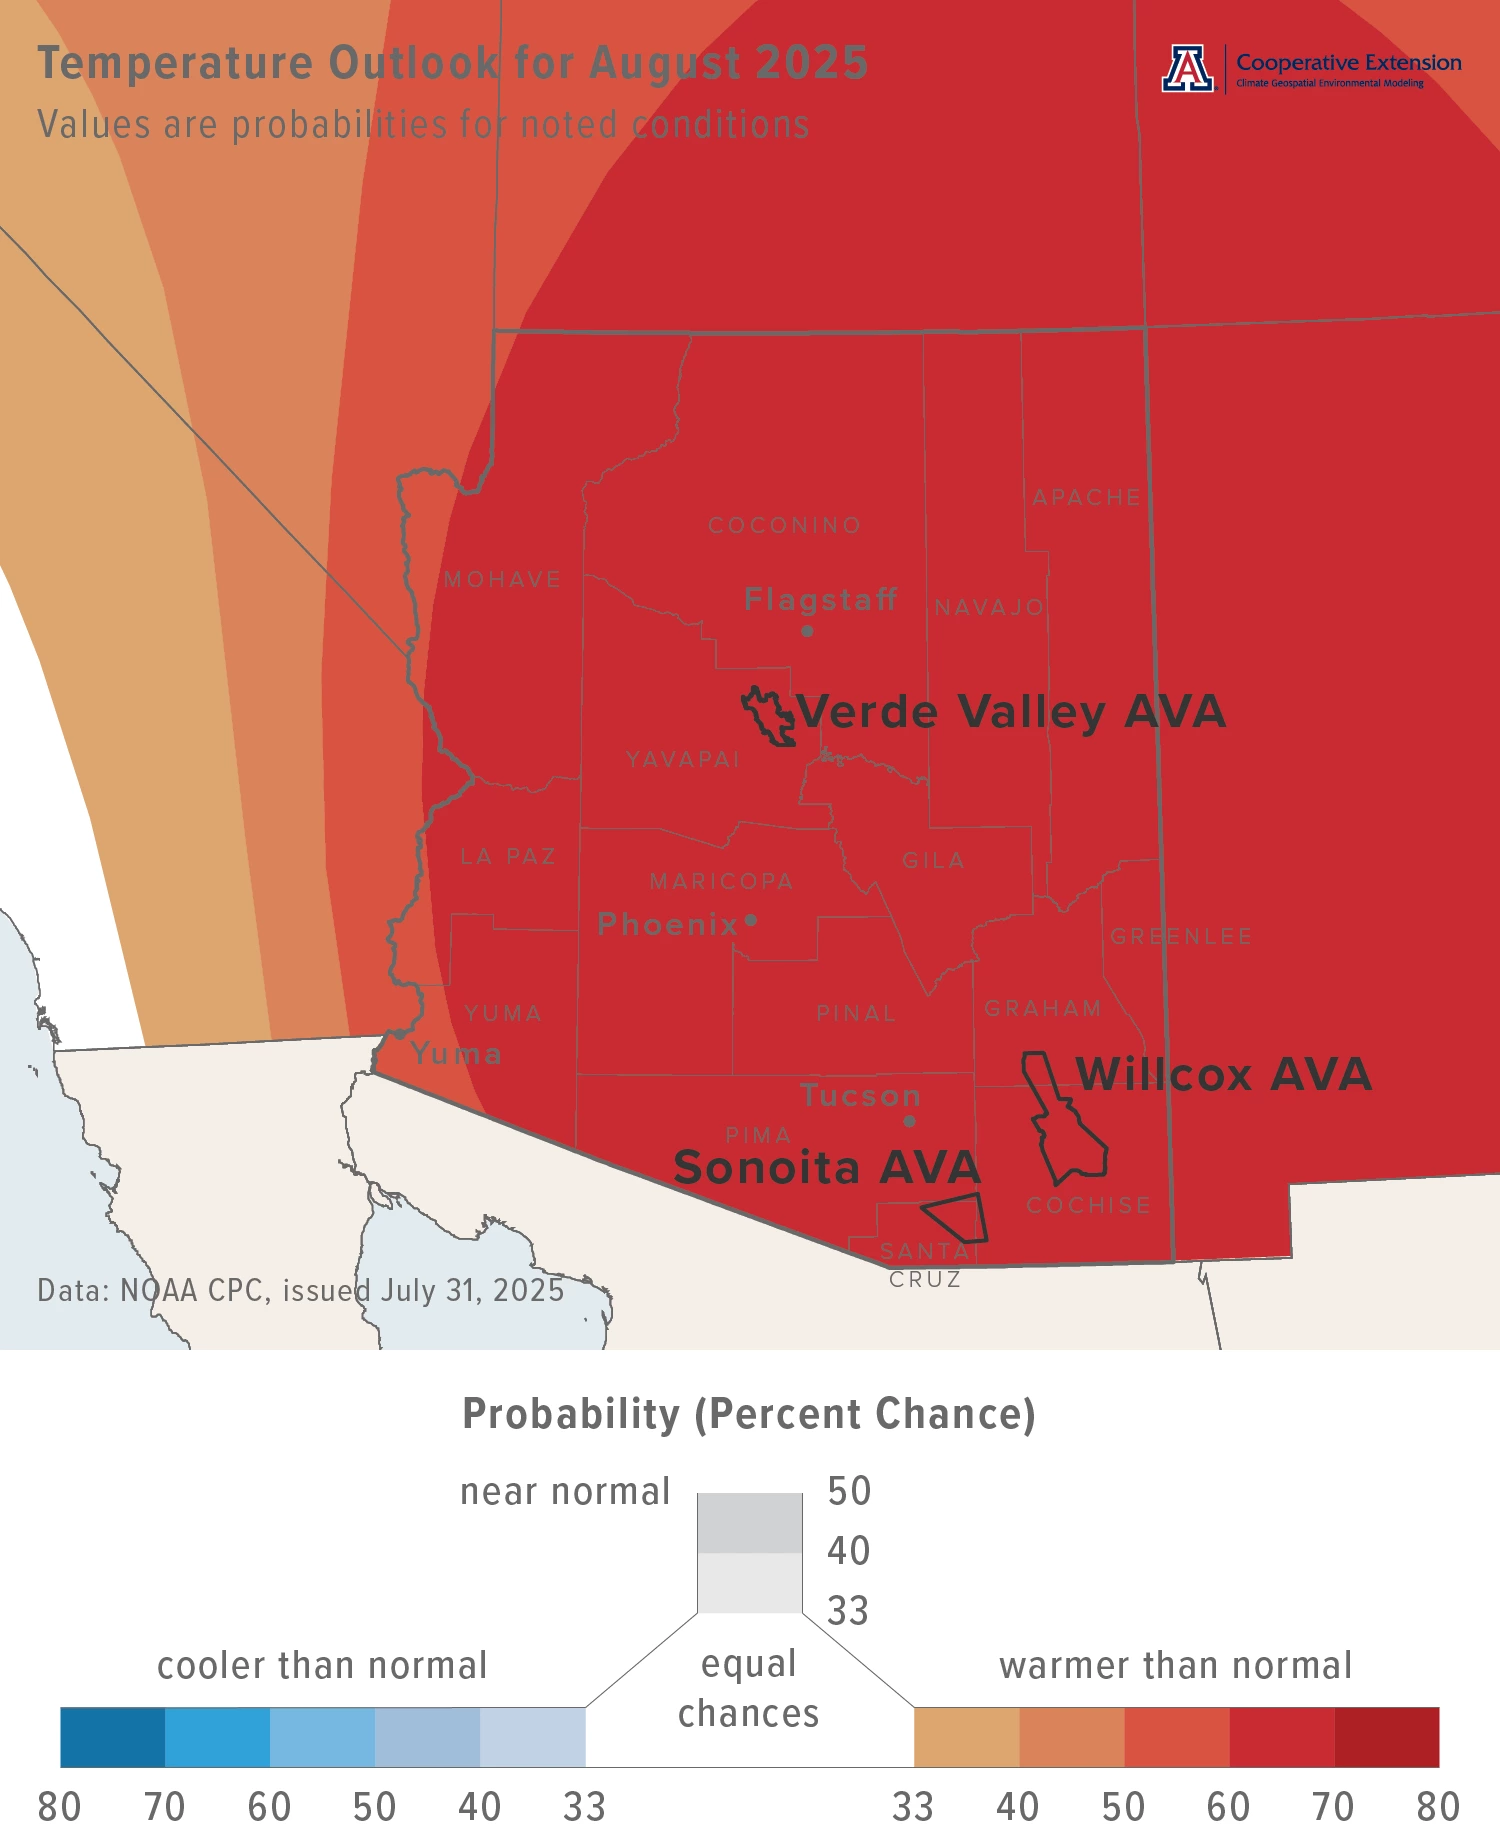
Temperatures over the course of this month have a moderate increase in chances for being above the 1991-2020 normal across all of Arizona (dark orange and red-orange areas on map). Monthly average temperatures in August last year were 1 to 4 °F above normal for almost all of the state.
Area-average maximum and minimum temperatures during August 2024 were 88.5 and 63.1 °F for the Sonoita AVA, 98.0 and 67.8 °F for the Verde Valley AVA, and 93.4 and 64.4 °F for the Willcox AVA. Respective August normals are 86.3 and 61.7 °F, 95.7 and 65.2 °F, and 91.2 and 63.8 °F.
Temperature in August last year ranged between 99.3 and 57.7 °F at the AZMet Bonita station and between 101.5 and 57.6 °F at the AZMet Willcox Bench station.
Jeremy Weiss
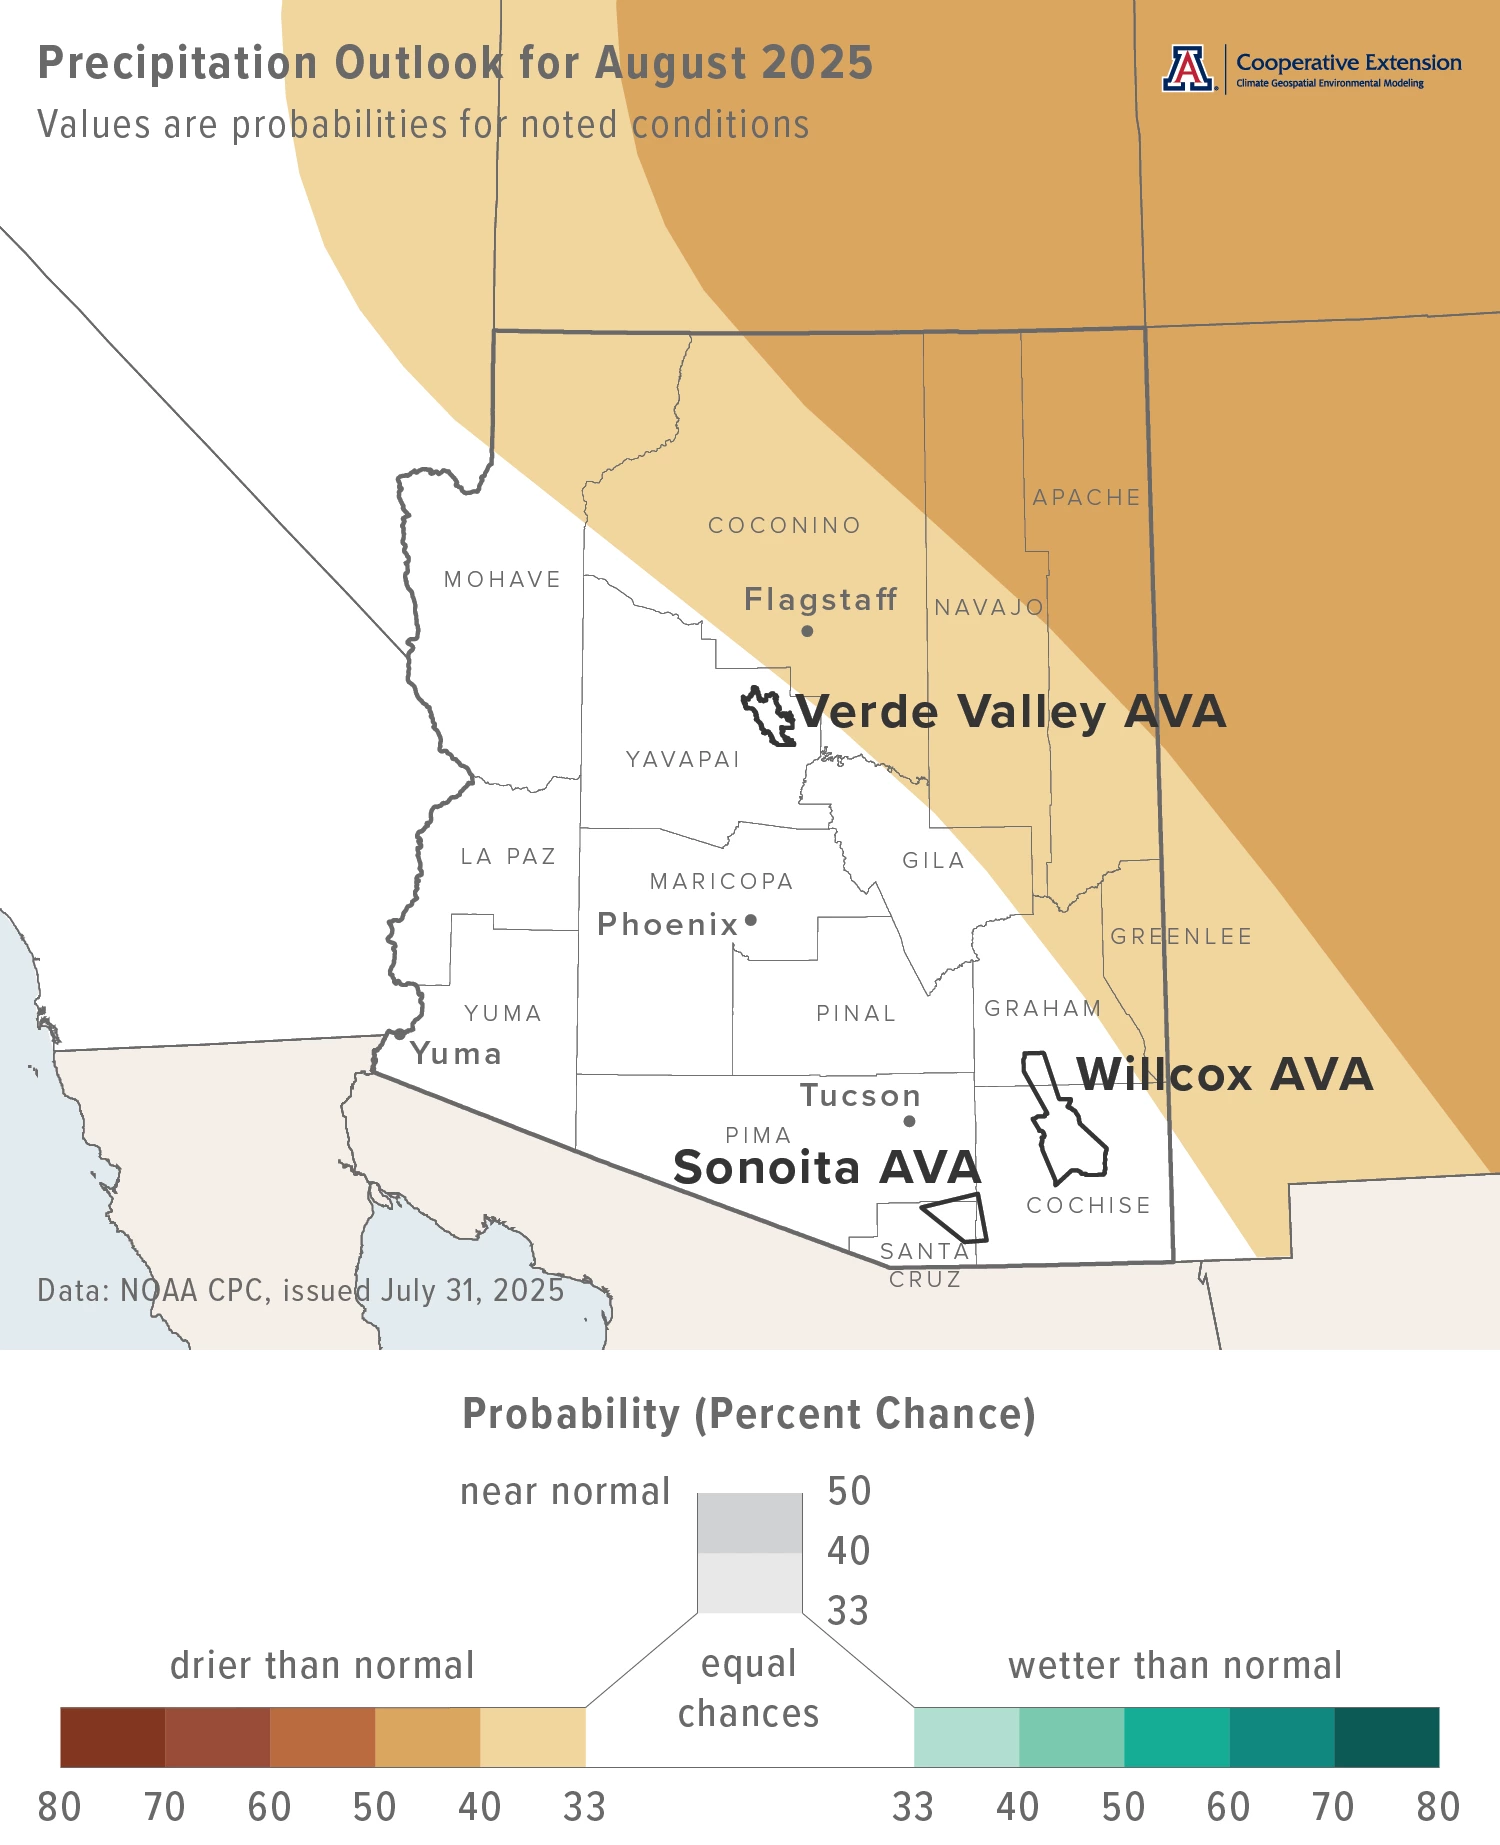
Precipitation totals for this month have a slight increase in chances for being below normal across the northeastern one-third of the state (light tan and tan areas on map). For the southwestern two-thirds, there are equal chances for below-, near-, or above-normal totals (white area on map). Precipitation during August 2024 was less than 75 % of normal for most of the southern, central, and western parts of the state. Parts of southeastern and much of north-central and northeastern Arizona recorded near-normal amounts. A few locations in extreme north-central and northeastern Arizona measured totals above 125 % of normal.
Area-average precipitation totals in August 2024 were 2.54 inches for the Sonoita AVA, 1.77 inches for the Verde Valley AVA, and 2.39 inches for the Willcox AVA. Respective August normals are 3.95, 2.40, and 2.80 inches.
Total precipitation in August last year was 0.82 and 0.78 inches at the AZMet Bonita and Willcox Bench stations, respectively.
To stay informed of long-range temperature and precipitation possibilities beyond the coverage of a standard weather forecast, check in, too, with the six-to-ten-day outlook and eight-to-fourteen-day outlook issued daily by NOAA’s Climate Prediction Center.
Jeremy Weiss
Heat Accumulation during the Growing Season
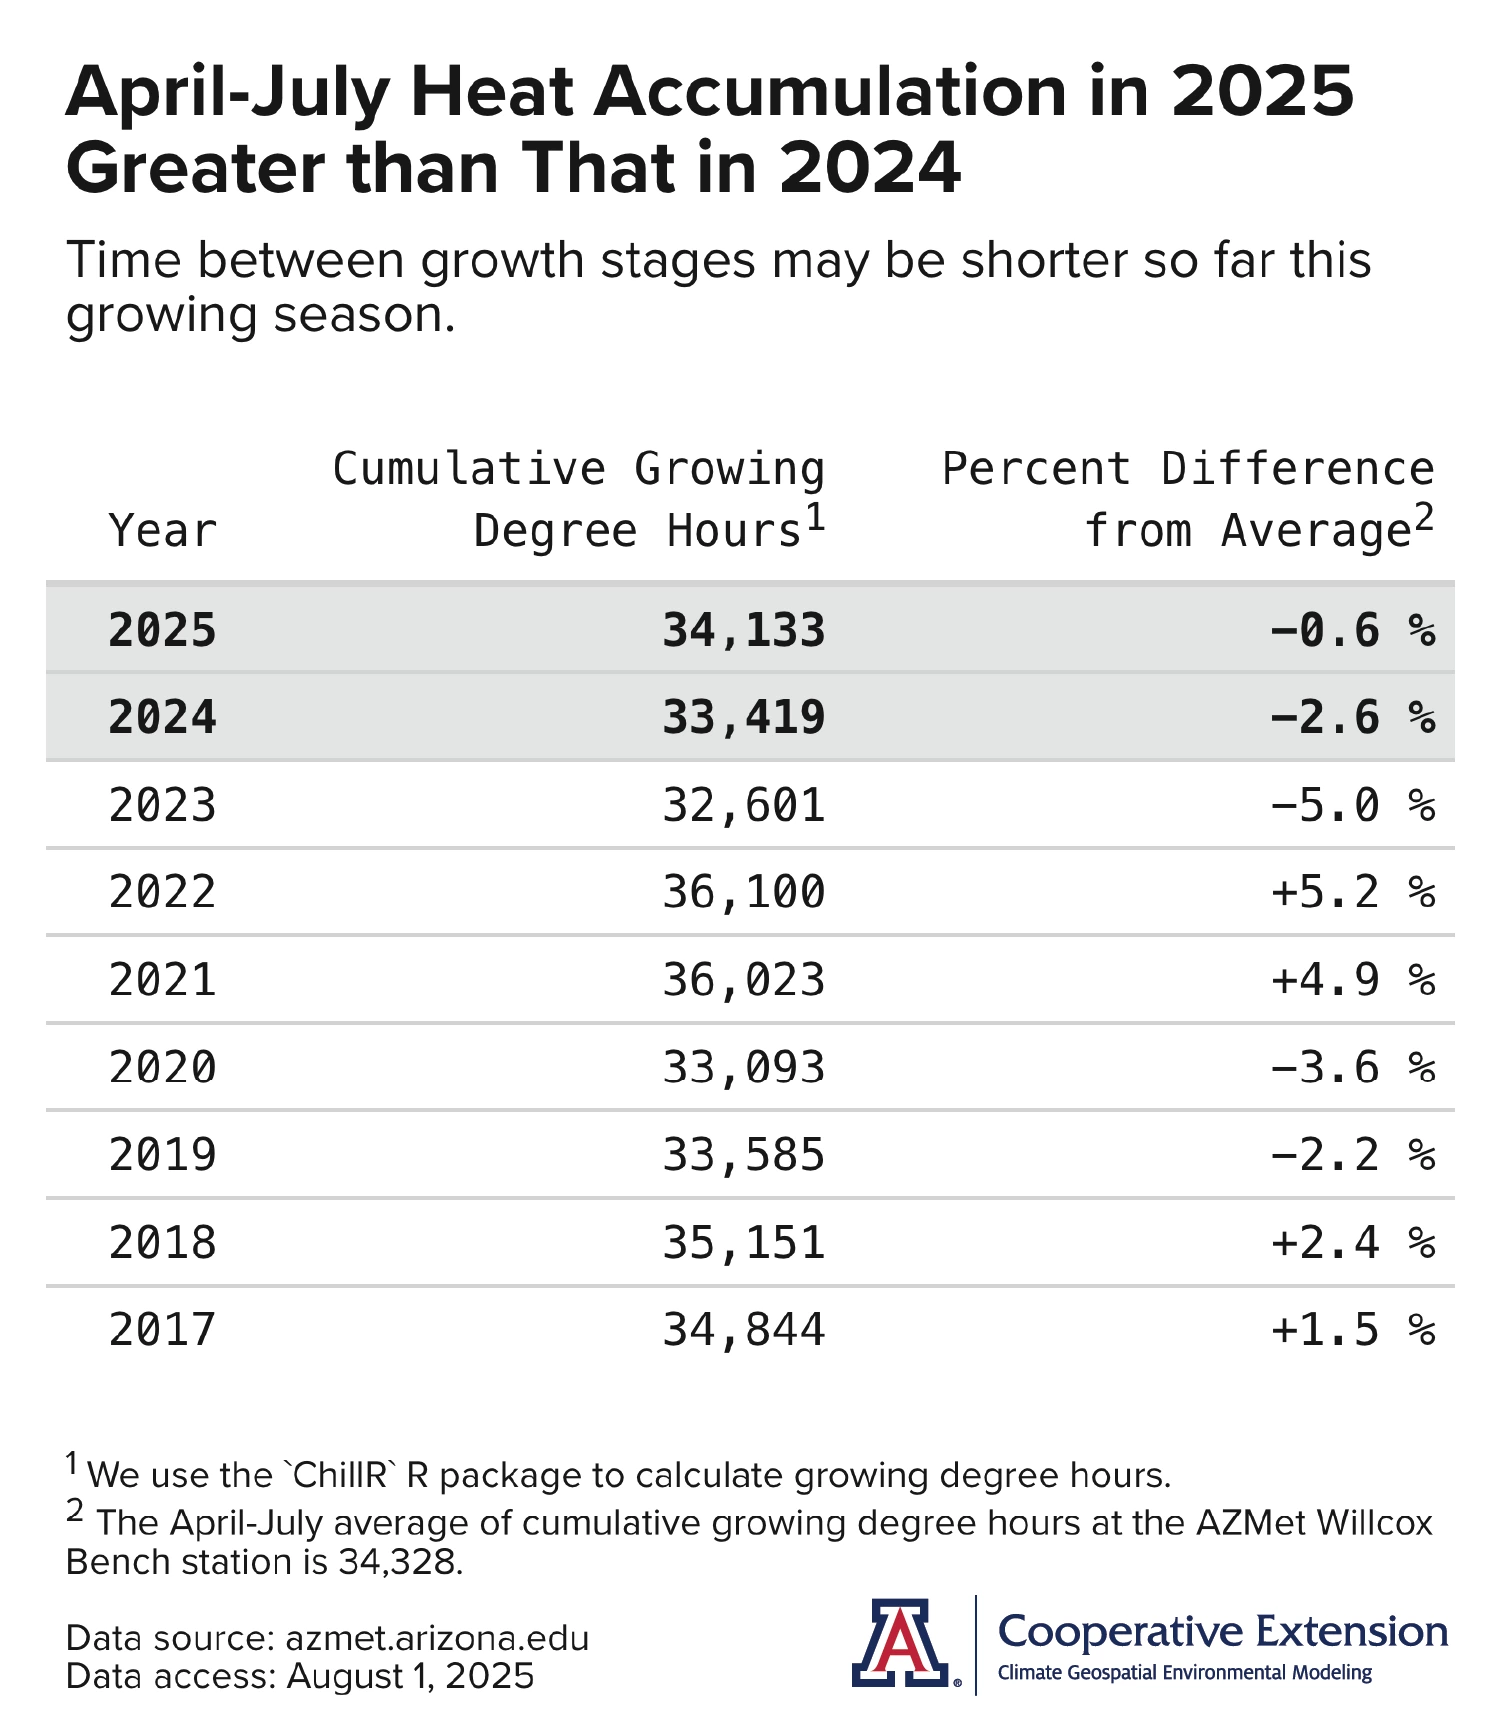
Heat accumulation from April through July this year at the AZMet Willcox Bench station in the south-central part of the Willcox AVA is greater than what it was at this time last year (top two rows of table). This suggests that the growth rate of vines may have been faster and the time between pre-veraison growth stages shorter so far this growing season than what they were in the previous one. Heat accumulation this year is near the station average, whereas that of last year is below average, as indicated by the percent values in the third table column.
Relative to last year, how much more advanced might vine growth stages be this year due to the additional heat accumulation? As the average daily accumulation of growing degree hours during the months of April, May, June, and July is approximately 281, and the difference in cumulative growing degrees hours between 2025 and 2024 is 714, the additional heat accumulation during these months in 2025 is worth about two to three days. Coupling this with bud break dates that mostly were earlier in 2025 than in 2024, growth stages might be about one week ahead, depending on variety.
Since station measurements began, the greatest amount of heat accumulation at this point in the growing season happened in 2022 while the least amount happened in 2023. Percent differences from average for these years range roughly between -5 and +5 % (that is, about 3,500 growing degree hours) and suggest that variability in heat accumulation during the months of April, May, June, and July translates to as much as a 12- to 13-day difference in growth-stage timing.
Jeremy Weiss
Extra Notes
The Arizona Meteorological Network recently started measurements at the new Elgin station, located in the Sonoita AVA at Deep Sky Vineyard along Elgin Road. Similar to the Bonita and Willcox Bench stations in the Willcox AVA, its most recent 15-minute data is available online at AZMet in Real-time. Additional data summaries and data downloads also are accessible through the new AZMet website. Please contact AZMet with any questions.
Given recent and current conditions, there is an above-normal potential for significant wildland fires across the northern one-third of Arizona in August. Otherwise across the state the outlook from the National Interagency Fire Center shows potential as normal for the month.
Neither El Niño or La Niña conditions look to affect the monsoon this summer. There is 75 % chance that ENSO-neutral conditions remain for the rest of the July-through-September 2025 period. Chances are 49 % that they persist through the October-through-December 2025 period.
For those of you in southeastern Arizona, including the Sonoita and Willcox AVAs, Cooperative Extension manages an email listserv in coordination with the Tucson forecast office of the National Weather Service to provide information in the days leading up to agriculturally important events, like heat waves and monsoon outbreaks. Please contact us if you'd like to sign up.
And for those of you in north-central and northeastern Arizona, including the Verde Valley AVA, Cooperative Extension also now manages an email listserv in coordination with the Flagstaff forecast office of the National Weather Service to provide similar information for this part of the state. Please contact us if you'd like to sign up.
Undergraduate students in the College of Agriculture and Life Sciences at the University of Arizona are looking for internships with businesses and companies in the viticulture and winery industries. Please contact Danielle Buhrow, Senior Academic Advisor and Graduate Program Coordinator in the Department of Agricultural and Resource Economics, for more information.
Please feel free to give us feedback on this issue of the Climate Viticulture Newsletter, suggestions on what to include more or less often, and ideas for new topics.
Did someone forward you this newsletter? Please contact us to subscribe.
Have a wonderful August!
With current and past support from: