Using geospatial technologies to understand dryland dynamics
![]() No. 51, May/June 2002
No. 51, May/June 2002
Using
geospatial technologies to understand dryland dynamics
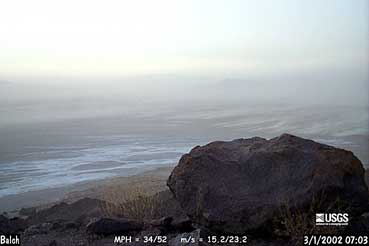 |
Figure 5a: Photograph collected on March 1, 2002, at 7:03 a.m. when regional winds were from the northwest at approximately 15.2 m/s (34 mph) and and peak gusts were at 23.2 m/s (52 mph). |
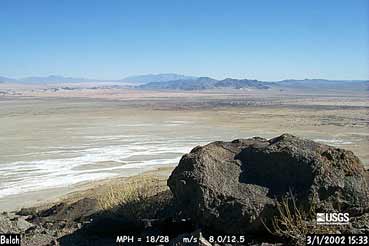 |
Figure 5b: Photograph collected on March 1, 2002, at 15:33 p.m. when winds were from the northwest at approximately 8.0 m/s (18 mph) and peak gusts were at 12.5 m/s (28 mph). |
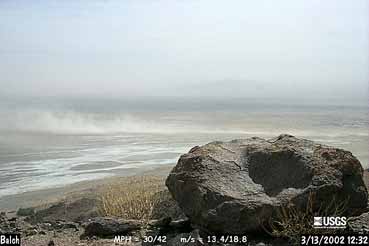 |
Figure 5c: Photograph collected on March 13, 2002, when regional winds were from the southwest at 12:32 p.m. with wind speed at approximately 13.4 m/s (30 mph) and peak gusts at 18.8 m/s (42 mph) . |
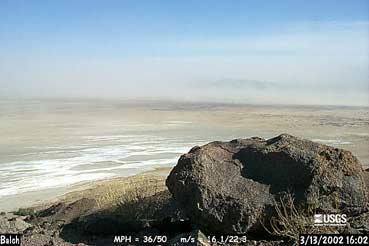 |
Figure 5d: |