Image

When
1:01 – 4 p.m., March 21, 2024
Where
Zoom (after registration a link will be sent to participants)
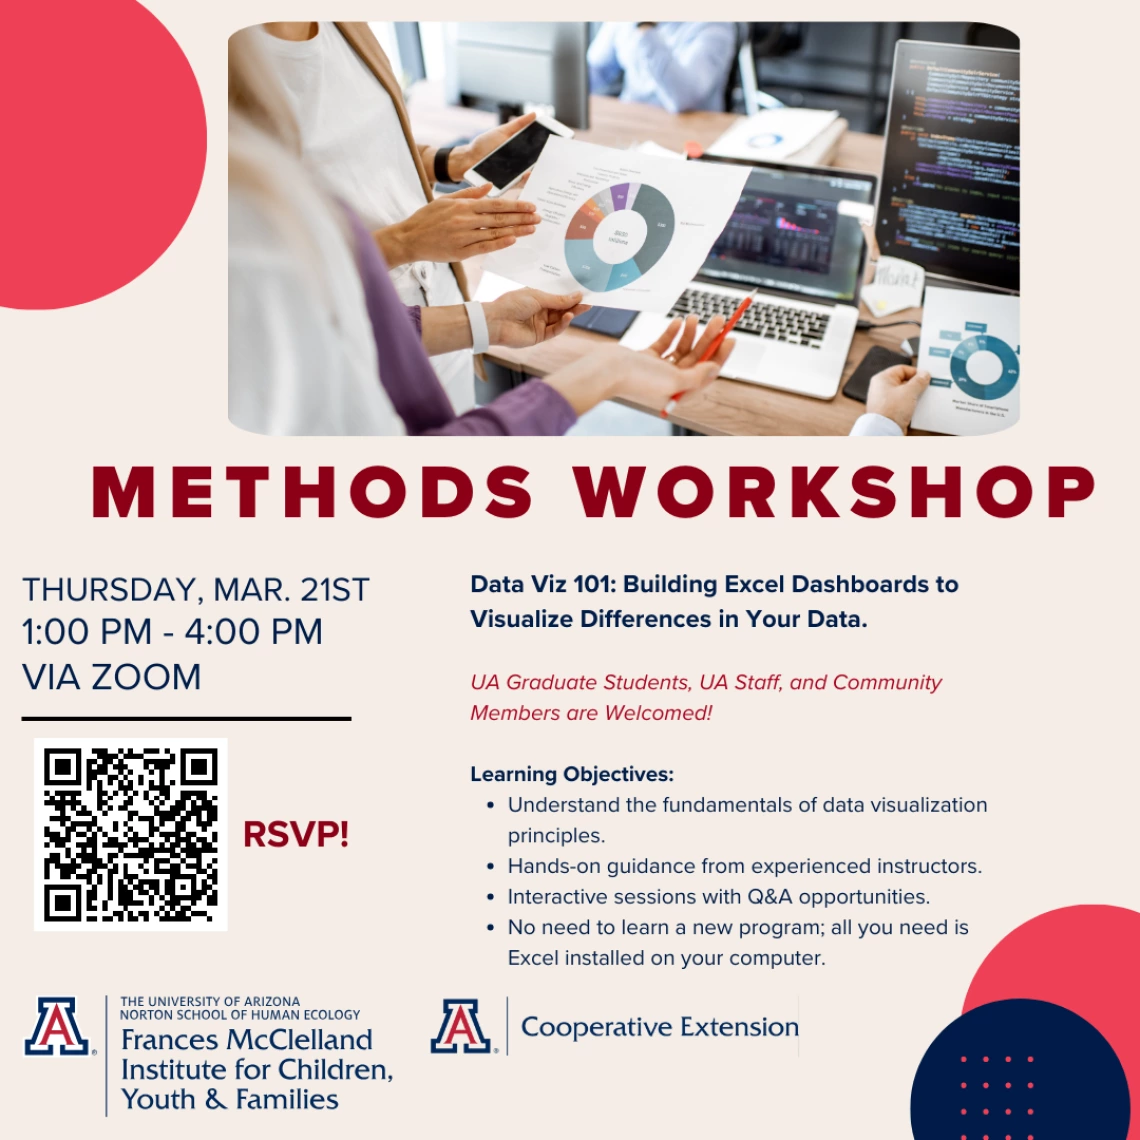
This virtual workshop, is designed for curious but relatively novice data-wranglers, will walk you through the process of going from raw data to an interactive dashboard... without having to learn a whole new program. The Community Research, Evaluation & Development Team (UA CRED) will guide you through the process of making pivot tables to quickly summarize data and creating a dashboard where you can slice & dice your data to visualize how responses differ for subgroups in your data – all in Excel.
Participants should have Excel installed on their computers. A practice dataset will be available, but you are also invited to bring your own dataset that you want to transform in to a dashboard.
Price: Student $20, General Admission $40, Cooperative Extension Employee Free
*Opportunity to pay with UA internal accounts, please email Bianca at basolis2@arizona.edu to start this payment process

