RBSim:
Geographic Simulation of Wilderness Recreation Behavior
H. Randy Gimblett
Professor
School of Renewable Natural
Resources
University of Arizona
Tucson, Arizona. USA 85721
email:gimblett@ag.arizona.edu
Merton T. Richards
Professor Emeritus
School of Forestry
College of Ecosystem Science
and Management
Northern Arizona University
Flagstaff, Arizona. USA
86011-5018
email:merton.richards@nau.edu
Robert M. Itami
Senior Research Fellow
Department of Geomatics
Faculty of Engineering
University of Melbourne
Parkville 3052
email:
bitami@sunrise.sli.unimelb.edu.au
Abstract
Simulation techniques are used to
explore the complex, spatial interactions among recreationists and their
environment as a means to improving wild land recreation management. The Recreation Behavior Simulator (RBSim)
uses rule-driven autonomous agents as surrogates for human visitors coupled
with geographic information systems to represent the environment for
dynamically simulating recreation behavior.
Behavioral rules are derived from visitor surveys conducted in Broken
Arrow Canyon, Sedona, Arizona. Model runs allow both statistical and spatial
analysis to quantify and explore recreationists movement patterns, encounters,
and the influence of management actions on visitor use levels.
Introduction
The recreational use of forestlands in the United States is increasing. Social change in the United States has resulted in a predominantly urban population that has created new pressures on forest ecosystems. Greater variety in leisure activity preferences, more urban-oriented social behavioral patterns on-site, and a wider range in the ages of recreation participants can result in social and environmental conflicts, both between recreation and other forest uses, and among the recreationists. Understanding the relationships between recreation and other important uses is essential to effective ecosystem management and will determine how well management decisions can be improved (Richards and Daniel, 1991).
Given the complexity of
social, environmental and economic interactions, the forest manager needs a set
of tools that can provide insight into the relationships between management
actions and social and environmental outcomes.
Sophisticated tools exist for the management of economic resources such
as forest productivity, water quality and quantity, and mineral resources. However, tools for modeling the social and
environmental costs and benefits of recreation on forestlands are less
available. For a recreation model to be
useful for applied forest management, it must be capable of expressing changes
in the social, psychological and economic costs and benefits of specific forest
recreation opportunities as a function of changes in physical and/or biological
forest characteristics. An integrated
modeling framework should include:
· A representation of the
physical setting for recreation behavior
· A model of recreation
behavior that accounts for different activities (e.g., walking, skiing,
canoeing)
· A model of management
interventions that alter environmental factors or the number, type or
activities of human visitors.
Such an integrated framework is needed so that forest managers can make explicit tradeoffs between recreational use of forests and resource activities. Because the interactions between these three aspects of recreation are complex, computer simulation holds great promise as a tool to comprehensively study these relationships. The purpose of this paper is to describe a prototype simulation environment, Recreation Behavior Simulator or RBSim, for assessing and addressing complex patterns of recreational use in wilderness settings.
Simulating Wilderness Recreation
Computer simulation is not a new concept in studying
recreation. Models such as the Wilderness Use Simulation Model (WUSM) (Shechter
1975) and it’s application in both river and backcountry recreation settings
(e.g., Smith et al. 1976; McCool, Lime and Anderson 1977; Borkan &
Underhill 1989) have been available to assist natural resource managers in
assessing wilderness use and for conducting tests of a variety of alternative
policies. Others researchers (e.g. Wang & Manning, 1999; Wing & Shelby
1999) have successfully used models to estimate trail encounters and other
measures of trail use for improving management and administration of park
settings.
While there have been more constrained models for
assessing recreation site preference and choices (Louviere et al. 1986), as
well as encounters between groups of recreationists (Shechter and Lucus 1978),
there has been little modeling work focused on developing dynamic, spatially
explicit tools that provide recreation managers and researchers with the
ability to systematically investigate different recreation management options.
By today’s standards, a tool such as the WUSM lack the flexibility to undertake
discrete simulation of visitor behavior along trails or rivers and fails to
provide any mechanism for studying critical interactions between humans and
environmental processes. The abundance of spatially georeferenced and temporal
data available today provides more opportunities for testing and improving the
accuracy of simulation models and with more direct applicability by resource
managers.
RBSim for Managing Recreation Use of Wilderness Settings
The
Recreation Behavior Simulator (RBSim) was developed to address the weaknesses
of other modeling approaches for examining complex land management issues by
using computer simulation technology. Detailed descriptions of the modeling
techniques can be found in (Gimblett & Itami 1997; Itami 2000; Gimblett et al. 2000a; Gimblett
et al. 2000b). More generally, RBSim was developed as a prototype tool that
could easily be modified for simulating many natural resource, planning or
design processes (e.g. traffic modeling, wildlife/habitat interactions,
recreation/wildlife conflicts).
As a
pilot project, RBSim was developed in response to a need to examine conflicts
between recreation groups over time in Broken Arrow Canyon near Sedona,
Arizona. The Canyon is popular for day hikers, mountain bikers and visitors on
commercial jeep tours because of the unique spectacular desert scenery of
eroded red sandstone. The popularity of this canyon is a problem common to many
popular wilderness recreation destinations.
Visitors are "loving the place to death" by overuse. This overuse not only has adverse impacts on
the landscape but also in the quality of the experience visitors have when they
visit. Crowding, encounters between
hikers, mountain bike enthusiasts and jeep tours can lead to adverse experiences
in what should be a spectacular and memorable landscape setting, but very
little is known about where and why these impacts occur and the intensity level
of these encounters.
RBSim
joins two computer technologies:
·
Geographic
Information Systems to represent the environment
·
Agents
(representing human recreationists) to simulate human behavior within
geographic space.
An ‘agent’ is defined as a set
of computer simulation software code that is built to replicate the actions of
objects in the real world. These objects can be cars, humans, boats or anything
that moves independent of its environment.
The ‘human-like’ agents described in this paper are dynamic because once
they are programmed with rules that define how they interact with the
environment and each other, can freely move about gathering data, making
decisions and altering their behavior according to any situation they find
themselves in. Each of these
‘human-like’ agents has it’s own physical mobility capabilities (movement),
sensory capabilities (to see the environment and others in it), and cognitive
capabilities (to reason leading to decision-making). By simulating human behaviors (using ‘human-like’ agents i.e.
mountain bikers, day use hikers and commercial jeep tours) in the context of
geographic space, it is possible to study the number and type of interactions
over time.
To provide resource managers
with a useful tool for examining practical management scenarios of visitors
using recreation settings, the design of the behavioral systems of these
‘human-like’ agents must be grounded in observations of actual human behavior
in the physical settings in which they naturally occur. In addition, managers
must have the potential to alter parameters, leading to improved visitor
management. The behavior of RBSim agents is guided by a set of parameters whose
values can be set by the manager. Some
of these are:
·
The
total number of agents in each class (hikers, mountain bikers, and commercial
jeeps);
·
The
age distribution of those real hikers and mountain bikers being represented as
agents;
·
The
frequency of when real hikers and mountain bikers arrive at a trailhead and
duration of visit;
·
The
GIS data containing trail configurations to be simulated;
·
The
duration of the simulation run;
·
Parameters
for setting up visibility for the agents.
These specifications result
in actions that echo some key behavioral characteristics of humans in the
environment. For example, these agents
can estimate how they will react when
encountering other agents, at what speed they should travel through a
landscape, how often, and for how long they must rest, their recreational
goals, the route they will follow through the landscape and so on. In effect, the manager is able to create
different behavioral patterns and personality types for classes of agents based
on social and demographic data gathered from field and used to derive
individual and interaction rules and programmed into each of agent. By continuing to program knowledge and
rules into the agent, watching the behavior resulting from these rules and
comparing it to what is known about actual behavior, a rich and complex set of
behaviors emerge. What is compelling
about this type of simulation is that it is impossible to predict the behavior
of any single agent in the simulation and by observing the interactions between
agents it is possible to draw conclusions that are impossible using any other
simulation process.
RBSim is important because
until now, there have been few tools for recreation managers and researchers to
systematically investigate different recreation management options. A majority of recreation research is based
on interviews or surveys, but this information fails to inform the
manager/researcher how different management options might affect the overall
experience of the user. For example if
a new trail is introduced, there will ultimately be conflicting recreation
uses. How do different management options increase or decrease the potential
conflicts? Questions like these cannot
be answered using conventional tools.
These questions all pivot around issues such as time and space as well
as more complex issues such as inter-visibility between two locations. By combining human agent simulations with
geographic information systems it is possible to study all these issues
simultaneously with relative simplicity.
RBSim – How it Works?
RBSim uses agents to mimic the behaviors of three types of recreationists (day use hikers, mountain bikers and commercial jeeps) using Broken Arrow Canyon study site in Sedona, Arizona. Each agent type has a rich set of behaviors that define how it moves across a landscape and interacts with other agents it encounters. Each agent type has a single action called “Move” which triggers the execution of a set of internal rules (e.g., stopping at attraction sites and passing other agents), energetics (rate of loss of gain of energy) and mobility (speed at which one traverses the landscape). Each agent enters the simulation at the trailhead depending on minimum and maximum times specified by the manager (to mimic random times visitors start their activities in the real landscape). Agent speeds are modified by degree of slope, up or downhill travel, stopping and resting times (to mimic the modified rates encountered in real landscapes). Each agent has the spatial analytic capability to access topographic and trail data, computing degree of slope and direction and modifies its speed accordingly. Depending on the agent type they have a set of rules that define where they stop in the simulation, how long they spend and how they react to others they encounter. For example, in the case of a landscape agent that is highly motivated to seek out areas for a solitude experience, they will avoid crowds at attraction sites, pass other agents perceived as traveling in front and only stop in places where no one resides. As each agent moves, it assesses and keeps track of perceived (any other agent seen on any of the trails within a specified view area) and actual (those who are encountered in the same cell) encounters for each cell location along the trail. As the simulation runs, and more agent types enter the simulation, a rich, mapped display of encounters can be observed. The location, total numbers and types of encounters that occur over the day, week or month are reported in various forms (e.g., graphs, 3-D images and spatial georeferenced maps). The manager then can alter numbers of agents (visitors), times entering the trail system and test these out on both existing and proposed trails to examine the spatial distribution of use patterns, before any management actions are implemented. Setting trail quotas, anticipating high use areas, controlling access are a few of the management actions that can be tested.
How Data was collected to Represent Actual Visitation Patterns
During a nine-month period
(April thru December 1995) an on-site visitor use survey was conducted to
capture data on recreational use patterns in Broken Arrow canyon, Sedona,
Arizona. The random survey followed a two-step process. First visitors (day use
hikers, mountain bikers and commercial jeeps passengers) were approached and
asked to take a trail map of the canyon with them on their outing. This map
contained major attraction sites, trails, and other subtle features identified
as destination sites in the canyon. Visitors were asked to record when they
left the trailhead, duration of outing, where they stopped, particularly if
they traveled off established trails, where they had encounters with others on
the trails (actual) and mark the location of where they saw others (perceived
encounters) in the area.
When they returned to the trailhead, they were intercepted for a short interview by the research team. The exit interview was used to solicit response on the type of benefits that were desired (trip motives and expectations) during their visit and to what degree they were able to obtain them. Visitors were asked if a range of benefits were desirable (goals and intentions) and whether they could obtain those benefits over time (goal interference). Achieving desired benefits such as getting away from or avoiding crowds, reducing stress and increasing physical fitness are strong indicators of recreational satisfaction. The survey for this study was used to identify anything that either made the setting an ideal place for achieving, or interfered with acquiring, the desired benefits. So negative detractors and the inability to obtain desired benefits together are used to measure goal interference and conflicts, and imply an inability to obtain desired recreational experiences. In addition, each visitor was asked to provide a detailed description of the decisions they made in terms of stopping at attractions sites and interaction with others along the trail. This provided the research team with the decision-making process or rules that define the actions that effect visitation and in particular travel patterns. A sample of (n=1041) was obtained consisting of day-use hikers (n=337), mountain bikers (n=393) and commercial jeep passengers (n=319). Statistical analysis was performed within each activity group to characterize individuals by day, time and duration of visit, goals, intentions, desired and acquired benefits and rules that define these behaviors. Agents were then programmed with these characteristics and placed into the simulations to represent typical use patterns in the canyon. For a more detailed description of the analysis to define agent types for the simulation see (Gimblett et al. 2000b).
Exploring Typical Use Days in the Canyon Using
RBSim
In order to explore the use
of the simulation system in identifying conflicting recreation behavior, a set
of experiments are presented below. These experiments were constructed to
represent a typical midweek use day. A mean midweek visitation pattern
consisted of thirteen to sixteen hiking parties (averaging two per party)
arriving on the average fifteen to thirty five minutes apart and spending on
the average five to six hours a day in the canyon. Approximately twenty to twenty
five mountain biking parties (average two per party) randomly appeared
throughout the day and spent on the average four to five hours in the canyon.
Commercial jeep tours are more consistent in their use of the canyon averaging
fifteen to eighteen tours per day (average four visitors per tour) with an
average time spent in the canyon of three to four hours per trip. Typical
destinations that include geologic features such as Mushroom and Submarine Rock
and popular scenic lookouts and turnaround points such as Chicken Rock (See
Figure 1A). The model then consisted of setting the initial starting
parameters:
- Number of agents (thirteen hikers, twenty one mountain biker and
eighteen jeep parties);
- Random starting times for each agent (fifteen to fifty minutes)
- Simulation Duration (length of simulation run)
- Selecting Trails for each agent to follow (hiking, mountain biking
or jeep)
- Parameters for Calculating Visibility (topography map, height of
agent, frequency of calculating – every cell)
- Output parameters for capturing perceived and actual encounter
data (keeps track on a cell by cell basis the number of encounters and
stores then in a file for further statistical analysis and visualization)
The initial simulation was
run using these parameters. In order to
demonstrate a potential management action such as restricting mountain biking
use due to conflicts with hikers on a heavily used trail, two additional
simulation runs were undertaken using the same agent parameters as above, but
substituting two proposed mountain bike trail layouts. The simulations were rerun and compared to
the initial simulations to assess the patterns of recreational use and
resulting differences in encounters.
Figures have been
constructed with each of the simulation runs. Output consists of both
3-dimensional views from the trailhead looking south to the turnaround point
and graphs of average number of encounters from the perspective of hikers,
mountain bikers and commercial jeep tours. In the 3-D views, the variation in
the colored lines represent the number of encounters that occur along the
trails constructed by assigning the average number of encounters to the trail
cell and projecting those cells upward to reflect the accumulation of
encounters. The graphs on the other hand illustrate the average number of
encounters along the trail where the vertical axis represents average number of
encounters and horizontal axis each trail cell from the trailhead to Chicken
Point (southern most turnaround point) and back to the trailhead.
Figure 1 (A) and (A-A)
illustrates the number of hiker encounters with other agents along the hiking
trails. Hiker encounters with mountain bikers are high from the beginning of
the simulation, peak at trail sequence #301 that coincides with furthest point from
the origin along the trail, and remain consistently high thereafter. What is of
interest is that where the encounters with hikers peak and where mountain biker
encounters drop off and visa versa.
Results of the survey
indicated that of the (n=337) respondents, (n=246) or 72% reported negative
encounters with jeeps (41%), mountain bikers (30%) and 29% with other hikers.
Of the (n=393) mountain bike responses to the survey (n=193) or 35% reported
negative encounters with jeeps (38%), hikers
(58%), and only 4% with other mountain bikers). It is interesting that
even though hikers are reporting a moderate number of encounters with jeeps,
there are very few encounters between mountain bikers and jeeps (See Gimblett,
2000b). Shelby and Heberlein (1986) have shown that impact of encounters on
recreation experience measured as perceived crowding or encounter norms, varies
as a function of the location and nature of encounters, not just the total
numbers of how they are space out over the duration of the trip. Our
simulations, while not providing any conclusive evidence on the impact on the
recreation experience in part echo what Shelby and Heberlein have found. Our
simulations provide the manager with a mechanism explore what these authors
have found in their research and to view the total numbers of encounters,
where the encounters occur (location) the nature of the encounter
i.e. (type of encounter) and duration, necessary for examining
density of use in the landscape.
Insert
Figure 1 (A) & Figure 1 (A-A)
Figure 1 (B) & (B-B)
illustrates biker encounters with hikers, jeeps and other bikers from along the
biking trail. Encounters are more consistent, increasing steadily from trail
cells 401 thru 601as the bikers return to the trailhead. Biker encounters with
hikers increase in the same trail sequence, but taper off from trail cells 601
back to the trailhead.
Insert Figure 1 (B) & Figure 1 (B-B)
Figure 1 (C) & (C-C)
illustrates a high number of jeep encounters with hikers and bikers and only a
minimal number of encounters with other jeeps. The encounters occurring with
hikers and bikers are concentrated around trail sequence 601 to 750 and then
again at 801 thru 100. These heavily used sections of the trails coincide with
scenic geologic features such as Chicken and Submarine Rocks.
In summary it appears that with the increased number of recreationists in the canyon that encounters between hikers and bikers are the most frequently observed. In Figures 1 (A) through (C-C) there are minimal encounters with Jeeps and those are sporadic. While jeeps originally were suspected as being more visually obtrusive and physically encountered, the simulations seem to indicate the opposite.
Insert Figure 1 (C) & Figure 1 (C-C)
Results Of Simulations Using An Alternative Trail Layout
One
reason for developing the simulator is to provide the land manager with a tool
for assessing existing and proposed trail layouts in terms of movement and
distribution of recreationists along these trails and the resulting encounters.
Ultimately this tool has been developed to assist the manager to dynamically
manage recreational use in the canyon over time. In order to demonstrate this
concept and assess the effect of alternative trail use and conflicts within and
between recreation groups, two alternative bike trails and one alternative jeep
trail were used to demonstrate RBSim. The two alternative mountain bike trail
layouts were extracted from information in the surveys. Those mountain bikers
who were sampled tended not to use the conventional trails in the canyon, but
rather they described in the survey where they preferred to ride.
The
reason these alternative routes were popular among the bikers was that they
were physically challenging, secluded and provided extraordinary scenic views.
There were only a limited number that took the time to make these suggestions,
but it was thought important for demonstrating the use of the simulator to
attempt to assess these trails to determine the number of encounters that would
occur under the same conditions used in the initial experiments.
Simulations Using Alternative Mountain Bike Trails #1 & #2
As
illustrated in Figures 2 (A) & (2 A-A)
& 3 (A) & 3 (A-A) selecting alternative bike trails can have a
major impact on the number of encounters that occur along the trails. It can be
seen that when alternative bike route 1 is used in the simulations that the
number of biker encounters with hikers will have significantly decrease,
particularly after the turnaround at Chicken Point. When compared to Figures 1
(B) & (B-B) & Figure 1 (C) & (C-C) altering the trail layout the
mean number of encounters has dropped by two thirds and the maximum number of
encounters by half.
Insert Figure 2 (A) and Figure 2 (A-A)
In
Figure 2 (A) & 2 (A-A) the number of encounters with other recreationists
that mountain bikers will have when using the alternative bike route reveals a
dramatic decline in both hikers and jeeps, but a steady increase in number of
bikers. In fact, an evaluation of the statistical summaries (See Table 1)
illustrates that encounters with hikers declines to one fifth of those that
occurred in Figure 1 (A), with the same number of hikers still using the
trails. This strongly suggests that by using the alternative trail, the
distribution of hikers and bikers within the canyon is more conducive to
minimizing encounters.
Insert Figure 3 (A) & Figure 3 (A-A)
Insert Table 1
Figure
3A illustrates a significant number of encounters with jeeps from both bikers
and hikers in the canyon when selecting alternative bike route 2. As in Figures
2 (A), encounters with other agents declined. Of significance are the
encounters with hikers and jeeps. But interestingly enough, increasing the
number of bikers from eleven to twenty seven has little effect on the mean
number of encounters that occur, but does affect the maximum. In other words
while the number of encounters remains the same, the encounters are more evenly
dispersed along the trail, rather than peaking at specific locations. Depending
on the management objective, using this alternative bike trail offers the
manager with a view of what to expect and could offer a solution to
distributing use and reducing encounters in this setting.
There
are three main points that summarize the findings of testing alternative trail
layouts:
·
The number of encounters significantly decreases over
time as a result of using alternative bike and jeep trails;
· Encounters
with other recreationists declines when testing alternative trail layouts;
· Exploring
alternative trail solutions using simulation is a viable method for reducing
the number of encounters and conflicts;
Summary of Findings and Discussion
The
results of the survey indicate that the most often reported negative encounters
are from mountain bikers complaining about hikers (See Gimblett et al. 2000b).
While jeeps are commonly thought to have a high level of contact with both
hikers and mountain bikers, our data and these simple simulations illustrated
that this is not the case. Results of the survey and simulations clearly show
that mountain bikers and hikers have much higher levels of encounters,
frequently clashing in this type of canyon environment. Examining the results
of the agent simulation runs illustrates that mountain bikers most frequently
encounter other mountain bikers. While mountain bikers may have more encounters
with other mountain bikers, only 4% see this as detracting from their outing.
Of
interest in this research, and showing the power of using simulation, is the
impact of simple management strategies such as restricting access to trails
and/or directing use to alternative routes has on number of recreation
encounters. An examination of the mountain bike trail alternatives, with routes
as suggested by the mountain bikers themselves, illustrates the importance of a
well thought out trail design on recreational encounters. As can be seen in
this research both alternative trail designs significantly reduce the number of
encounters with other recreation groups. If encounters with hikers does have an
accumulated negative effect on a mountain biker’s experience, or visa versa,
then separating recreation uses such as the alternative routes proposed in
these simulations could have some merit.
Simulation,
using agents that have behavioral traits synthesized from their human
counterparts, can provide a way to evaluate and test a variety of visitor use
encounters that are both spatial and temporal. These alternatives can be used
to develop new facilities along the trails, and to redirect trail use to
maximize recreation use levels while minimizing impact. Being capable of seeing
the agents interacting under a variety of constraints can assist the manager in
acquiring a better understanding of how human recreationists use and interact
on public lands and the public in understanding resulting management actions.
Implications for Recreation Management
Using agents to represent individuals or parties,
incorporating GIS to represent the environment and utilizing agent technology
has several advantages for guiding management decision making.
·
Provides
wilderness managers with a tool to develop
“what if” scenarios and provide options which will guide management
decisions to resolve recreation use interactions and can help to establish limits or standards;
·
The visualization using a spatially georeferenced environment for which
to view agent interactions under a variety
of constraints can assist the manager in acquiring a better understanding of
how human recreationists move through and interact on public lands;
· Allows wilderness managers
to explore the consequences of changes to any one or more of the variables so
that management actions may be implemented to ensure the nominated recreation
experience are improved;
· Allows wilderness managers
to explore and compare alternative management regimes and their consequences in
terms of policies and impacts;
· Utilizing GIS makes the
simulation model easy for policy makers, planners, managers and the public to
understand and respond appropriately to existing and projected changes to
increasing demand;
Conclusions
This
paper has introduced a simulation system RBSim that was derived from the idea
of using multi-agent systems coupled with GIS and visitor use data to simulate
and examine recreation use and associated interactions as a method for devising
management strategies to reduce them. While the study outlined in this paper is
by no means conclusive it does, however, illustrate a fresh view for those
studying both social and environmental impacts of recreation. While agent simulations are a relatively new concept in natural
resource management, we believe they are an excellent technique for modeling
the spatial and temporal aspects of recreation encounters. The agent simulations provide a dynamic view
of encounters between agents and identify the spatially explicit locations
where they occur. The effect of these encounters on the overall recreational
experience is still unknown. However, this simulation environment provides a
way to test and evaluate many scenarios of recreational use. Using a complex
systems approach in the development of RBSim is a significant step forward in
providing practical tools for managers to aid in decision-making.
Acknowledgments
We wish to thank the USDA Forest Service, Rocky Mountain Forest and Range Experiment Station and the Coconino National Forest for their assistance in facilitating this research effort. We also wish to thank Dr. B.L. Driver of the Rocky Mountain Station for his helpful review and oversight of this project. This research was supported in part by funds provided by the Rocky Mountain Forest and Range Experiment Station, Forest Service, U.S. Department of Agriculture.
Note: Instructions for obtaining
a free copy of RBSim can be downloaded from the following website http://nexus.srnr.arizona.edu/~gimblett/rbsim.html
as well as the development of a more enhanced version of the software.
Literature Cited
Borkan, R.E. & A. H.
Underhill. 1989. Simulating the Effects of Glen Canyon Dam Releases on Grand
Canyon River Trips. Environmental Management Spring, 1989.
Gimblett, H.R. & R. M.
Itami. 1997. Modeling the Spatial Dynamics and Social Interaction of Human
Recreators Using GIS and Intelligent Agents. MODSIM 97 - International
Congress on Modeling and Simulation. December 8-11, 1997. Hobart, Tasmania.
Gimblett, H.R., T. Daniel
& M. J. Meitner. 2000a. An
Individual-based Modeling
Approach Simulating
Recreation Use in Wilderness Settings. In: Cole, David N.; McCool, Stephen F.
2000. Proceedings: Wilderness Science in a Time of Change. Proc. RMRS-P-000.
Ogden. UT; U.S. Department of Agriculture, Forest Science, Rocky Mountain
Research Station.
Gimblett, H.R., R.M. Itami
& M. Richards. 2000b. Simulating Wild land Recreation Use and
Conflicting Spatial Interactions using Rule-Driven Intelligent Agents. In
H. R Gimblett, Editor. Integrating GIS and Agent based modeling techniques for
Understanding Social and Ecological Processes. Oxford University Press. 2000.
Itami, R.M. 2000. Mobile Agents with Spatial Intelligence. In H. R Gimblett, Editor.
Integrating GIS and Agent based modeling techniques for Understanding
Social and Ecological Processes. Oxford University Press. 2000.
Louviere, J. J., H.
Schroder, C. H. Louviere & G.G. Woodworth. 1986. Do the parameters of
choice models depend on differences in stimulus presentation: Visual versus
verbal presentation? In: proceedings
of Association of Consumer Research Annual Meeting. October 16-19, 1986.
Toronto, Canada. Pp. 79-82.
McCool, S. F., D.W. Lime & D. H. Anderson. 1977.
Simulation Modeling as a tool
for managing river
recreation,
pgs. 304-311 in Proceedings: River recreation, management and research
symposium. USDA Forest Service General Technical Report NC-28.
Shechter, M. 1975. Simulation Model of Wilderness
use: Model User’s Manual.
Springfield, VA. National
Technical Information Service, pgs. 251 635.
Shechter, M., & R. L. Lucus. 1978. Simulation
of Recreational use for park and
Wilderness management. John Hopkins University
Press. Baltimore. Pp. 220.
Shelby, B. & T. Heberlein, 1986. Carrying Capacity in Recreation Settings.
Oregon
State University Press.
1986.
Smith, V. K. & J.V. Krutilla, 1976. Structure
and Properties of a Wilderness Travel
Simulator: An Application to
the Spanish Peaks Area. Baltimore. Johns Hopkins University Press for Resources for the
Future. 1976.
Richards, M. T. & T. C.
Daniel. 1991. Measurement of Recreation and Aesthetic
Resources in
Southwestern Ponderosa Pine Forests. In: Multiresource Management of Southwestern
Ponderosa Pine Forests: The Status of Knowledge, Chapter 7. A. Tecle and W.
Covington, Eds. USDA Forest Service, Southwestern Region. 410p.
Wang, B. & R. E. Manning, 1999. Computer
Simulation Modeling for Recreation
Management: A Study on
Carriage Road Use in Acadia National Park, Maine, USA. Environmental
Management, 23:193-203.
Wing, M & B. Shelby. 1999. Using GIS to Integrate Information on
Forest Recreation. Journal of Forestry.
January 1999. Volume 97, Number 1. Pgs 12 –16.
Table and Figures
|
|
Figures 1 (A) (B) & (C) |
Figure 2 (A) |
Figure 3 (A) |
|||
|
|
Mean
Max |
Mean Max |
Mean
Max |
|||
|
HVIS |
|
|
|
|
|
|
|
Hike |
7.0 |
20 |
6.9 |
20 |
6.9 |
22 |
|
Bike |
6.4 |
25 |
2.1 |
13 |
2.6 |
10 |
|
Jeep |
2.9 |
15 |
2.7 |
17 |
2.7 |
18 |
|
BVIS |
|
|
|
|
|
|
|
Hike |
5.1 |
18 |
1.4 |
17 |
1.9 |
18 |
|
Bike |
5.5 |
24 |
4.5 |
12 |
2.0 |
12 |
|
Jeep |
.51 |
7 |
.41 |
8 |
.67 |
7 |
|
JVIS |
|
|
|
|
|
|
|
Hike |
2.1 |
12 |
2.1 |
7 |
2.3 |
15 |
|
Bike |
1.2 |
10 |
.4 |
18 |
.33 |
5 |
|
Jeep |
1.3 |
11 |
5.1 |
19 |
4.5 |
18 |
Table 1 – Illustrates a
statistical comparison between simulation runs using
Original trail layouts with two alternatives.

Figure 1 (A) - 3-D View of
Hiker Encounters with other Agents Traveling Along Hiking Trail looking south
from Trail Head to Chicken Point
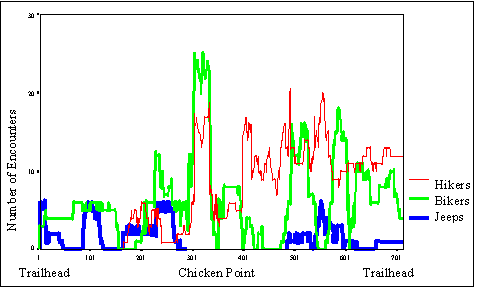
Figure 1 (A-A) - Graphed
Results of Hiker Encounters with Other Agents Traveling Along Hiking Trail

Figure 1 (B) - 3-D View of
Biker Encounters with other Agents Traveling Along Bike Trail looking South
from Trail Head to Chicken Point

Figure 1 (B-B) - Graphed Results of Biker Encounters with Other Agents Traveling Along Biking Trail

Figure 1 (C) - 3-D View of
Jeep Encounters with other Agents Traveling along the Jeep Trail looking South
from Trail Head to Chicken Point

Figure 1 (C-C) - Graphed Results of Jeep Encounters with Other Agents from along Jeep Trail

Figure 2 (A) - 3-D View of Total Encounters
Traveling Along Proposed Bike Trail Alternative 1 Looking South from Trail Head
to Chicken Point

Figure 2 (A-A) - Graphed Results of Hikers versus Other
Agents Encounters using Biking Alternative Trail 1

Figure 3 (A) - 3-D View of Total Encounters Traveling Along Proposed BikeTrail Alternative 2 Looking South from Trail Head to Chicken Point
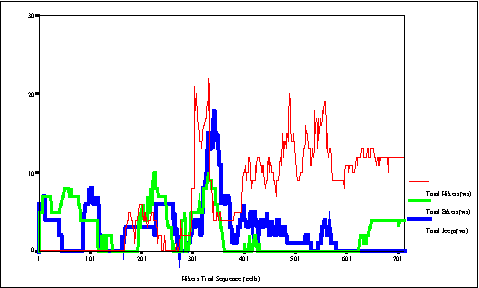
Figure 3 (A-A) - Graphed
Results of Hiker versus Other Agent Encounters Using Biking Alternative Trail 2