< Back to Climate Viticulture Newsletter
Hello, everyone!
This is the September 2025 issue of the Climate Viticulture Newsletter – a quick look at some timely climate topics relevant to wine grape growing in Arizona.
IN THIS ISSUE
- A Recap of August Temperature and Precipitation
- The Outlook for September Temperature and Precipitation
- Temperature Ranges and the Ripening Period
- Extra Notes
A Recap of August Temperature and Precipitation
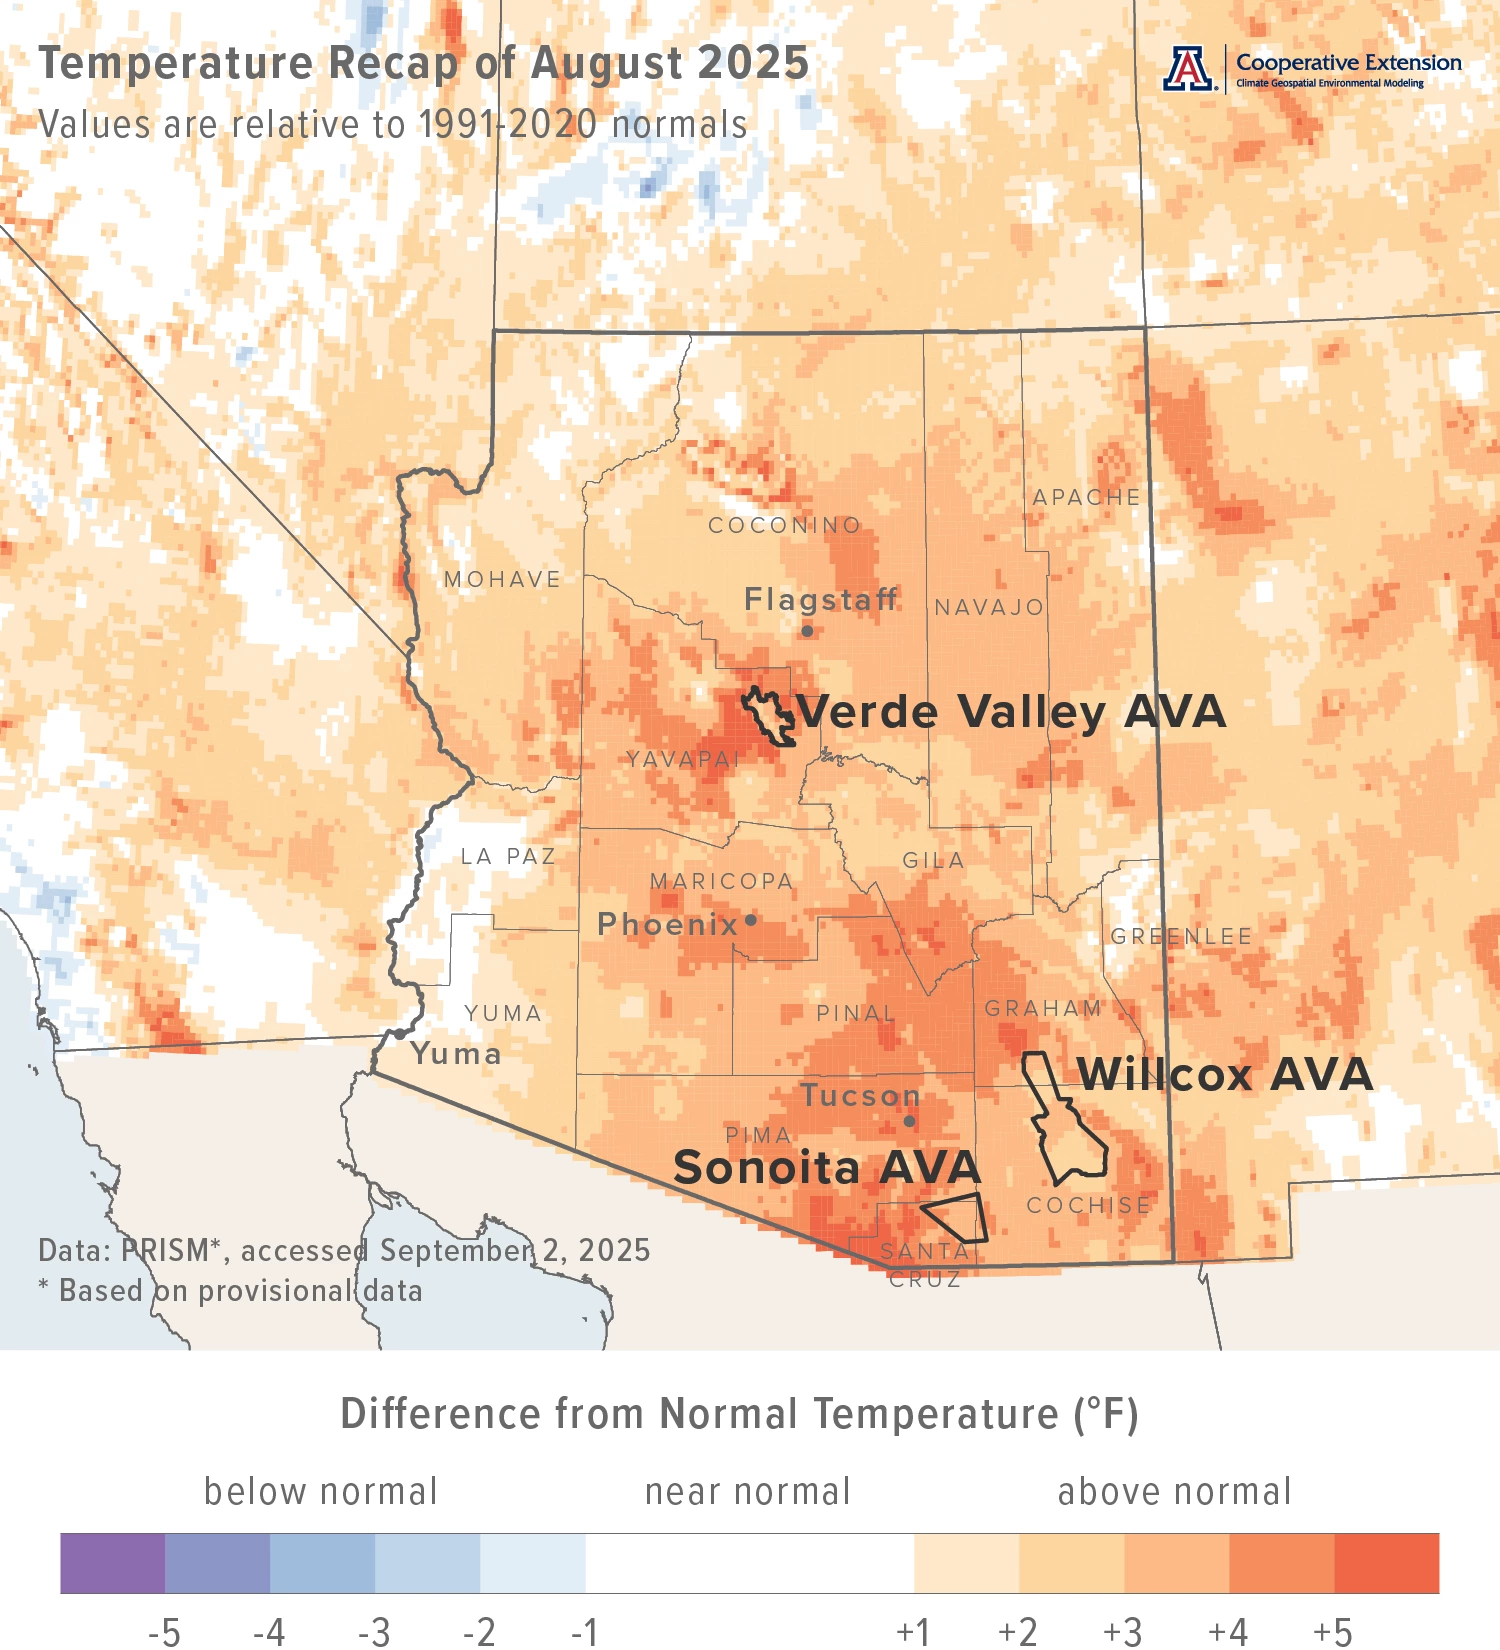
Monthly average temperatures were 1 to 4 °F above the 1991-2020 normal for much of Arizona (light orange, orange, and dark orange areas on map), including almost all locations in the three Arizona AVAs. Some central and south-central parts of the state saw temperatures more than 4 °F above normal (red-orange and dark red-orange areas on map). For reference, monthly average temperatures in August last year were 1 to 4 °F above normal for almost all of the state.
Area-average maximum and minimum temperatures during August 2025 were 90.5 and 65.2 °F for the Sonoita AVA, 100.0 and 68.6 °F for the Verde Valley AVA, and 95.8 and 65.3 °F for the Willcox AVA. Respective August normals are 86.3 and 61.7 °F, 95.7 and 65.2 °F, and 91.2 and 63.8 °F.
Temperature last month ranged between 104.2 and 58.1 °F at the AZMet Bonita station, 103.6 and 60.6 °F at the AZMet Elgin station, and 106.3 and 63.0 °F at the AZMet Willcox Bench station.
Jeremy Weiss
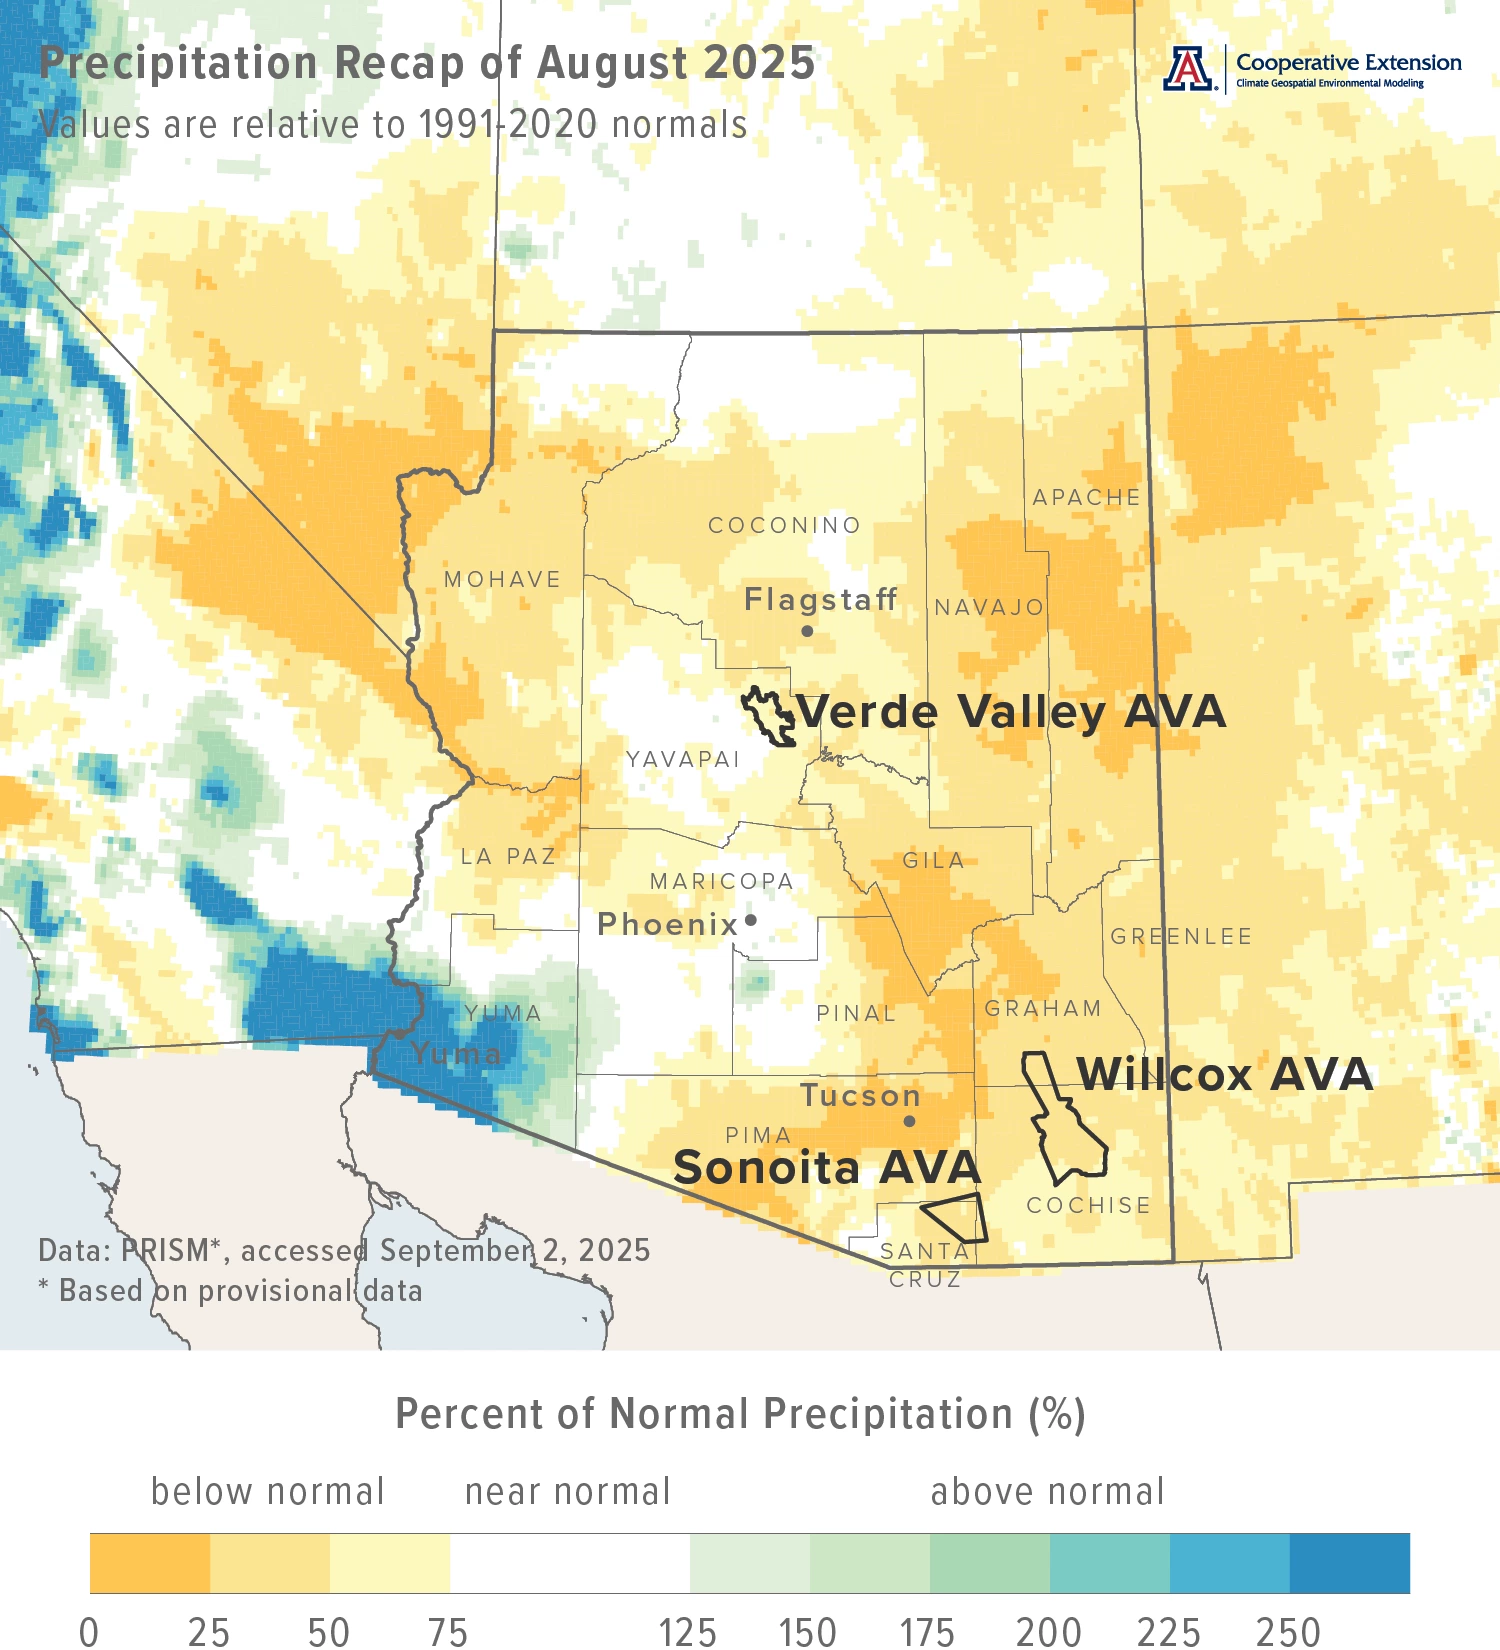
Monthly precipitation totals were between 25 and 75 % of normal for many parts of the state (light yellow and yellow areas on map), including all three Arizona AVAs. Some parts of south-central, northeastern, and northwestern Arizona measured amounts less than 25 % of normal (dark yellow areas on map). Only locations along the border with Utah, in central Yavapai County, and across the southwestern part of the state recorded near or above-normal totals (white and various aqua and blue areas on map). Precipitation during August 2024 was less than 75 % of normal for most of the southern, central, and western parts of the state. Parts of southeastern and much of north-central and northeastern Arizona recorded near-normal amounts. A few locations in extreme north-central and northeastern Arizona measured totals above 125 % of normal.
Area-average total precipitation in August 2025 was 1.63 inches for the Sonoita AVA, 1.51 inches for the Verde Valley AVA, and 1.12 inches for the Willcox AVA. Respective August normals are 3.95, 2.40, and 2.80 inches.
Total precipitation last month was 0.44, 0.79, and 2.64 inches at the AZMet Bonita, Elgin, and Willcox Bench stations, respectively.
Dig further into daily weather summaries for the AZMet Bonita and Willcox Bench stations in the Willcox AVA and the AZMet Elgin station in the Sonoita AVA
View seasonal summaries of monsoon rainfall through regional maps and weather station statistics
Learn more about PRISM climate data
Jeremy Weiss
The Outlook for September Temperature and Precipitation
Temperatures over the course of this month have a slight increase in chances for being above the 1991-2020 normal across the northeastern quarter of Arizona (light orange area on map). For the rest of the state, there are equal chances for below-, near-, or above-normal temperatures (white area on map). Monthly average temperatures in September last year were 2 to 5 °F above normal for most of the state. A few locations in the state escaped the near-record and record-level heat with near-normal temperatures.
Area-average maximum and minimum temperatures during September 2024 were 87.3 and 57.7 °F for the Sonoita AVA, 95.9 and 60.1 °F for the Verde Valley AVA, and 90.3 and 57.5 °F for the Willcox AVA. Respective September normals are 83.9 and 57.0 °F, 90.4 and 58.4 °F, and 87.8 and 58.3 °F.
Temperature in September last year ranged between 97.2 and 47.5 °F at the AZMet Bonita station and between 98.6 and 45.9 °F at the AZMet Willcox Bench station.

Jeremy Weiss
With a backdrop of sporadic late-season monsoon activity and occasional tropical cyclones along the western coast of Mexico that can move moisture into Arizona, precipitation totals for this month have equal chances for being below, near, or above normal across all of the state (white aqua area on map). Precipitation during September 2024 was less than 50 % of normal across all of Arizona.
Area-average precipitation totals in September 2024 were 0.62 inches for the Sonoita AVA, 0.19 inches for the Verde Valley AVA, and 0.38 inches for the Willcox AVA. Respective September normals are 1.95, 1.53, and 1.40 inches.
Total precipitation in September last year was 1.07 and 0.00 inches at the AZMet Bonita and Willcox Bench stations, respectively.
To stay informed of long-range temperature and precipitation possibilities beyond the coverage of a standard weather forecast, check in, too, with the six-to-ten-day outlook and eight-to-fourteen-day outlook issued daily by NOAA’s Climate Prediction Center.

Jeremy Weiss
Temperature Ranges and the Ripening Period
To help put the ripening period this year in perspective, we return to tracking hours of temperatures below 65 °F and above 95 °F. The reason why is that temperatures affect fruit quality through both early morning minimums and afternoon maximums as fruit ripens. With the former, for example, morning minimums above 65 °F can increase malic acid metabolism and lead to berries with a higher pH. With the latter, afternoon maximums above 95 °F can degrade anthocyanins, particularly in red-berry varieties.
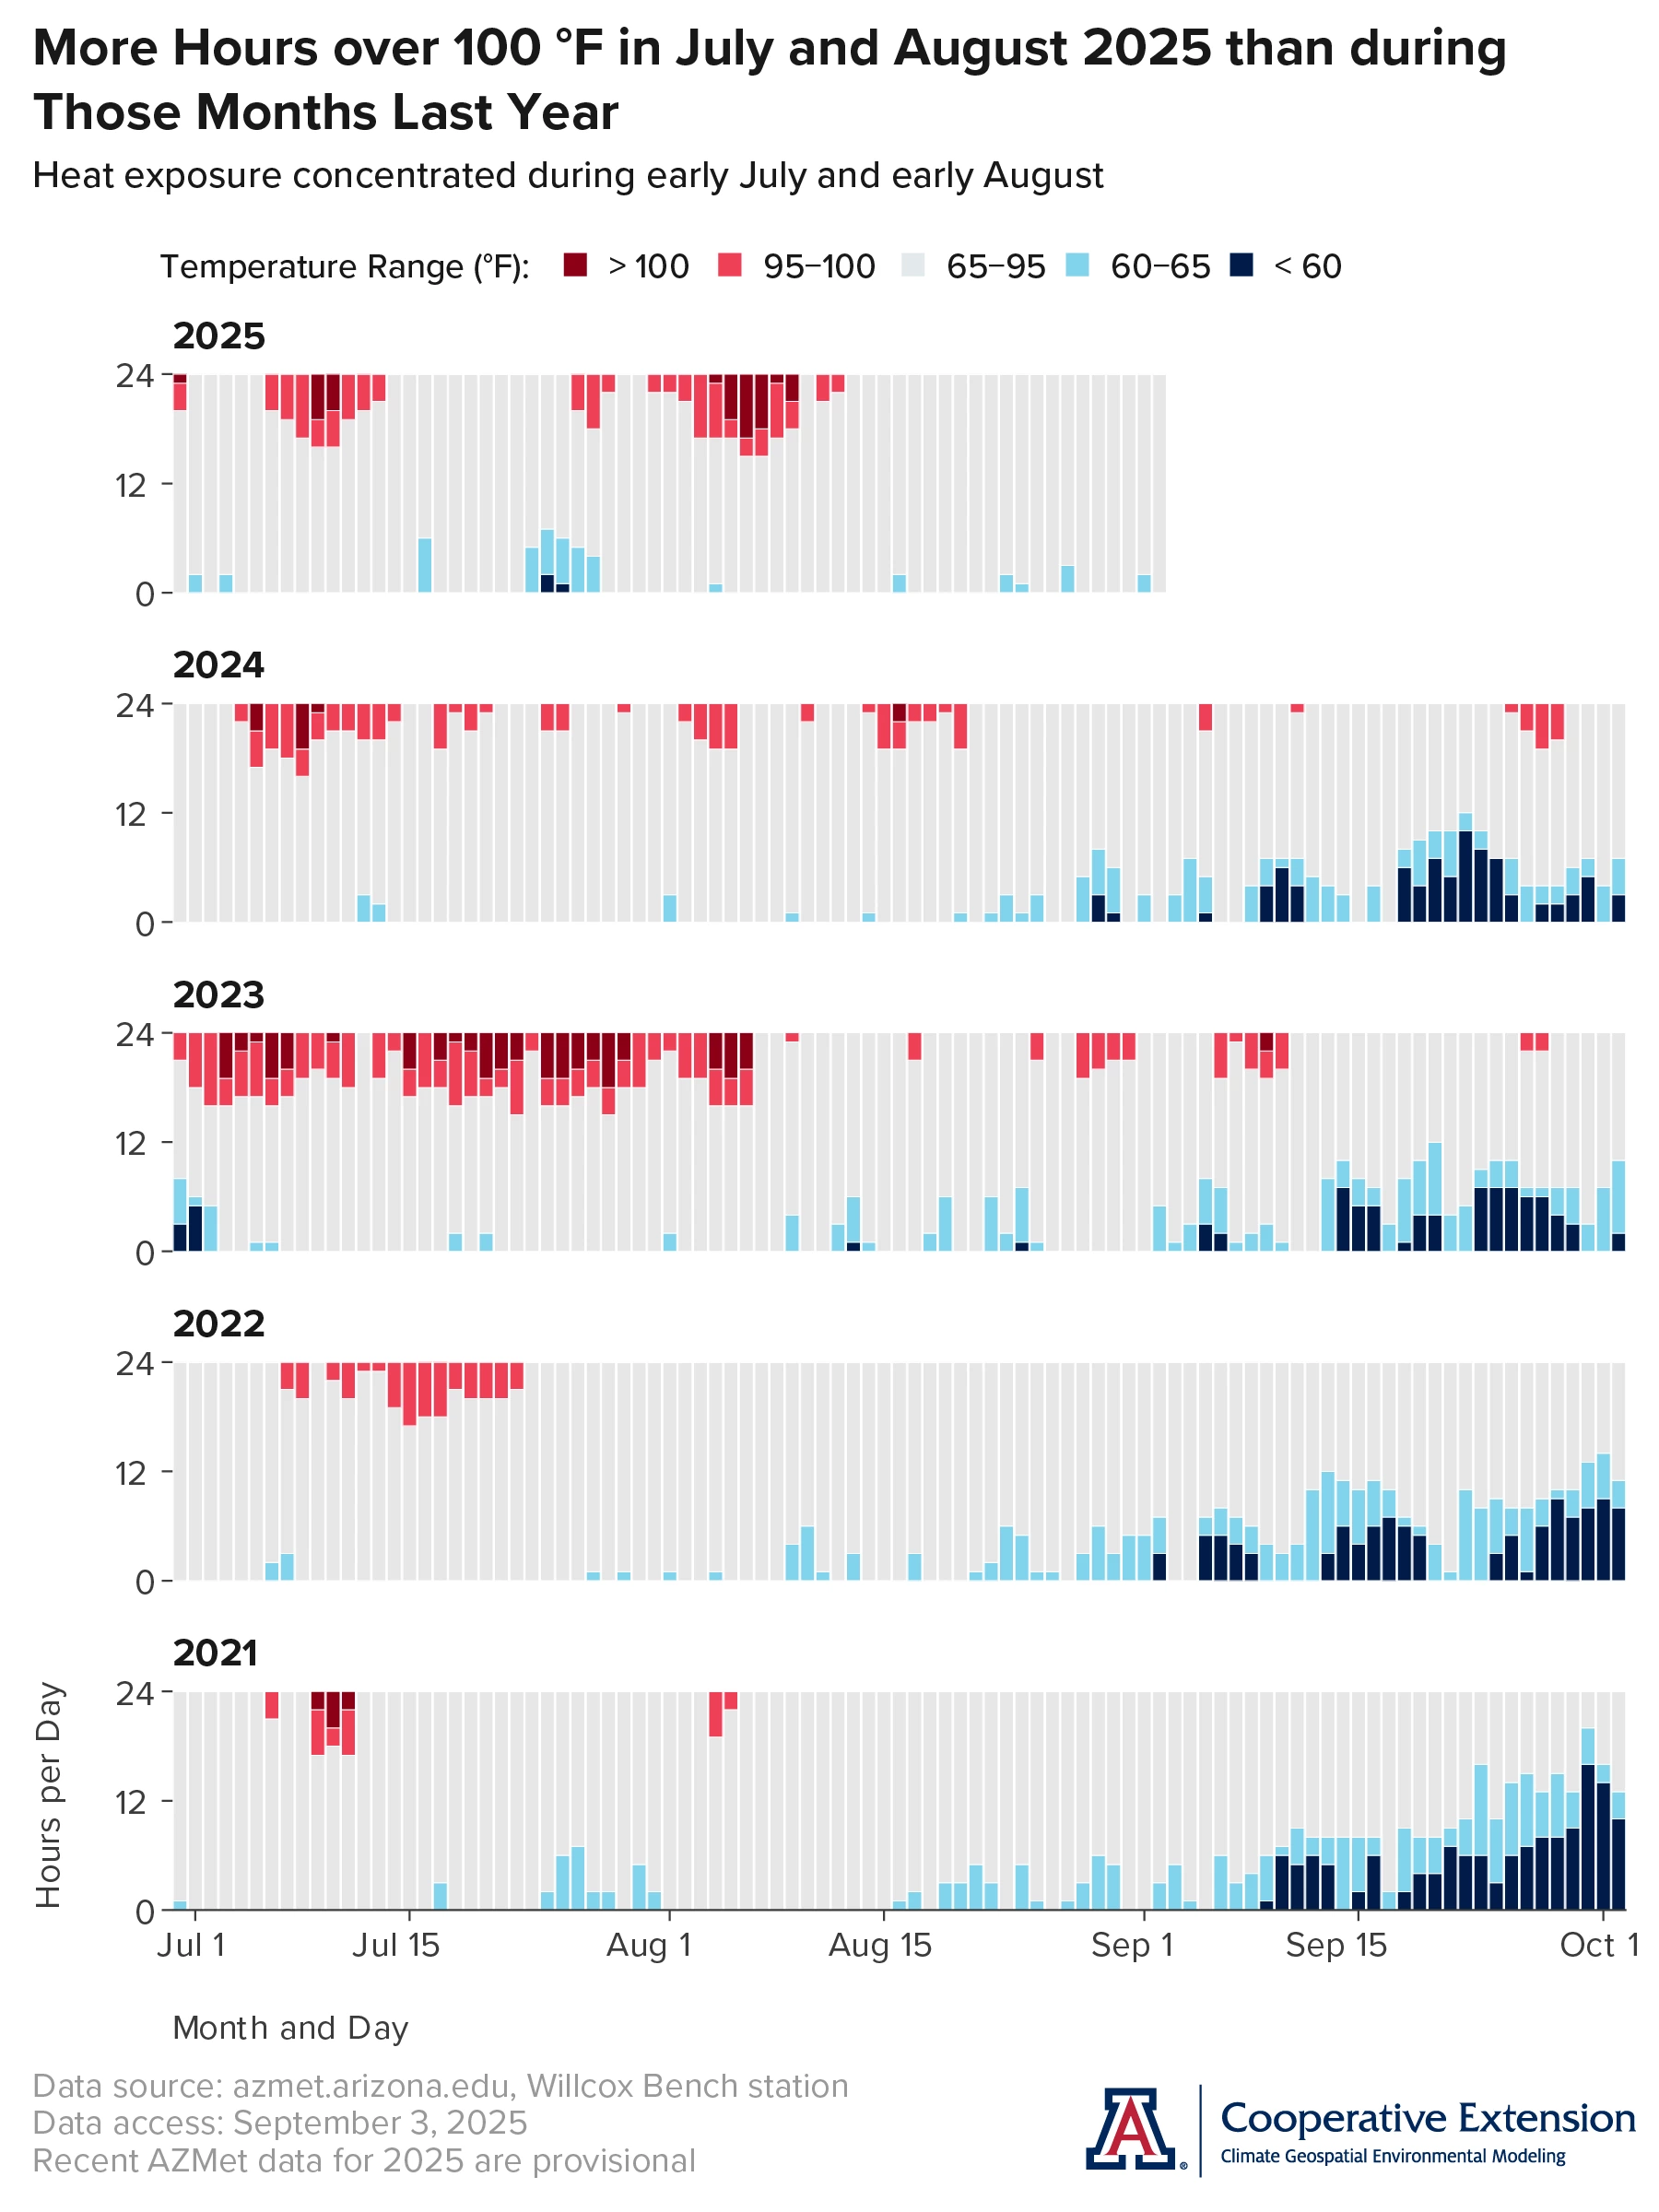
Based on data from the AZMet Willcox Bench station in the Willcox AVA, conditions in July and August led to eight days with average hourly temperatures over 100 °F (dark red bars on top graph), for a total of 32 hours. The highest average hourly temperature was 104.2 °F on August 7. Temperatures between 95 and 100 °F occurred on 23 days (light red bars on top graph), for a total of 88 hours. In July and August 2024, for comparison, there were four days and 11 hours with average hourly temperatures above 100 °F, and 30 days and 93 hours between 95 and 100 °F (dark and light red bars, respectively, in second-from-top graph). Heat exposure this year appears more concentrated during early July and early August.
There were 13 days during July and August 2025 with average hourly temperatures between 60 and 65 °F (light blue bars on top graph), for a total of 43 hours. Temperatures less than 60 °F (dark blue bars on top graph) occurred on two days, for a total of three hours. The lowest average hourly temperature was 58.5 °F on July 24. During July and August 2024, for comparison, there were 13 days and 34 hours with average hourly temperatures between 60 and 65 °F, and two days and four hours less than 60 °F (light and dark blue bars, respectively, in second-from-top graph).
The increase in humidity due to the monsoon during July and August is a typical feature that keeps daily minimum temperatures higher, as less heat radiates away from the surface and into the upper levels of the atmosphere during the night. Now that we’re into September, monsoon moisture moves out of the region and days become shorter and nights longer. Based on data from the previous four growing seasons, one might expect little to no exposure to temperatures over 95 °F and an increase of exposure to temperatures below 65 °F for varieties still ripening, at least near this location.
Jeremy Weiss
Extra Notes
Given recent and current conditions, there is an normal potential for significant wildland fires across all of Arizona in September, as based on the outlook from the National Interagency Fire Center.
Neither El Niño nor La Niña conditions look to affect regional weather over the coming months. There is 68 % chance that ENSO-neutral conditions remain for the rest of the August-through-October 2025 period. Chances are 50 % that they persist through the October-through-December 2025 period, and higher than probabilities for either El Niño or La Niña conditions during that period.
For those of you in southeastern Arizona, including the Sonoita and Willcox AVAs, Cooperative Extension manages an email listserv in coordination with the Tucson forecast office of the National Weather Service to provide information in the days leading up to agriculturally important events, like heavy rainfall from tropical cyclone remnants and late-season heat waves. Please contact us if you'd like to sign up.
And for those of you in north-central and northeastern Arizona, including the Verde Valley AVA, Cooperative Extension also now manages an email listserv in coordination with the Flagstaff forecast office of the National Weather Service to provide similar information for this part of the state. Please contact us if you'd like to sign up.
Undergraduate students in the College of Agriculture and Life Sciences at the University of Arizona are looking for internships with businesses and companies in the viticulture and winery industries. Please contact Danielle Buhrow, Senior Academic Advisor and Graduate Program Coordinator in the Department of Agricultural and Resource Economics, for more information.
Please feel free to give us feedback on this issue of the Climate Viticulture Newsletter, suggestions on what to include more or less often, and ideas for new topics.
Did someone forward you this newsletter? Please contact us to subscribe.
Have a wonderful September!
With current and past support from: