Sentinel Sites for Monitoring Aspergillus flavus
Community Structure in Southwestern Desert Agricultural Soils
Merritt R. Nelson1, Thomas V. Orum1,
Donna M. Bigelow1, and Peter J. Cotty2
1 Department of Plant Pathology, University
of Arizona
2 Southern Regional Research Center, USDA
, ARS
Monitoring the composition of Aspergillus flavus communities
is an important part of an aflatoxin management program based on biological
control using naturally occurring atoxigenic strains of the fungus.
We have studied the spatial characteristics of A. flavus S strain
incidence over the past five years using geographic information systems
and geostatistics. These studies have allowed us to document both
consistency and spatial variability in A. flavus community structure
and to develop predictive maps to monitor trends in A. flavus strain
composition in Yuma County. In 1998, we began to apply these
techniques in cotton-growing areas statewide. The primary goal of our work
in 1999 is to develop baseline data on the incidence of the atoxigenic
A.
flavus AF36 and the highly toxigenic A. flavus S strain prior
to large-scale treatment of cotton fields using AF36. This
is a collaborative study among the University of Arizona Department of
Plant Pathology, the Arizona Cotton Research and Protection Council
(ACRPC), and the Southern Regional Research Center of the ARS, USDA in
New Orleans, LA. The ACRPC is developing an aflatoxin management
program in which a key element is the treatment of large blocks of cotton
acreage in Arizona with the naturally occurring AF36.
In May and June of 1999, soil samples were collected from four fields
in each of ten areas from the Imperial Valley in southeastern California
to the San Simon area in southeastern Arizona (Figure 1). The goal
of the study is to develop baseline data to help assess long-term and statewide
impacts of the ACRPC treatments on A. flavus community structure
in crop soils. These sentinel sites are located at least 20 miles
from A. flavus AF36 treatment areas. Samples are being analyzed
for total
A. flavus propagule density, the incidence of the S strain,
and the incidence of AF 36.
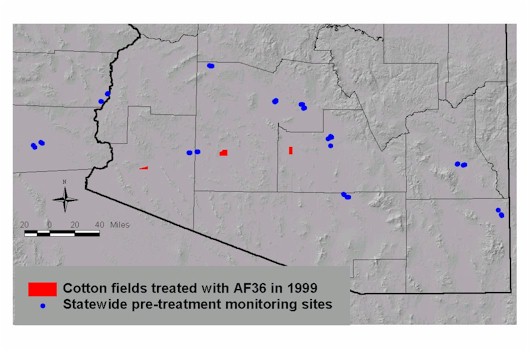
Figure 1. Location of sentinel sites for monitoring A.
flavus community structure (click image for larger view).
A surface map of the incidence of the A. flavus S strain was
generated from 1998 and 1999 data using geostatistics (Figure 2). The pattern
shows that, on average, S strain incidence is low in eastern Arizona and
high in western Arizona and southeastern California. The pattern
of S strain incidence is similar to the pattern of elevation across the
region (Figure 3). S Strain incidence in soil samples from fields
over 3000 feet in elevation is consistently less than 15% (Figure 4).
In contrast, S strain incidence in samples from fields under 2500 feet
in elevation is highly variable and frequently over 50%. The trend
line shows that on average S strain incidence decreases with increased
elevation from 0 to 2500 ft.
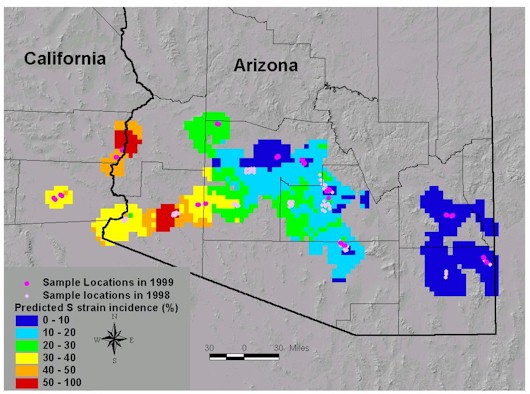
Figure 2. Map of expected average A. flavus S strain
incidence across Arizona based on samples taken in 1998 and 1999 (click
image for larger view).
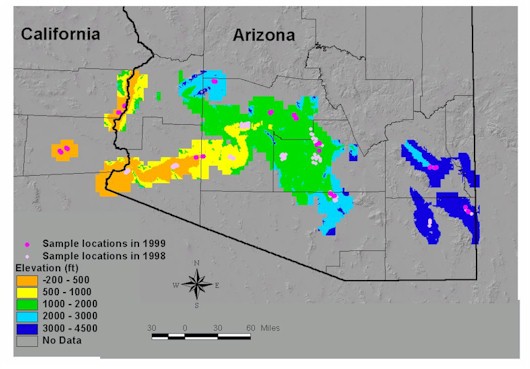
Figure 3. Map of elevation in cotton growing areas across Arizona
based on a digital elevation model (click image for larger view).
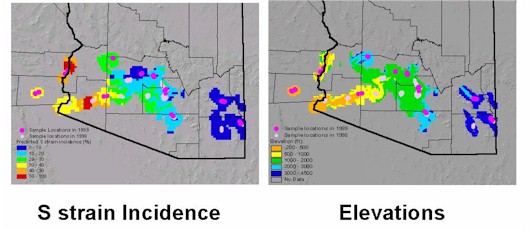
Figure 4. Side by side comparison of S strain incidence and elevation
maps (click image for larger view).
Figure 5. Relationship between elevation and S strain incidence.
Over 3000 feet, S strain incidence is consistently less than 15%.
Between 0 and 2500 feet, S strain incidence is highly variable, frequently
over 50%, and on average decreases with elevation.
The atoxigenic A. flavus AF36 used in the ACRPC aflatoxin management
program occurs naturally in Arizona at low levels. Analysis
of pre-treatment samples is not yet complete, but we have isolated AF36
from 9 of 20 fields. We anticipate isolating it from more fields
as the analysis of samples continues. AF36 has been isolated from
sites in the far southwestern sentinel site (Brawley, CA) and the far southeastern
site (San Simon, AZ) (Figure 6). Of the 692 A. flavus isolates
characterized thus far from the pre-treatment samples, fifteen (2.2%) are
AF36.
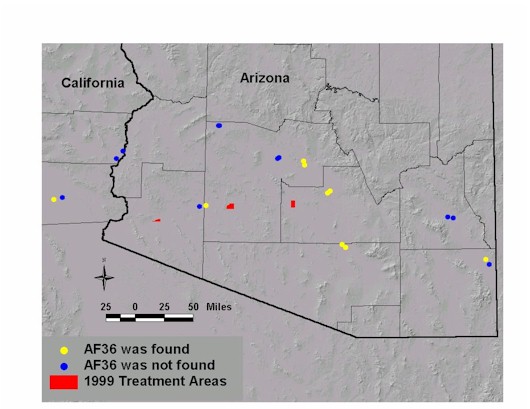
Figure 6. Location of sentinel sites where the naturally occurring
A. flavus AF36 has been isolated in pre-treatment sampling (click
image for larger view).
References:
Nelson, M. R., Orum, T. V., Jaime-Garcia, R., and Nadeem, A. 1998.
Applications of geographic information systems and geostatistics in plant
disease epidemiology and management. Plant Dis. 83:308-319.
Orum, T. V., Bigelow, D. M., Nelson, M. R., Howell, D. R., and Cotty,
P. J. 1997. Spatial and temporal patterns of Aspergillus flavus
strain composition and propagule density in Yuma County, Arizona, soils.
Plant Dis. 81:911-916.
Orum, T. V., Bigelow, D. M., Cotty, P. J., and Nelson, M. R. 1999. Using
predictions based on geostatistics to monitor trends in Aspergillus flavus
strain composition. Phytopathology 89:761-769.