Introduction
Insect pest populations seemed to be exceptionally abundant on our desert
vegetable crops this past growing season. It is difficult to explain why
some insect populations occurred in larger numbers this year, but the
weather we experienced may have had a significant role. Hot, dry weather
in the early fall and spring, coupled with moderate winter temperatures
provided ideal conditions for some insect pests. In other cases, pest
pressure was down from previous years. Of course there are other biotic
and abiotic factors (ie., natural mortality, cropping patterns, growing
and pest control practices) that influence pest outbreaks and abundance,
and those change from year to year.
Nonetheless, this report is an attempt to review the pest pressures we observed in the Yuma Valley during the 2003-2004 growing season. This was accomplished by summarizing data that we collected annually from untreated head lettuce plots and yellow sticky traps. What you will find in this report is a comparison of the abundance of whiteflies, worms, thrips and aphids this past season with numbers from previous years. Data for the most part is specific for the Yuma Valley and Yuma Ag Center where the studies were conducted, but in general the information should reveal trends and relative differences among insect pests for most Yuma growing areas.
Weather Patterns
Weather plays an important role in the development and regulation of insect
populations. In particular, temperatures are the driving force for their
biological development and behavior. Insects are poikliothermic (cold
blooded), and thus generally develop more rapidly rate when temperatures
are at 85-90 ºF. Insect flight, mating and ovipostional activity
is generally greatest when temperatures are warm. Conversely, when temperatures
are cool (ie., 50 ºF), biological activity is much slower. For example,
beet armyworm larvae can complete development from a newly hatched 1st
instar larvae to a pupa in about 7 days at temperatures averaging 86ºF,
but would require almost 12 days to complete development at 75 ºF.
But not all insects are the same. As you know, many of the aphid species
that infest lettuce and cole crops are most active during the winter and
spring when temperatures are cooler. However, they also have developmental
limits that are influenced by a range of temperatures.
Rain and wind also influences insect population dynamics, usually by
modifying their environment. Rain can influence the buildup of weeds and
other alternate host that harbor large insect populations. Once the plants
dry up, insects can disperse directly onto cultivated crops. Rain can
also cause direct mortality to some insects that are washed off plants
and suffocated in the soil. High winds can limit the insects ability to
move or fly. A good example of this is the poor pollination by honeybees
that occurs in windy conditions. Consequently, many of the differences
in pest pressure we experience each season are determined to some degree
by differences in weather conditions.
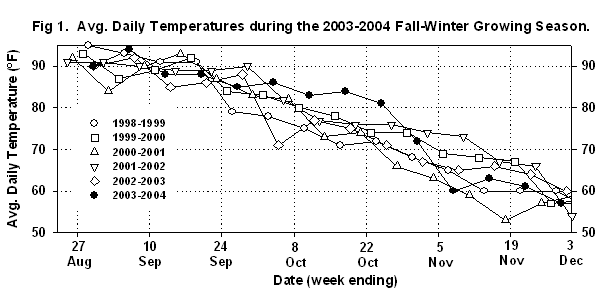
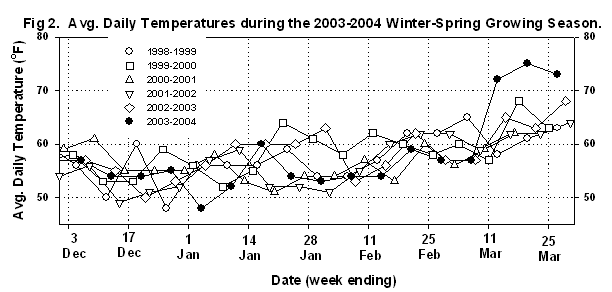
Figures 1 and 2 show average daily temperatures for the
produce growing season during the past 6 years (Data was summarized from
AZMET weather station located at the Yuma Ag Center, http://cals.arizona.edu/azmet/).
Temperatures varied quite a bit from year to year during this period,
and in some cases average temperatures varied as much as 15º F. In
most cases it is difficult to see clear trends in temperature. However,
what is very clear were the 2 extremes in temperatures experienced in
2003-2004. The first occurred during October where average daily temperatures
were 10-15º F warmer than observed in the previous years (Figure
1). The second extreme occurred at the end of the 2004 growing
season where similar differences were observed during much of March (Figure
2). As you will recall, both of these extremes had a marked
influence on produce crop growth and maturity, and directly influenced
the markets. Rainfall appeared to be less than average, where only the
2001-2002 season produced less rain (Table 1).
This past season was unusual because most of our measurable rainfall occurred
during November, which is generally a dry month. Finally, this past season
seemed to be windier than normal, but AZMET measurements would suggest
that it was not. Interestingly though, winds were light during the two
temperature extremes in October and March. The significance of these weather
extremes will be speculated upon in the discussions below.
Table 1. Seasonal Avg. rainfall recorded at the Yuma Ag Center.
Avg
Seasonal Rainfall (in.) |
||||||||
| Yr | Sep |
Oct |
Nov |
Dec |
Jan |
Feb |
Mar |
Avg. |
98-99 |
1.01 |
0 |
0.26 |
0.05 |
0 |
0.53 |
0 |
1.85 |
99-00 |
0.80 |
0 |
0 |
0 |
0 |
0.05 |
0.21 |
1.06 |
00-01 |
0.02 |
0.63 |
0 |
0 |
0.31 |
0.02 |
2.54 |
3.52 |
01-02 |
0 |
0.10 |
0.01 |
0.01 |
0 |
0 |
0 |
0.12 |
02-03 |
0.02 |
0 |
0.02 |
0 |
0 |
0.57 |
0.64 |
1.25 |
03-04 |
0.05 |
0 |
0.40 |
0 |
0.10 |
0.20 |
0.10 |
0.85 |
| Avg. | 1.9 |
0.73 |
0.69 |
0.06 |
0.41 |
1.37 |
3.49 |
|
Whiteflies
Based on our experiences over the past decade, whiteflies are most abundant
during the fall. This is a result of their numbers building up on cotton
and other crops during the summer when temperatures are ideal for biological
development. As cotton and other crops are terminated, whiteflies disperse
throughout the growing areas in search of suitable host plants like melons
and cole crops. For several years we have placed yellow sticky traps in
a grid from Gadsden to the North Yuma Valley throughout the season, collecting
traps weekly and counting the number of whiteflies, aphids, leafminers
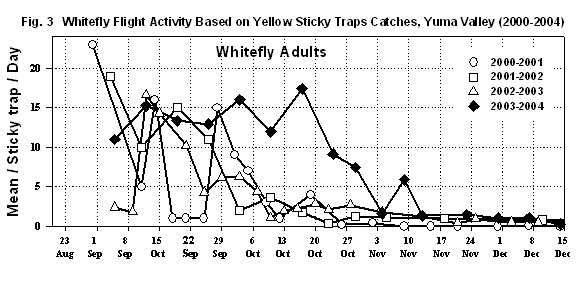
and thrips on each trap. Figure 3
below shows whitefly flight activity during the fall, as determined by
sticky traps, over the last 4 years. Historically, we have observed that
whiteflies move throughout the area in August and September. We typically
experience a considerable decline in movement in October when temperatures
begin to decline. However, last fall flight activity extended well into
October as illustrated in Figure 3.
It is probably no coincidence that these extended flights correlate strongly
with the higher temperatures we experienced in October (Figure
1). These temperatures also allowed for rapid whitefly development
on our cole crops and melons where we observed high densities infesting
untreated crops. Another factor which may have influenced this movement
was the light winds that were associated with the higher temperatures.
Winds averaged less than 4 mph during the first 3 weeks in October, compared
to previous years when winds consistently averaged over 6 mph (AZMET).
Worms (Beet Armyworm and Cabbage Loopers)
Without a doubt, the fall of 2003 was one of the heaviest worm years that
we’ve seen in quite a while. Anecdotal reports of PCA’s spraying
insecticides to control beet armyworm (BAW) and/or cabbage loopers (CL)
twice a week were common during September and October. There was good
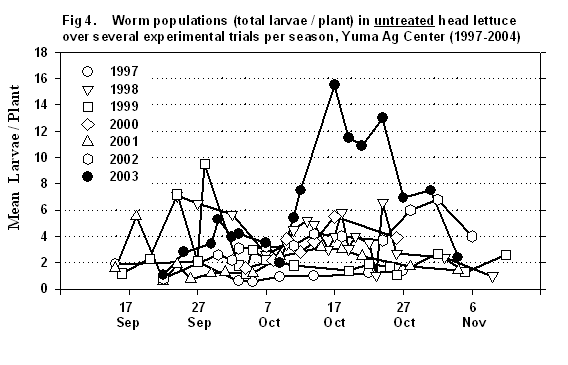
reason for this. Historical data generated from the untreated controls
of small plot efficacy trials conducted similarly each season from 1997
to 2003 at the Yuma Ag Center shows the large numbers of worms present
on lettuce plants in 2003 compared with previous years (Figure
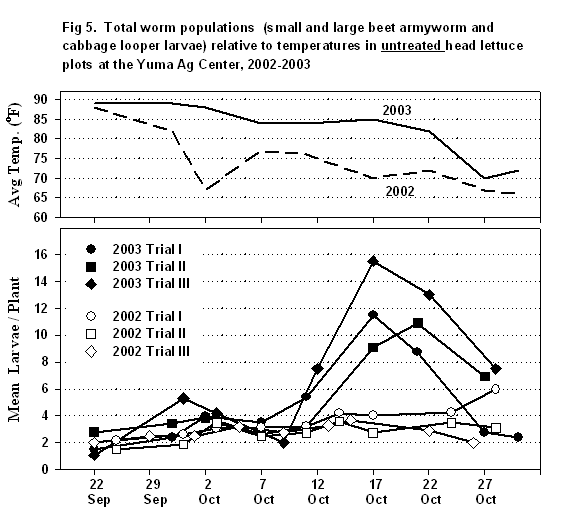
4). At their peak, BAW and CL averaged almost 16 larvae /
plant. That’s a lot of worms. Again, higher than average temperatures
(Figure 1) likely influenced the
buildup of this unusually large abundance of worms. Worm pressure usually
subsides during October when the weather breaks. However as shown in Figure
5 average daily temperatures in 2003 remained at or near
85 ºF during most of October resulting in 3-4 times greater numbers
of worms than measured in our 2002 trials. Average daily temperatures
differed by as much as 15 ºF during this time. Worm pressure finally
declined as temperatures broke in late October. Consequently, we are convinced
that the high worm pressure seen on fall produce in 2003-2004 was directly
influenced by weather. Temperatures had a significant impact on worm abundance
by accelerating larval development on plants. Larvae were able to complete
development at a more rapid rate (optimal temperature for development
has been shown to be 86 ºF). This resulted in more generations of
worms than normally observed. Furthermore, higher night time temperatures
likely provided an ideal environment for moth flight and oviposition.
This would result in greater egg lays. It was not unusual to see multiple
eggs and egg masses on larger plants throughout October. Finally, as discussed
above, the light winds probably enhanced moth flight activity.
Western Flower Thrips
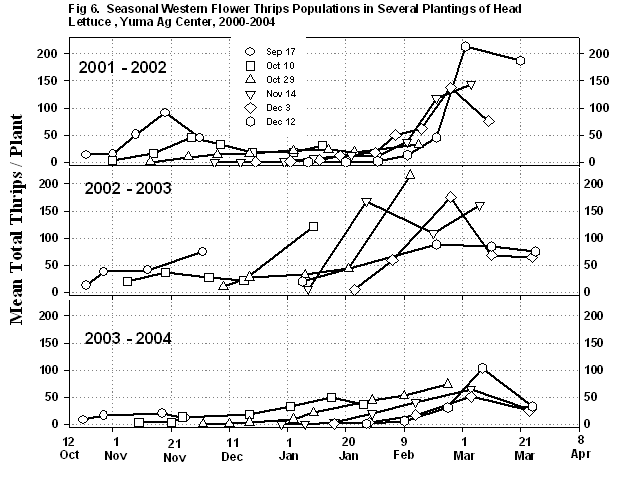
Over the past several years western flower thrips has become a common and often serious pest of lettuce. However, thrips abundance in Yuma lettuce during 2003-2004 was lighter than what we have experienced the past several years. We have been conducting trials at the Yuma Ag Center for the past several years to study the influence of planting dates on thrips population growth. Figure 6 shows the results of those studies to date. Thrips abundance never exceeded greater than 100 thrips /plant last season with the exception of 1 planting (Dec 12 wet date). However, thrips populations exceeded 100/plant in 3 and 4 plantings respectively in 2002 and 2003. Thrips pressure is generally low during Nov, Dec and Jan, the exception occurring during 2002-2003 where populations grew at rapid rates during this period. This can be explained in part to higher temperatures during the winter, particularly in January, 2003 (Figure 2). Temperatures may have also influenced thrips flight activity as shown in Figure 7. Trap catches of thrips were similar throughout the Yuma Valley for all years until late in the season. This year thrips dispersal at the end of the season was relatively lower than what we’ve seen in past years. Also, anecdotal reports from PCA’s suggest that thrips pressure was lighter this year. This may be due to some extent to high temperatures in March, but was more likely a result of heavy insecticide usage for aphids, and difference in cropping patterns. In general, we feel that thrips abundance and flight activity is generally highest in March as a result of optimal temperatures for development and flight, the rapid harvest of lettuce, and the reduced number of produce acres (Figures 6 and 7). Finally, to confirm what most PCA’s and growers already believe, our data set suggests that thrips population development in lettuce is generally greatest in late-November and December plantings (Table 2).
Aphids
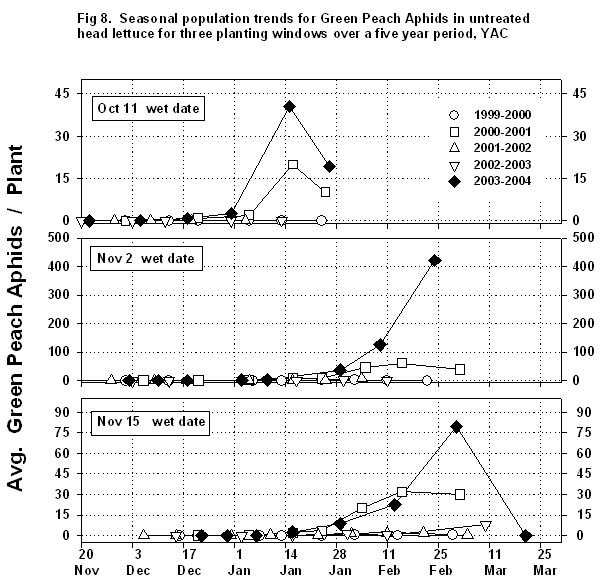
Aphid pressure was heavy for a second consecutive year in 2003-2004. Surprisingly, green peach aphids (GPA) were the predominant species throughout the area, relative to the last few years where it has been almost non-existent. PCA’s reported seeing GPA colonizing lettuce and cole crops in early November. Many populations required insecticide treatments to prevent economic infestations. Similar to our work with thrips, we have been conducting trials at the Yuma Ag Center for the past several years to study aphid population development across the season in several lettuce plantings (not treated with insecticide). The results from this work showed that over the past 5 growing seasons GPA populations were greatest last year (Table 3), with GPA peaking at over 400 / plant at harvest in our early November planting window (Figure 8). GPA continued to be abundant throughout the spring until March when populations quickly crashed due to high temperature (Figure 2). We are not certain why GPA was so abundant in 2004, as we are not sure how temperatures influence population growth during the winter. Average daily temperatures ranged between 50-55F for most of Dec, Jan and Feb, but it is more likely that the unusual GPA abundance in 2004 was a result of a complex of both abiotic and biotic factors.
Summaries across years and wet dates show that the seasonal aphid abundance differed by species. Whereas GPA appears to be prevalent in early November plantings, potato aphids are heaviest in late –November to early- December plantings (Table 4). Potato aphids were particularly heavy in 2003 as was lettuce aphid (Table 5) and foxglove aphids (Table 6). Lettuce aphid tends to be most abundant late in the season when temperatures average >60F. Although we only have 3 years for foxglove aphids, our information suggests that this aphid species has the wide range of activity. Compared with the other aphids, foxglove aphid has occurred in large number throughout the November and December plantings. Although we have seen heavy aphid pressure on produce the past 2 seasons, we less certain as to what factors contributed to these outbreaks. As we collect more data, we may be able to associate cropping practices or weather patterns that influence their abundance.
Acknowledgements
The information provided in this report would not have been possible without the funding and support provided by the Arizona Iceberg Lettuce Research Council and the cooperative assistance provided by numerous Yuma growers and PCA’s.
Table 2. Seasonal Western Flower Thrips (mean/plant)
on untreated lettuce, YAC
Wet
date |
Avg
|
||||||||
| Season | 17-Sep |
10-Oct |
30-Oct |
15-Nov |
2-Dec |
15-Dec |
|||
| 2001-2002 | 43.3 |
23.6 |
16.9 |
37.0 |
40.2 |
65.9 |
37.8 |
||
| 2002-2003 | 41.7 |
45.7 |
66.2 |
111.8 |
75.9 |
66.8 |
68.0 |
||
| 2003-2004 | 14.1 |
22.8 |
25.9 |
22.7 |
19.5 |
35.0 |
23.3 |
||
| Avg | 33.0 |
30.7 |
36.3 |
57.2 |
45.2 |
55.9 |
|||
Table
3. Seasonal Avg. Green Peach Aphids / Plant, YAC, 1999-2004
Wet
date |
Avg
|
|||||
| Season | 11-Oct |
2-Nov |
15-Nov |
3-Dec |
15-Dec |
|
| 1999-2000 | 0.0 |
0.1 |
0.1 |
0.3 |
0.2 |
0.1 |
| 2000-2001 | 5.5 |
20.4 |
12.6 |
4.7 |
5.7 |
9.8 |
| 2001-2002 | 0.0 |
1.0 |
0.7 |
0.2 |
0.1 |
0.4 |
| 2002-2003 | 0.0 |
0.8 |
1.8 |
0.0 |
0.3 |
0.6 |
| 2003-2004 | 15.8 |
117.0 |
23.0 |
10.6 |
12.0 |
35.7 |
| Avg | 4.3 |
27.9 |
7.6 |
3.2 |
3.7 |
|
Table 4. Seasonal Avg. Potato Aphidsa / Plant, YAC, 1999-2004
Wet
date
|
Avg
|
|||||
| Season | 11-Oct |
2-Nov |
15-Nov |
3-Dec |
15-Dec |
|
| 1999-2000 | 0.0 |
0.1 |
2.5 |
3.5 |
1.0 |
1.8 |
| 2000-2001 | 1.3 |
6.7 |
4.6 |
1.6 |
2.7 |
3.4 |
| 2001-2002 | 0.2 |
0.4 |
1.5 |
0.8 |
5.6 |
1.7 |
| 2002-2003 | 2.3 |
1.4 |
72.2 |
94.2 |
60.1 |
46.0 |
| 2003-2004 | 0.0 |
0.1 |
0.0 |
0.0 |
0.0 |
0.1 |
| Avg | 0.8 |
2.2 |
16.2 |
20.0 |
13.9 |
|
| a includes Acrythosiphum lactucae populations | ||||||
Table 5. Seasonal Avg. Lettuce Aphids / Plant, YAC, 1999-2004
Wet
date
|
Avg
|
|||||
| Season | 11-Oct |
2-Nov |
15-Nov |
3-Dec |
15-Dec |
|
| 1999-2000 | 0.0 |
0.1 |
1.6 |
1.2 |
4.4 |
1.8 |
| 2000-2001 | 0.0 |
1.0 |
1.2 |
3.1 |
9.1 |
2.9 |
| 2001-2002 | 0.0 |
0.0 |
0.9 |
0.2 |
0.7 |
0.4 |
| 2002-2003 | 0.0 |
0.1 |
5.1 |
32.8 |
40.2 |
15.6 |
| 2003-2004 | 0.0 |
0.0 |
0.0 |
0.9 |
0.5 |
0.14 |
| Avg | 0.0 |
0.3 |
1.8 |
7.5 |
11.0 |
|
Table 6. Seasonal Avg. Foxglove Aphidsb / Plant, YAC, 1999-2004
Wet
date
|
Avg
|
|||||
| Season | 11-Oct |
2-Nov |
15-Nov |
3-Dec |
15-Dec |
|
| 1999-2000 | - |
- |
- |
- |
- |
|
| 2000-2001 | - |
- |
- |
- |
- |
|
| 2001-2002 | 0.0 |
0.1 |
1.2 |
14.6 |
1.5 |
3.5 |
| 2002-2003 | 1.1 |
16.3 |
32.6 |
67.1 |
37.2 |
30.9 |
| 2003-2004 | 1.4 |
25.1 |
49.8 |
5.6 |
5.7 |
17.5 |
| Avg | 0.8 |
13.8 |
27.9 |
29.1 |
14.8 |
|
| b foxglove aphids not detected in Yuma lettuce prior to the 2001-2002 season | ||||||
Issued in furtherance of Cooperative Extension work, acts of May 8 and June 30, 1914, in cooperation with the U.S. Department of Agriculture, James A. Christenson, Director Cooperative Extension, College of Agriculture and Life Sciences, The University of Arizona.
The University of Arizona is an equal opportunity, affirmative action institution. The University does not discriminate on the basis of race, color, religion, sex, national origin, age, disability, veteran status, or sexual orientation in its programs and activities.
Any products, services, or organizations that are
mentioned, shown, or indirectly implied in this web document do not imply
endorsement by The University of Arizona.
Information provided by:
John C. Palumbo, jpalumbo@ag.arizona.edu Research Scientist (Entomology)
University of Arizona, Tucson, Arizona.
Material written June 2004.
For more Arizona Production Ag Information:
Home | Cotton | Veggies| Forages | Grains | Citrus | Crop x Crop | Insects | Diseases| Weeds | Pesticides | News | Weather | Research | Photos | Contacts | General Info. | Site Map
document located at: http://cals.arizona.edu/crops/counties/yuma/farmnotes/2004/fn0604insreview.html
Copyright © 2001 University of Arizona,
College of Agriculture and Life Sciences
Webmaster: Al Fournier (fournier@ag.arizona.edu)
