Multi-Scale Standardized Precipitation Index Time Series Plots for States and Regions in the U.S.
** Visit the Standardized Drought Index Viz Tool to generate custom plots!**(Click here Arizona and New Mexico Divisional Plots)
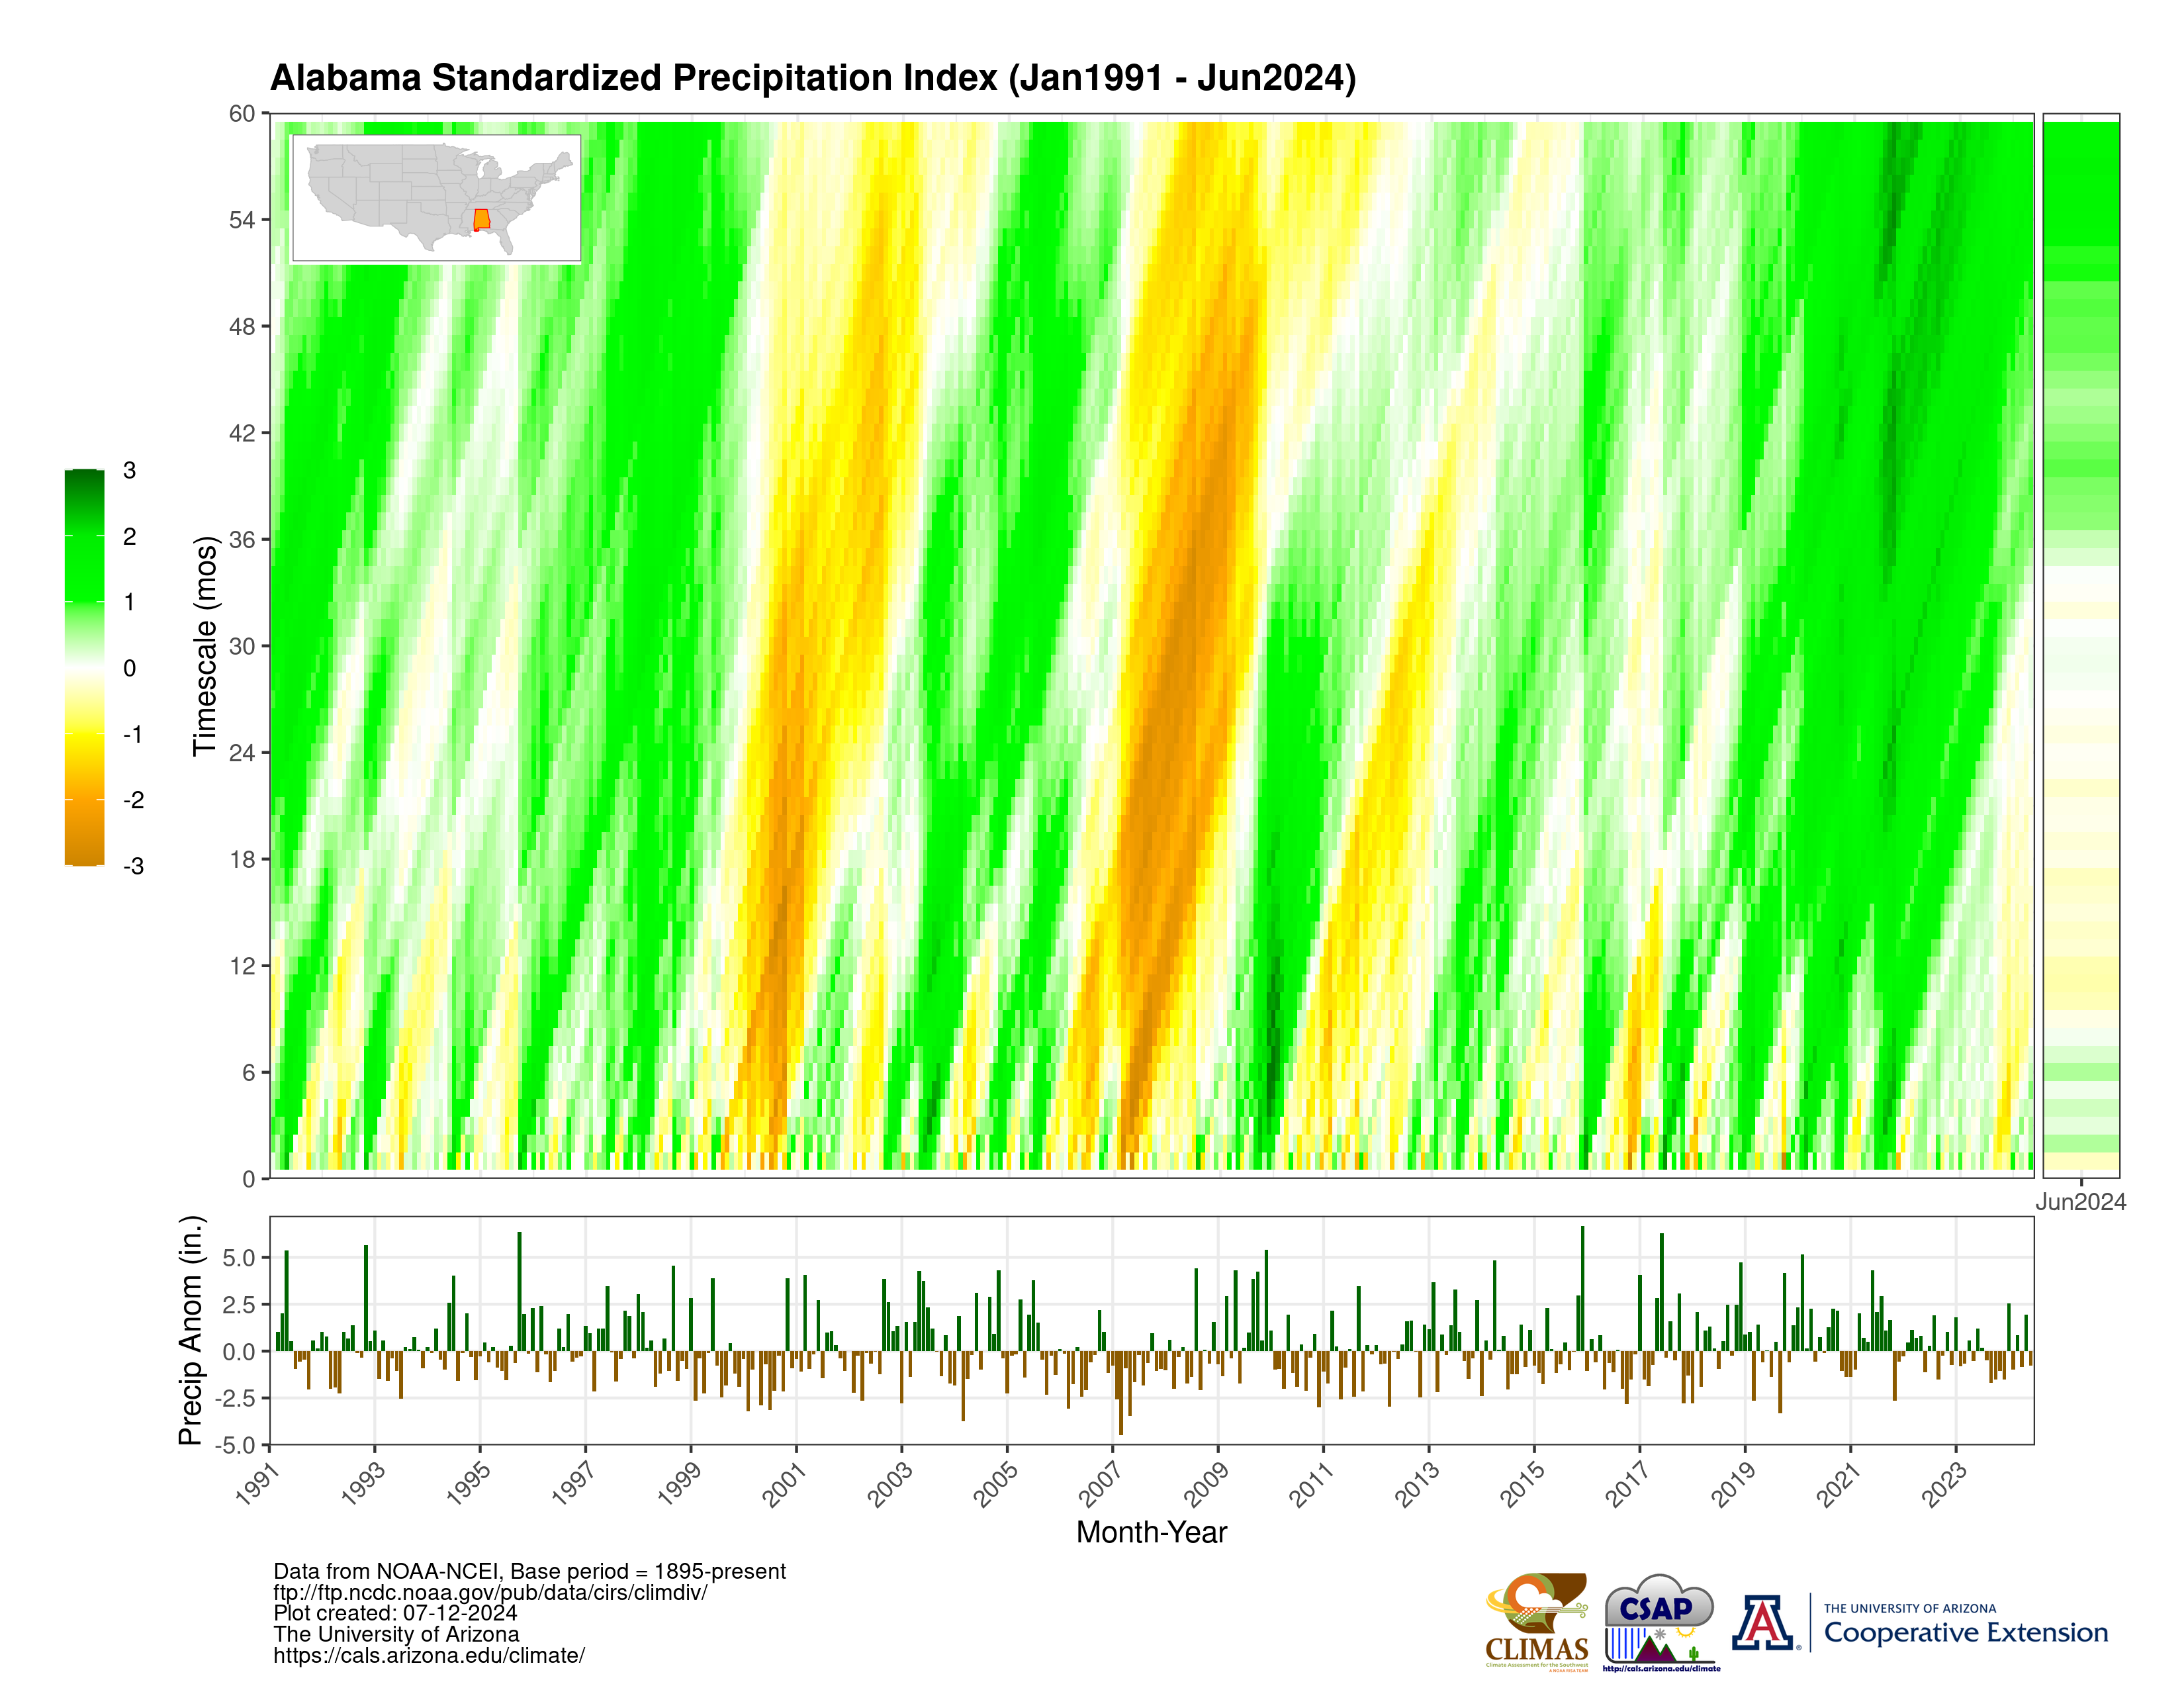
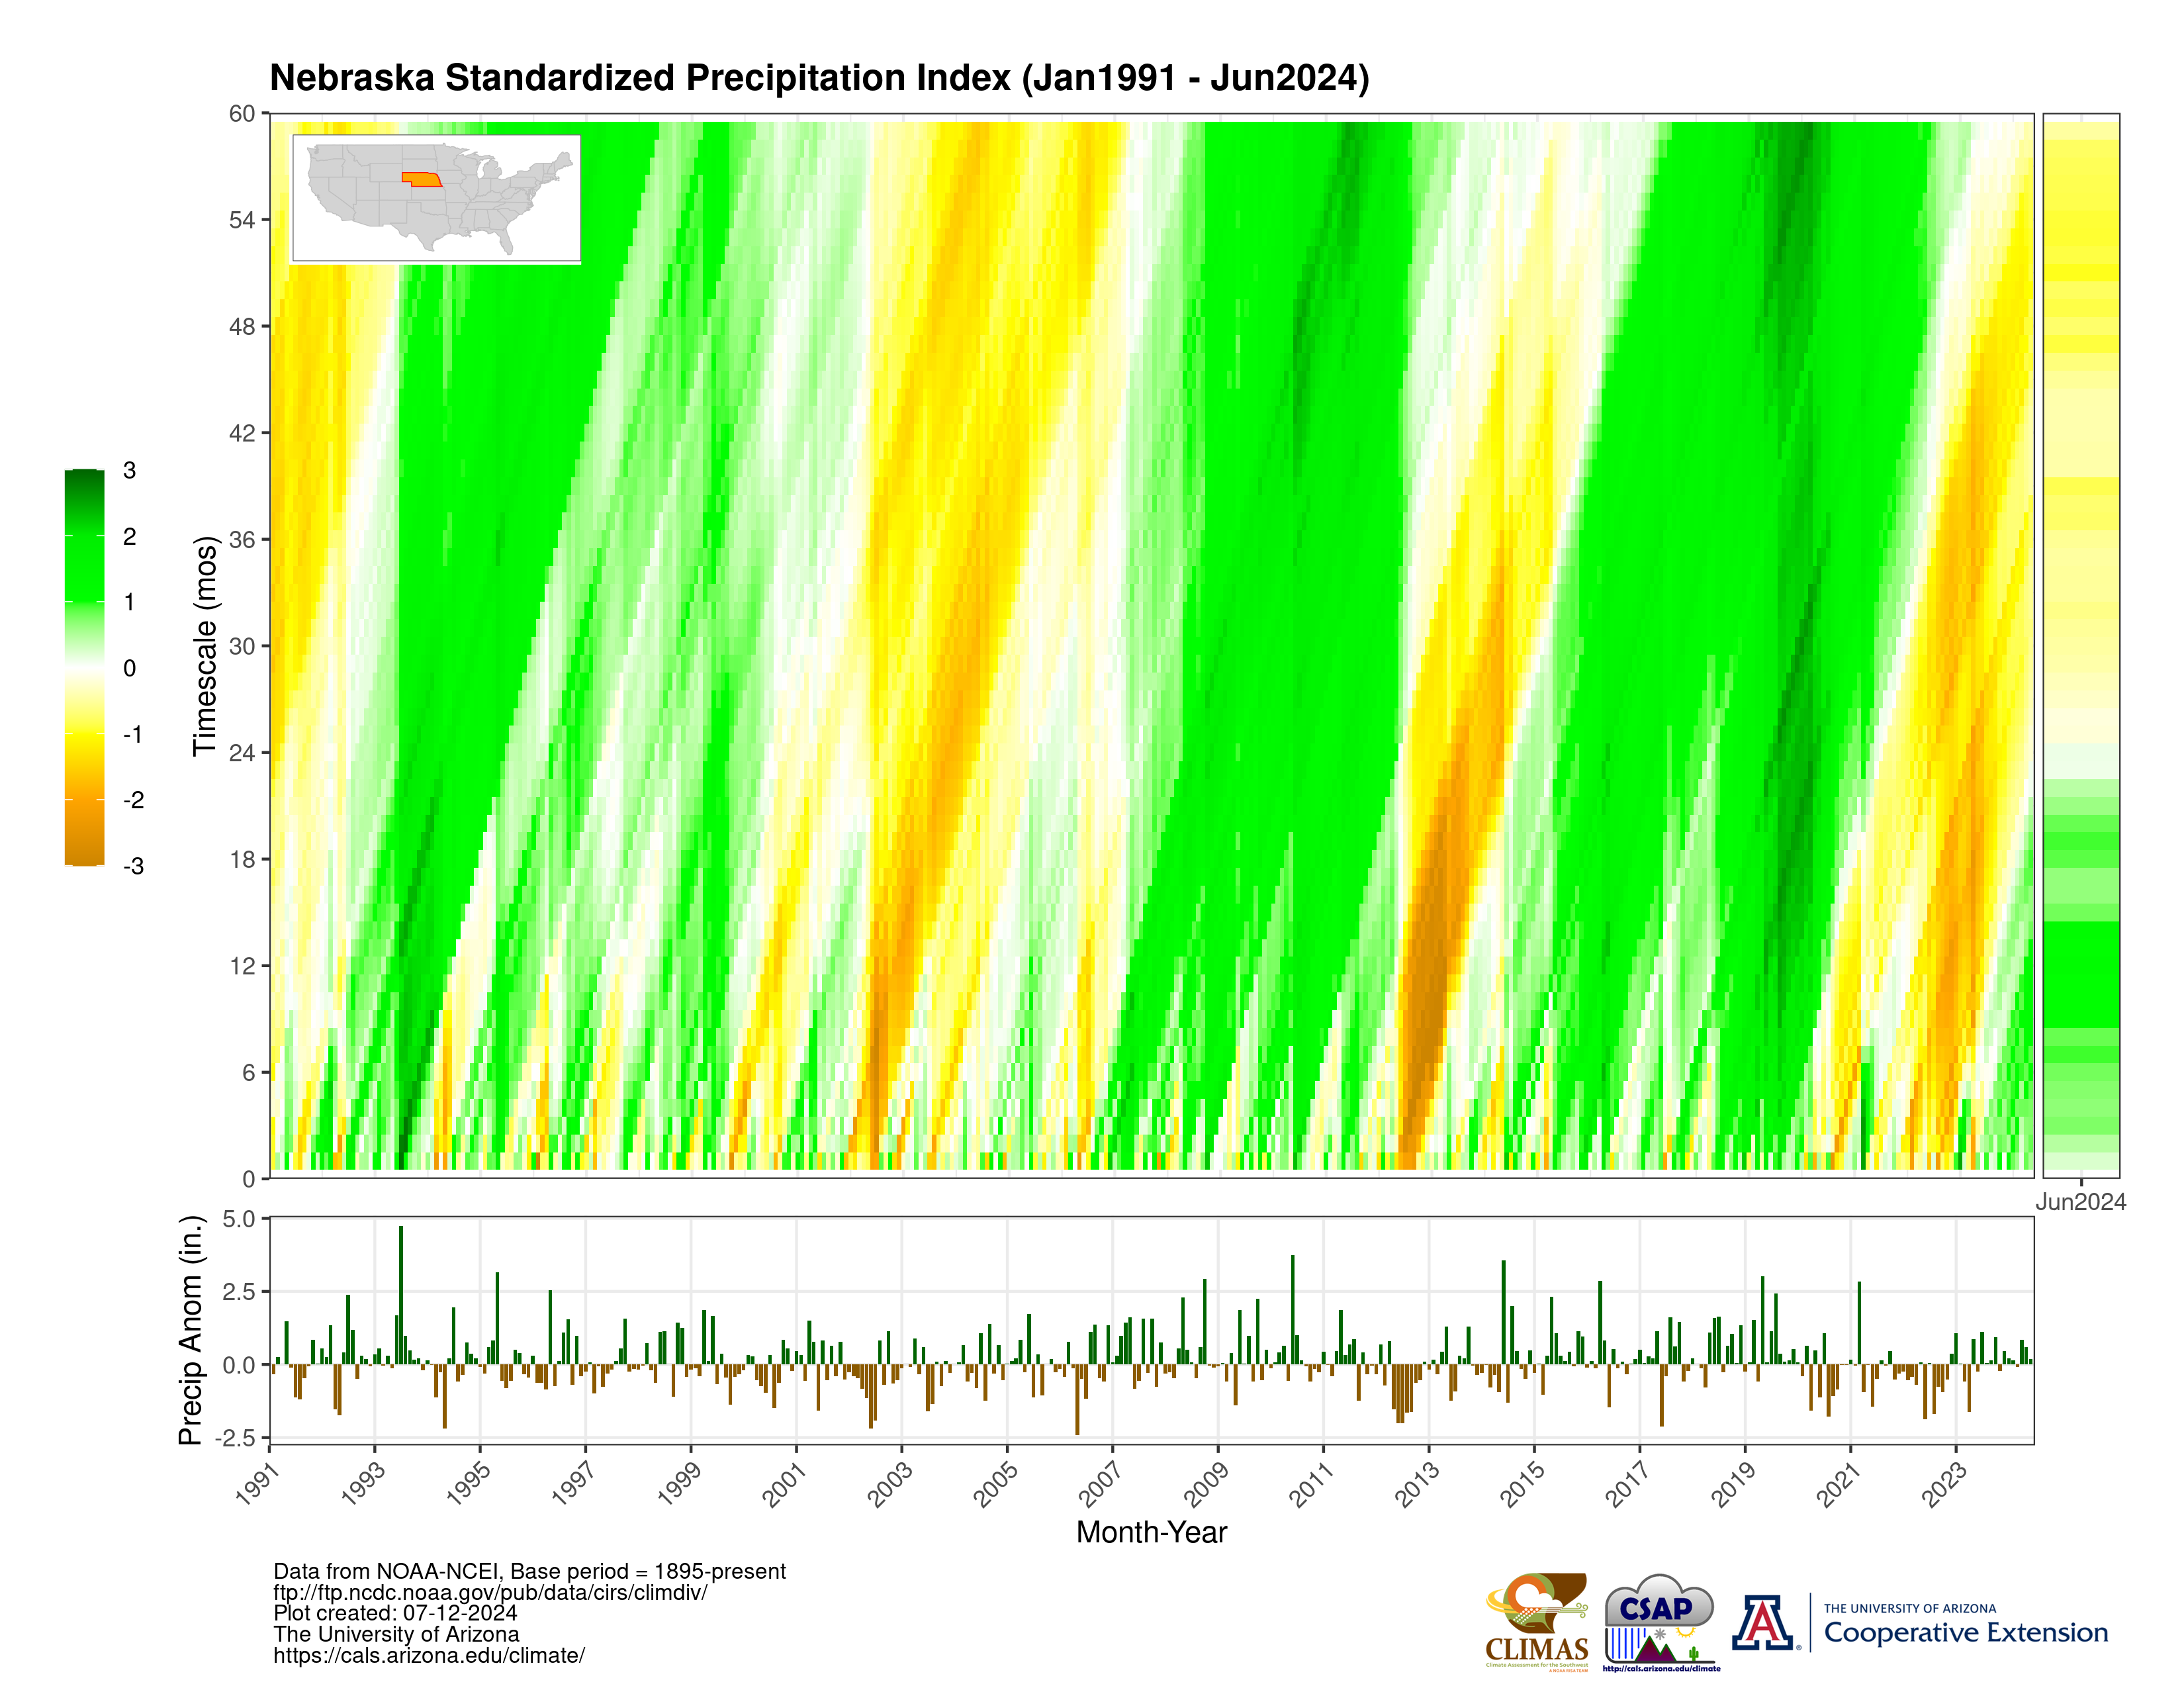
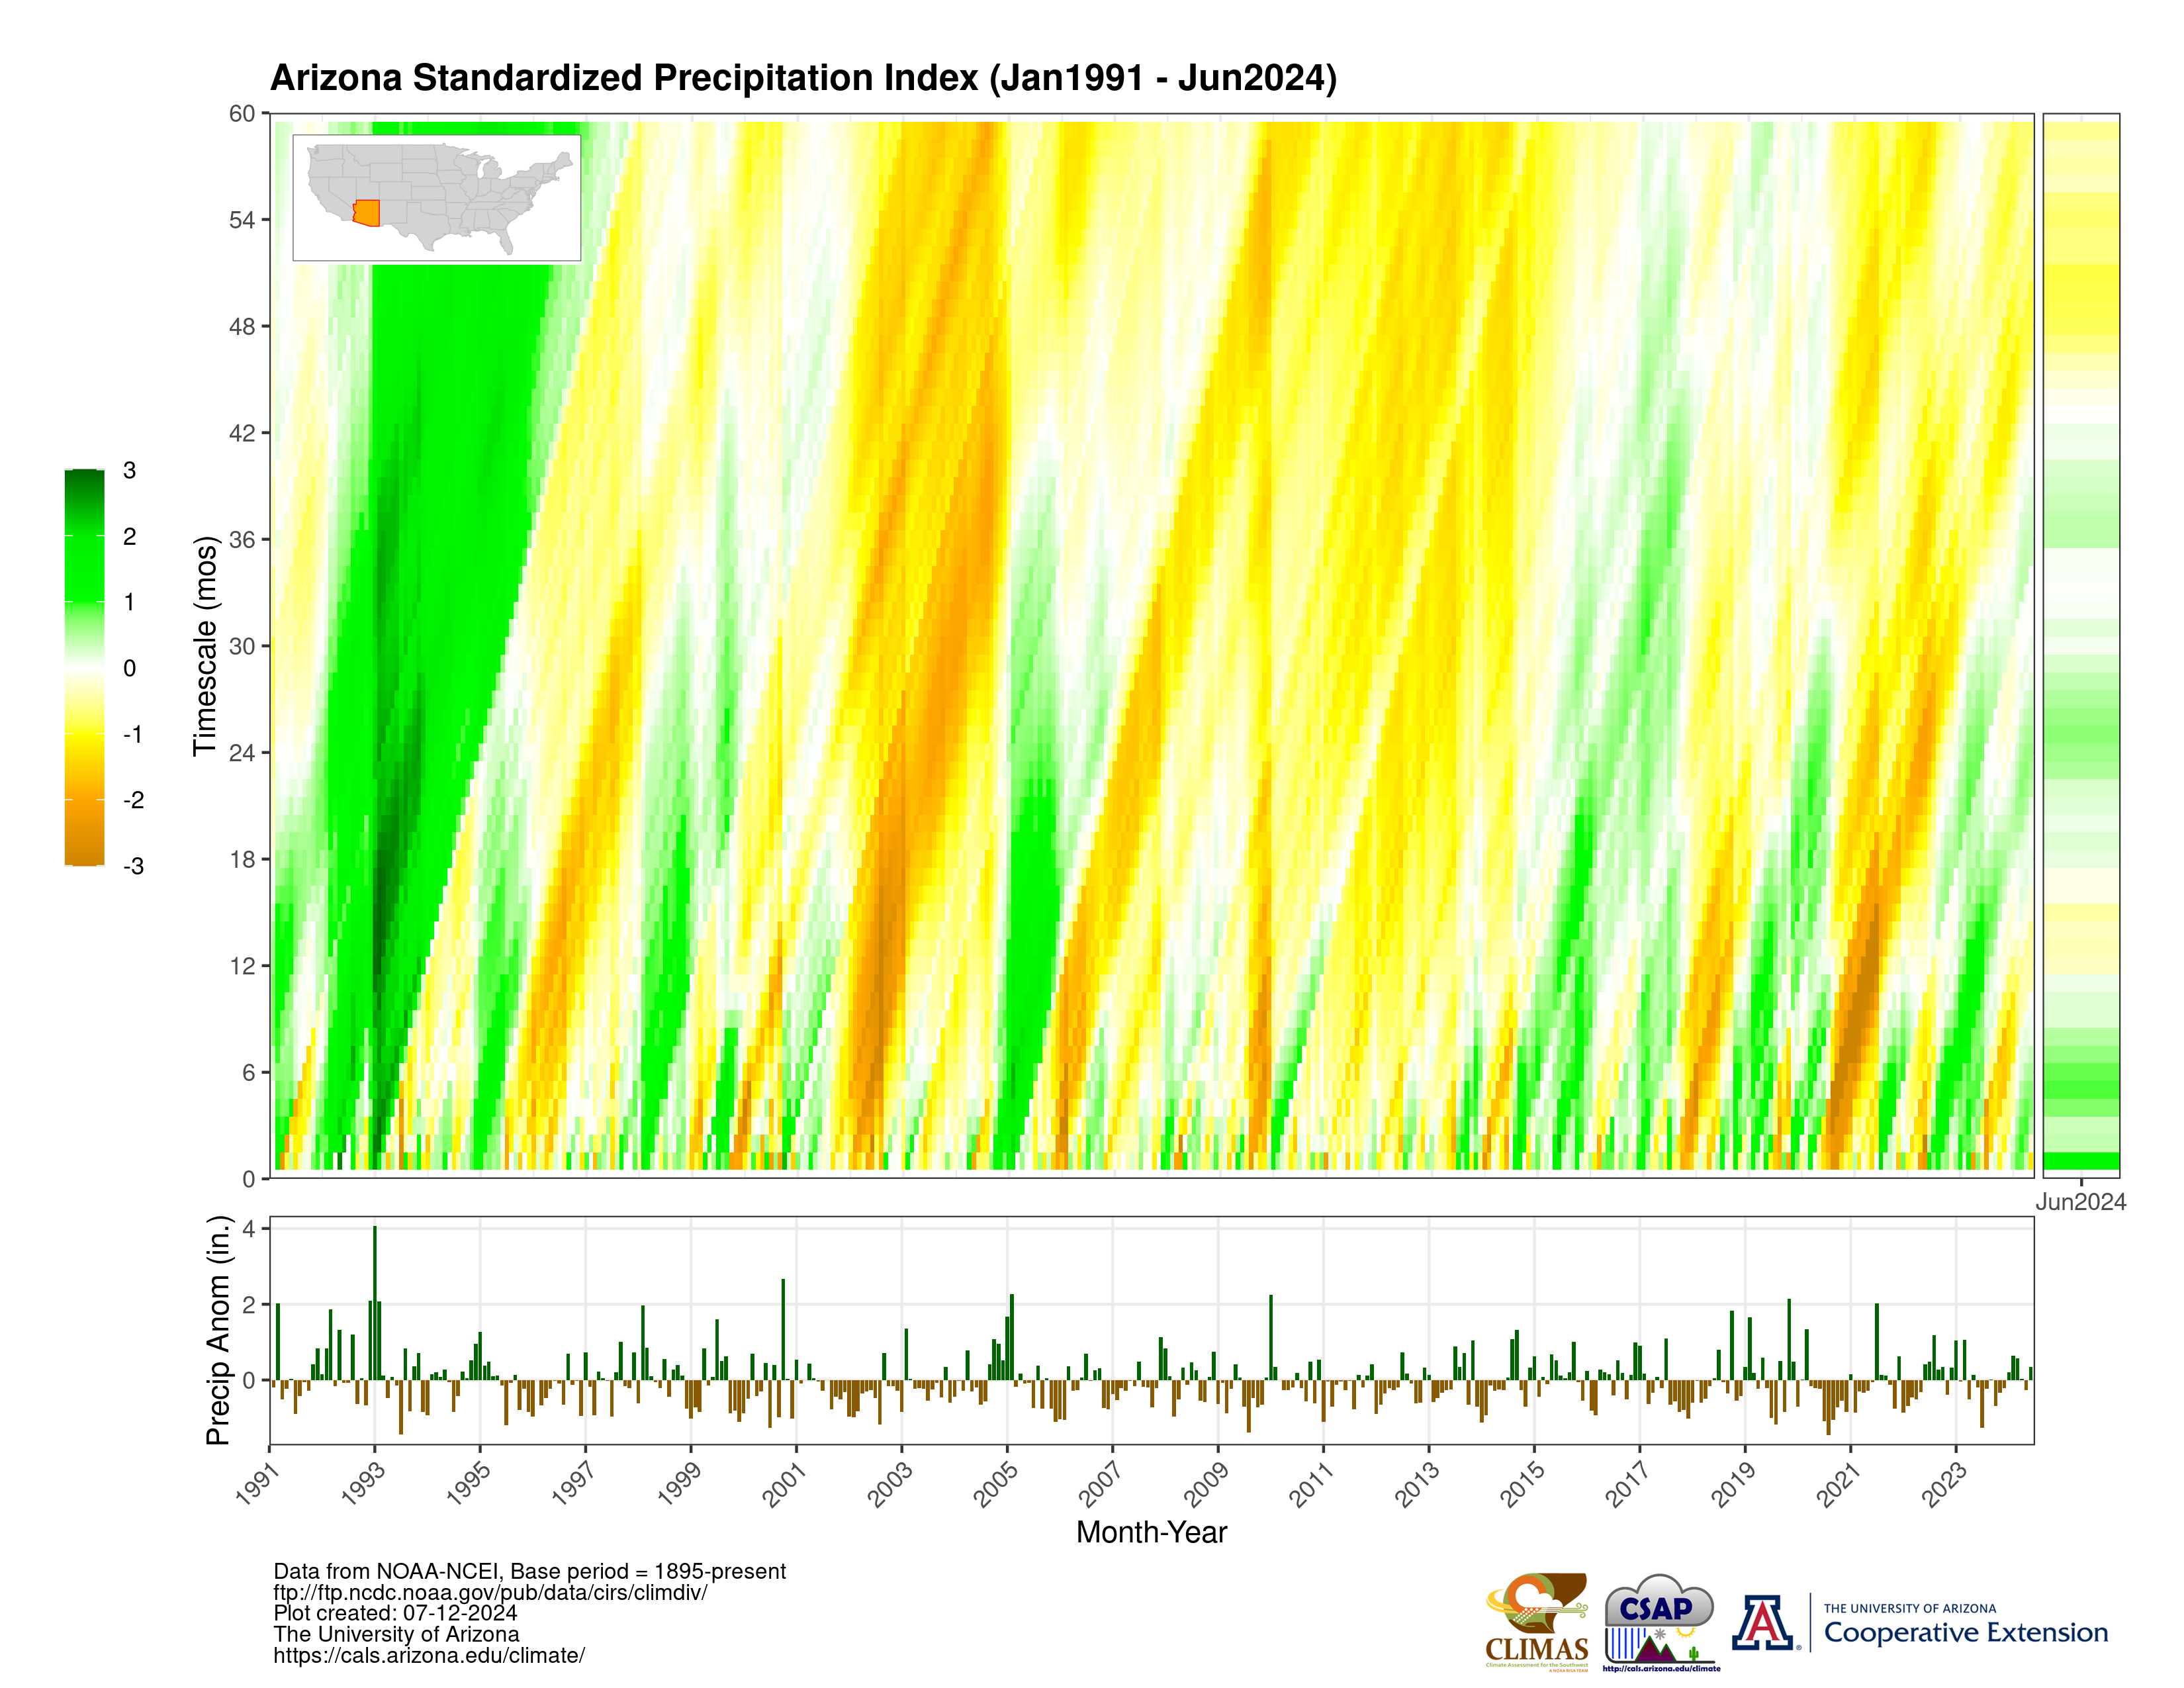
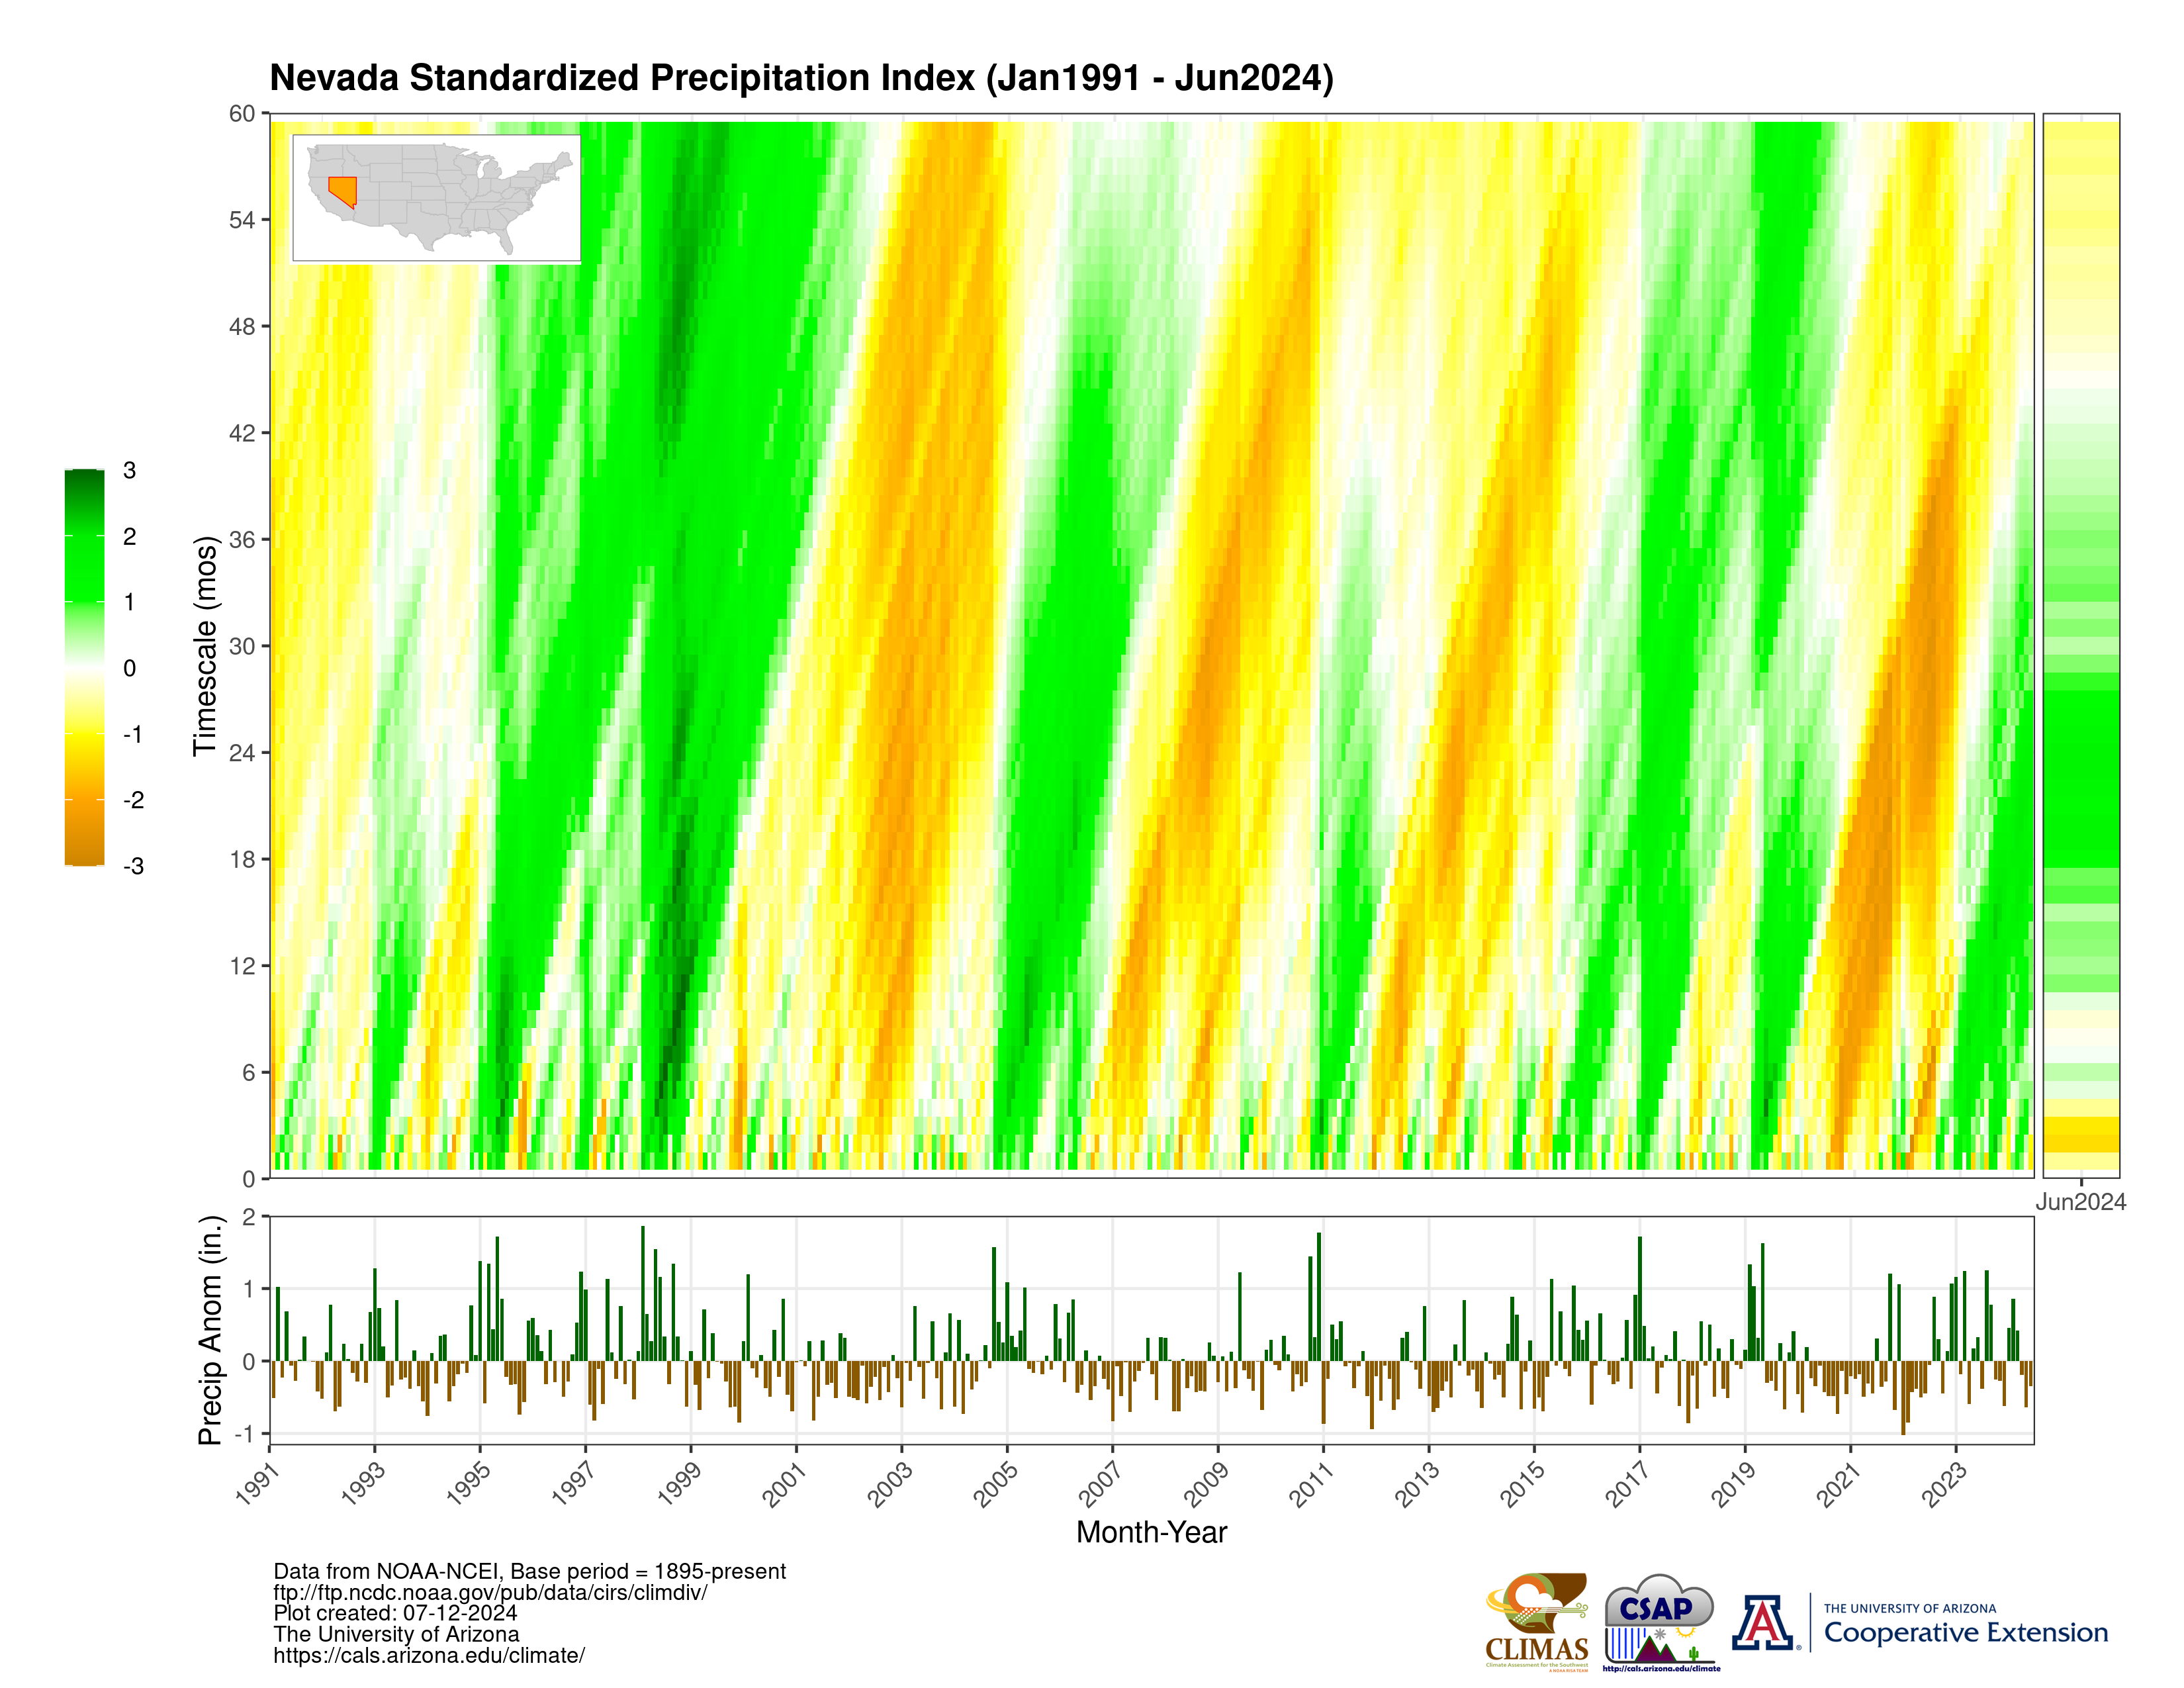
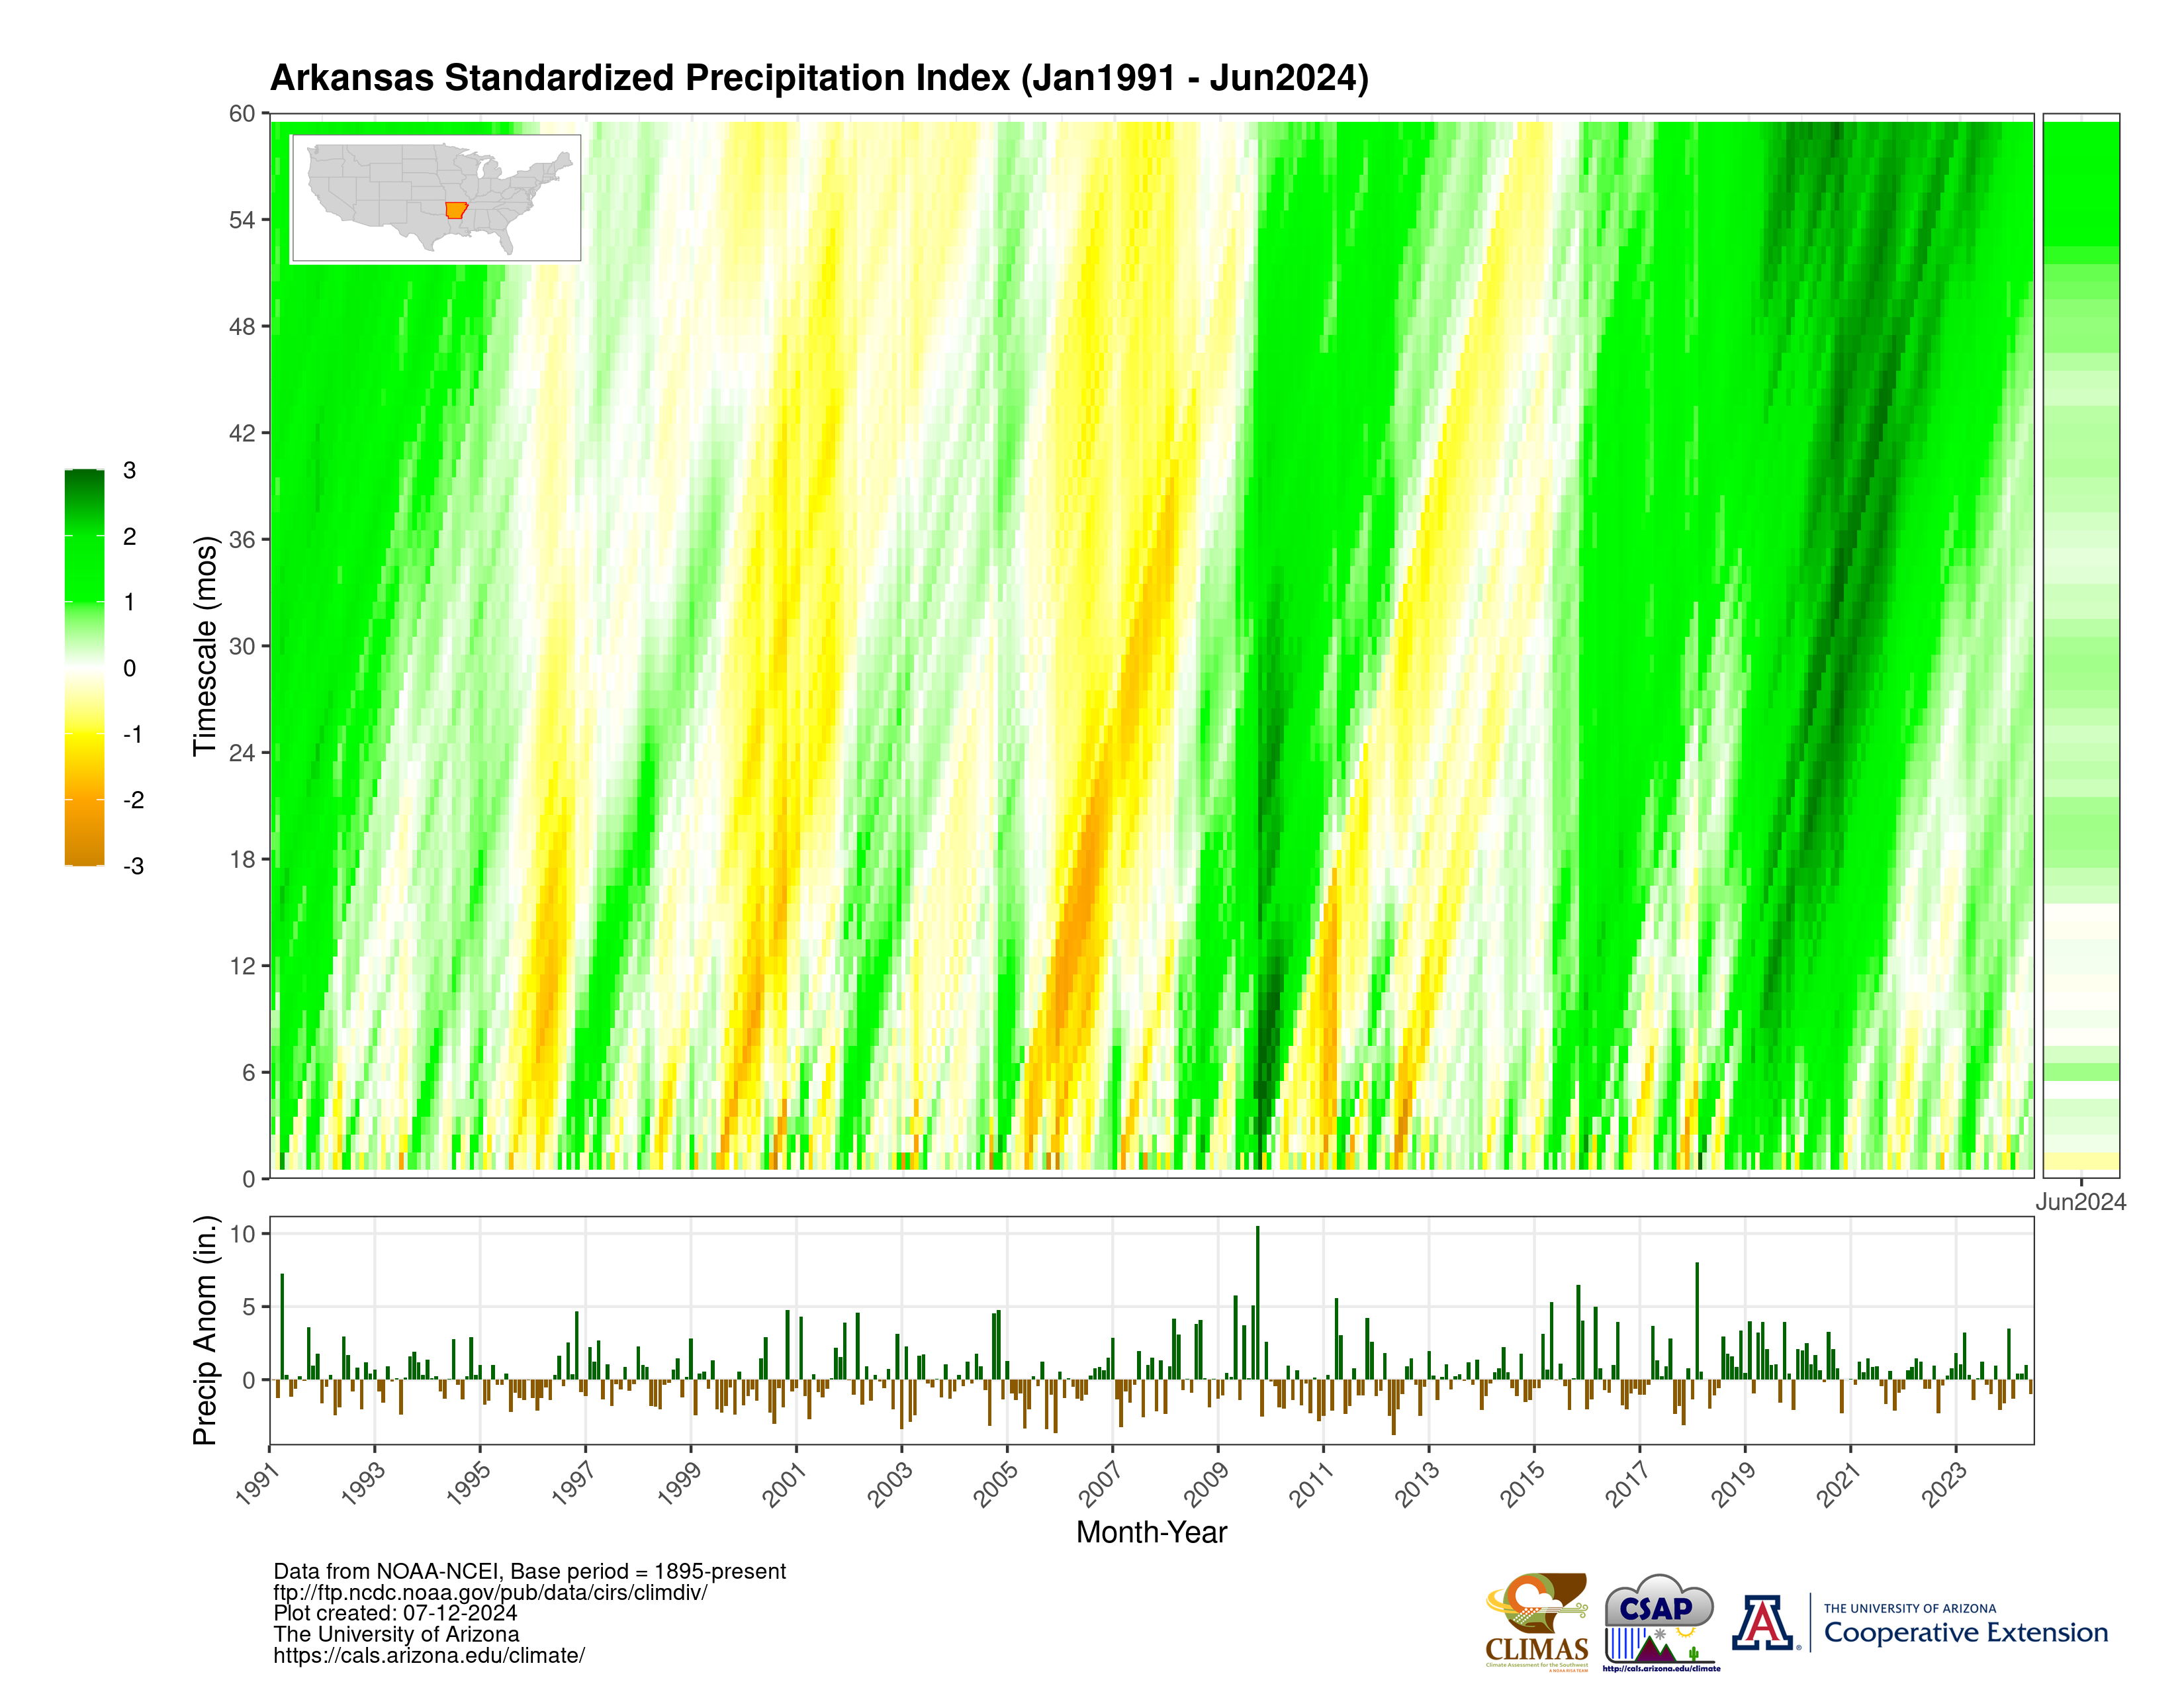
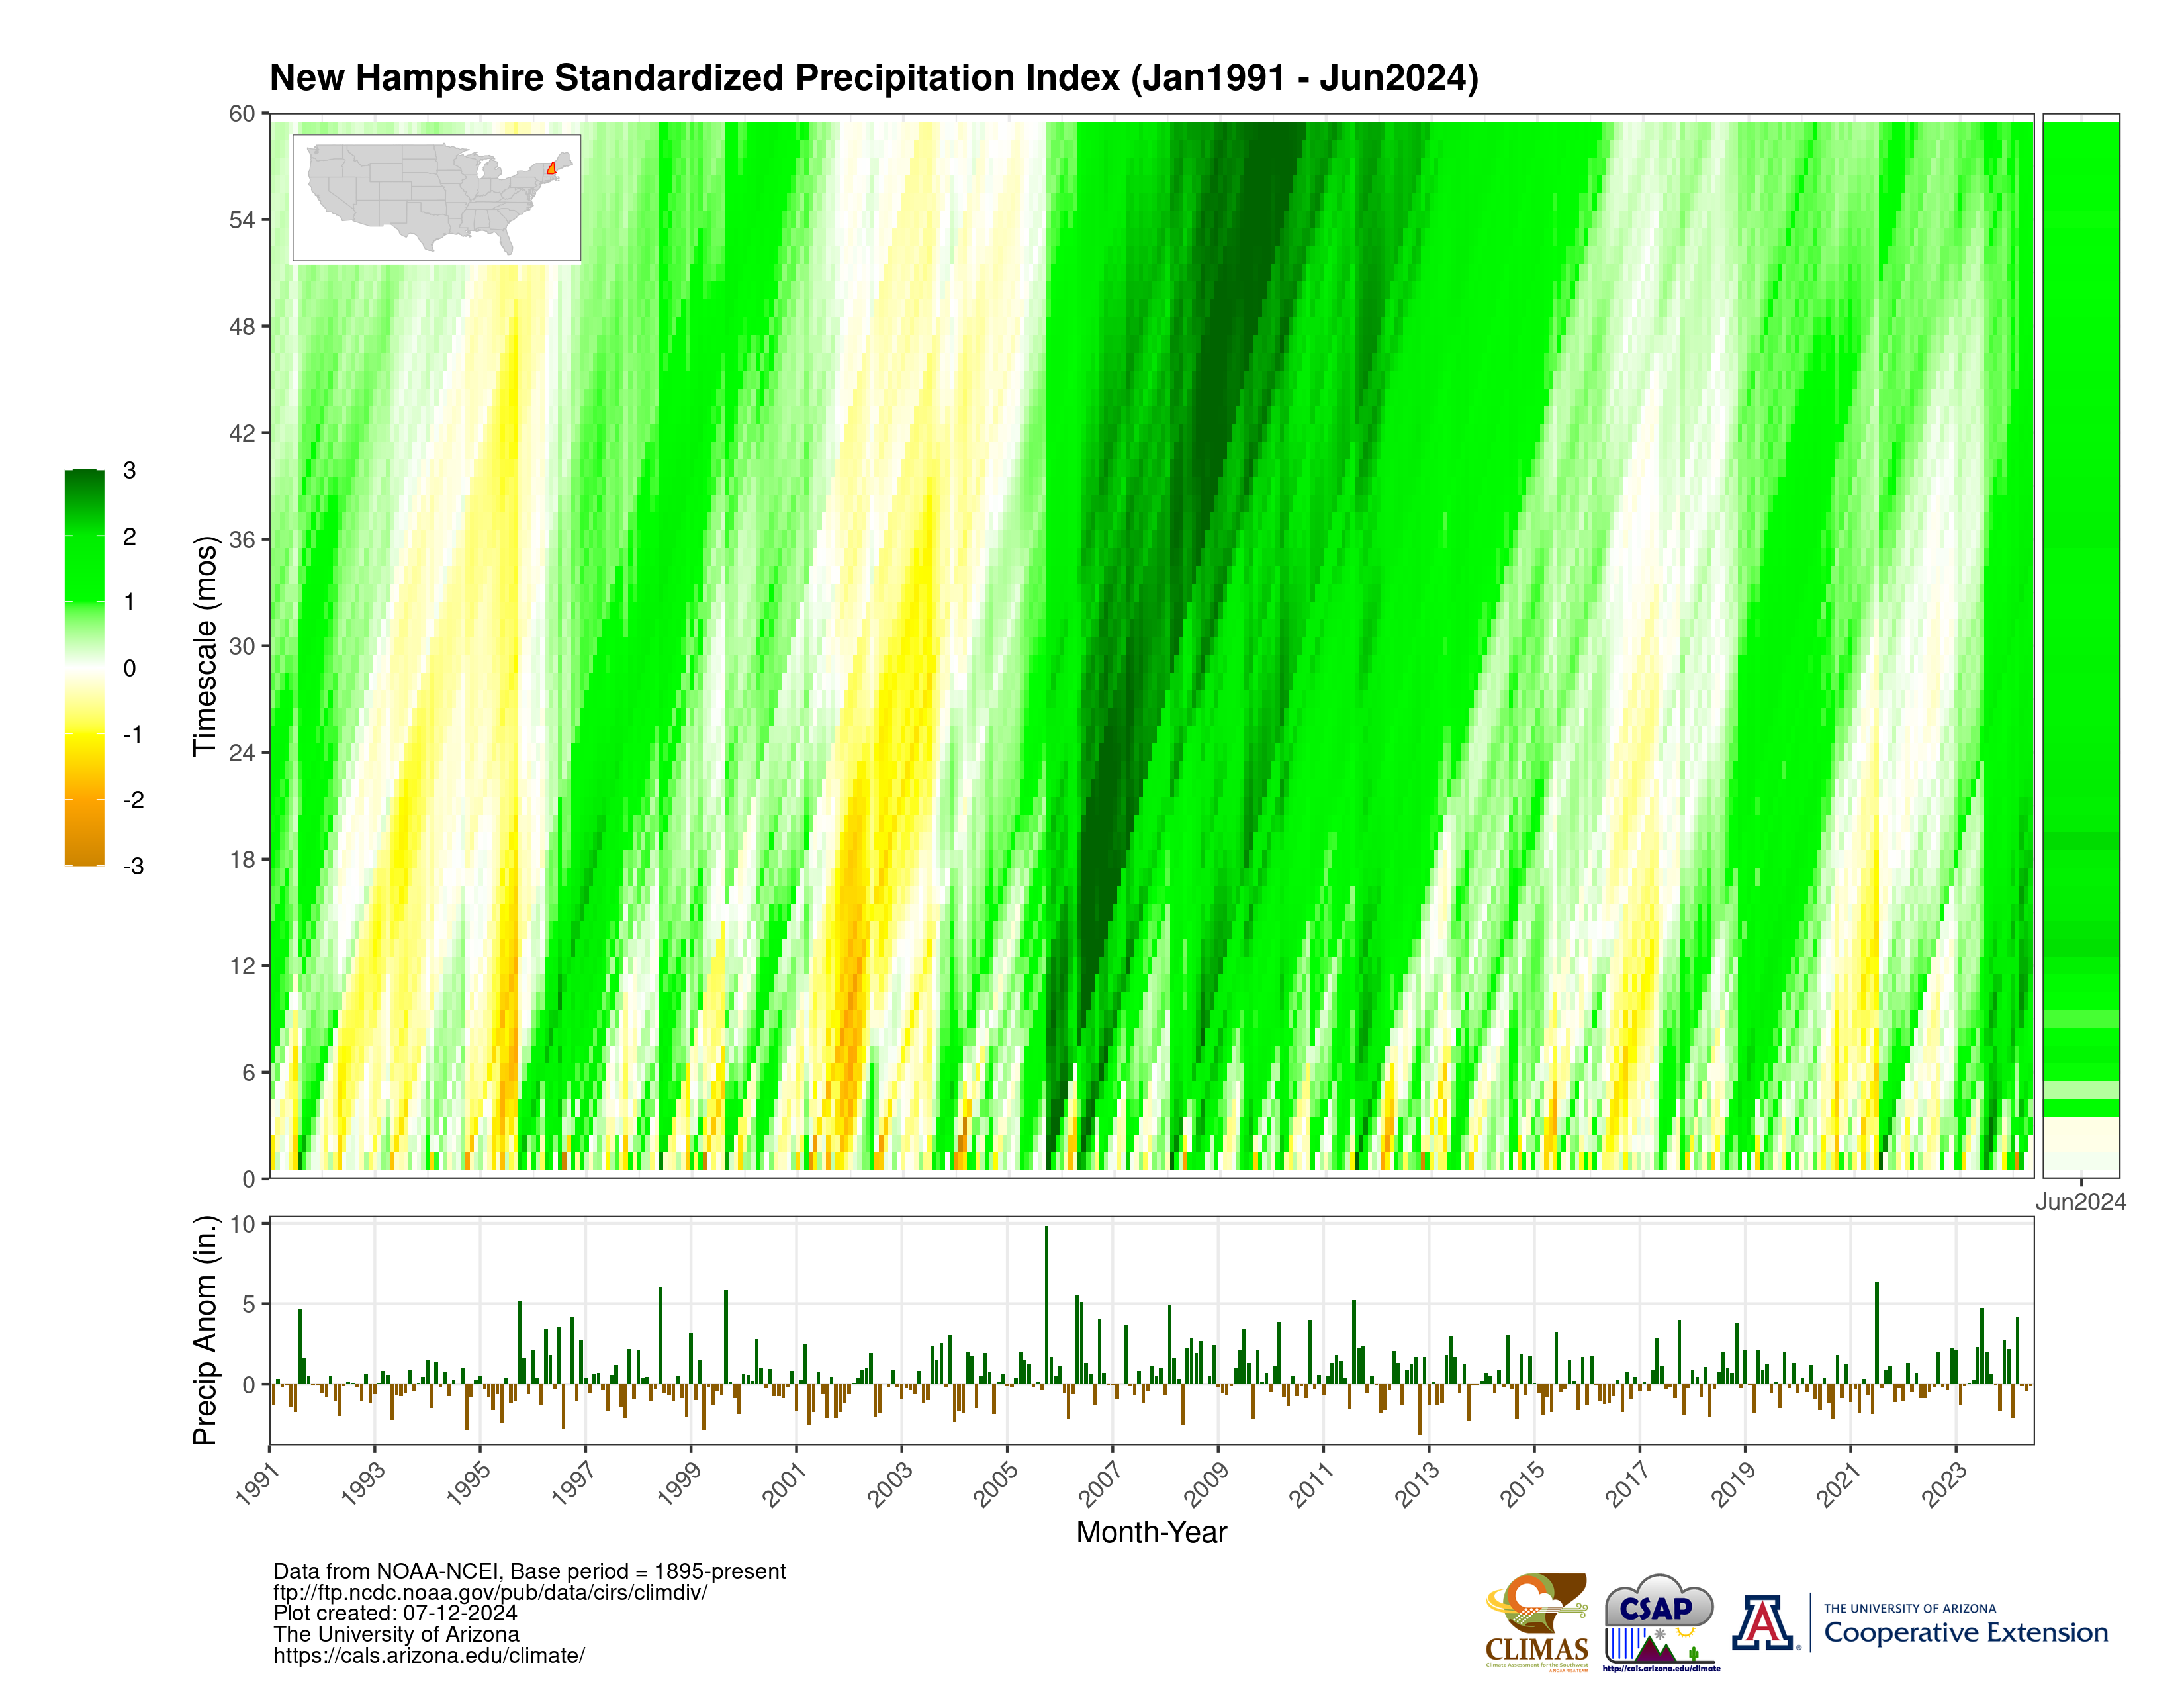
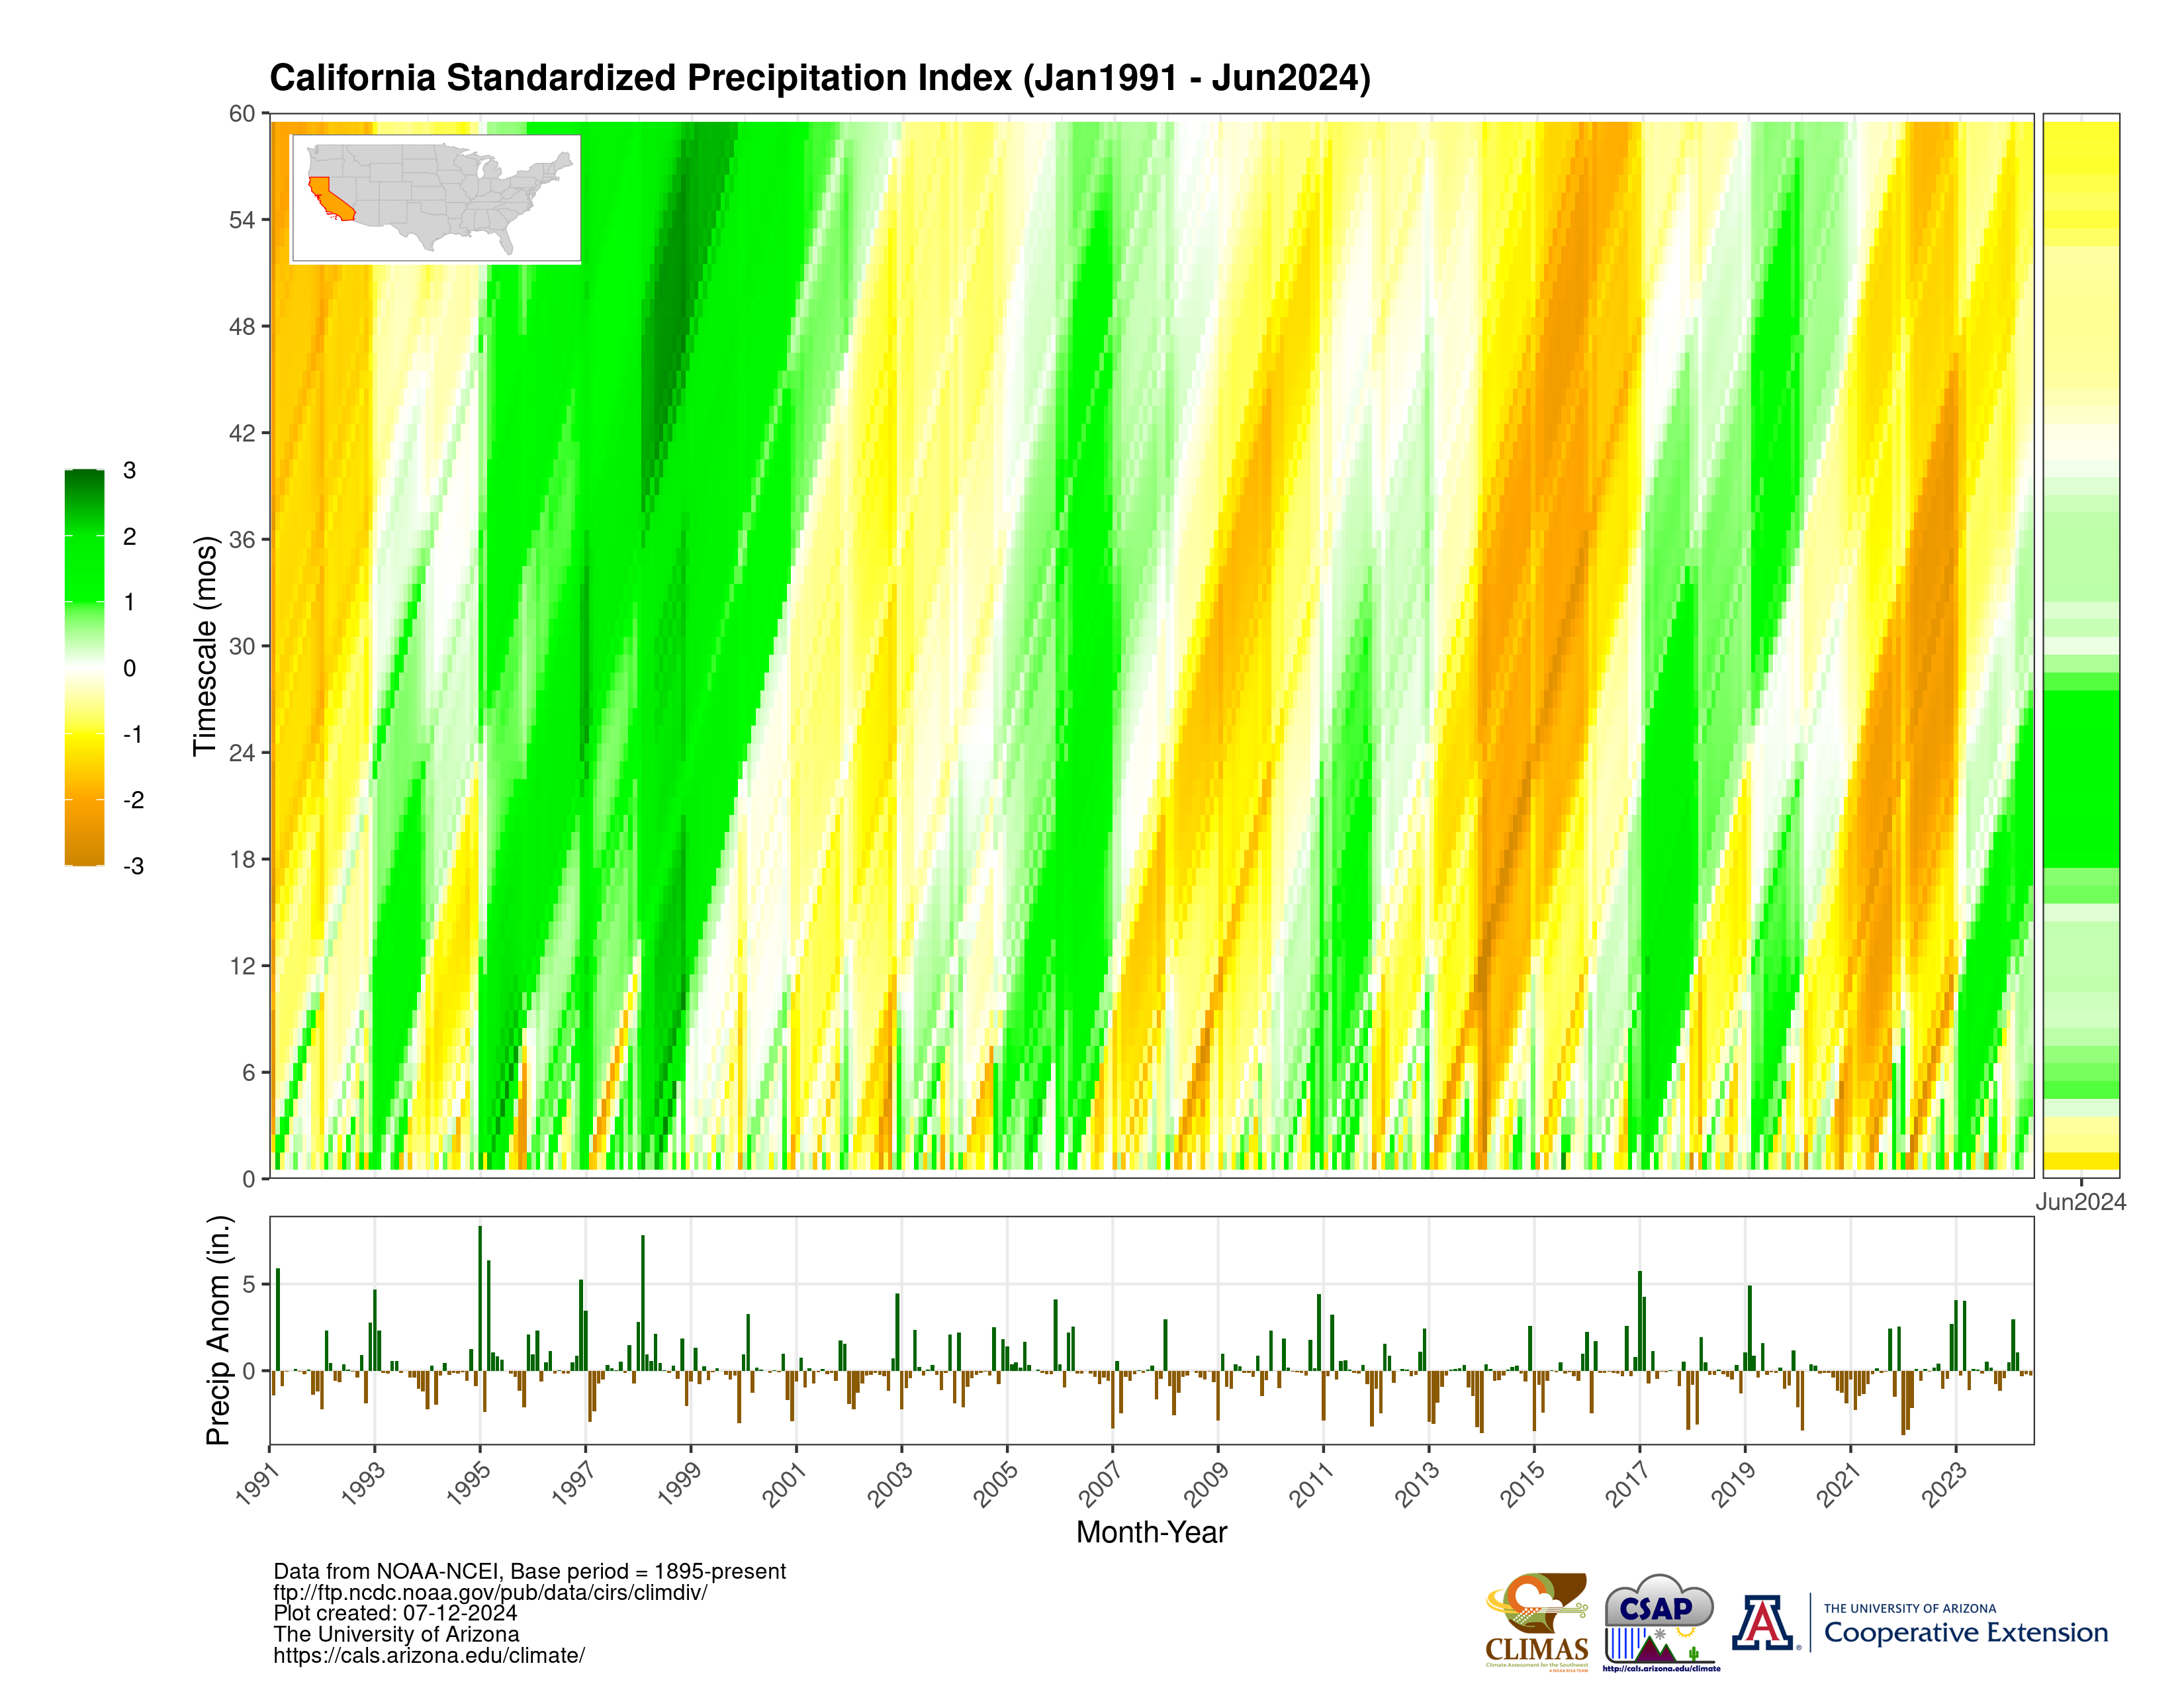
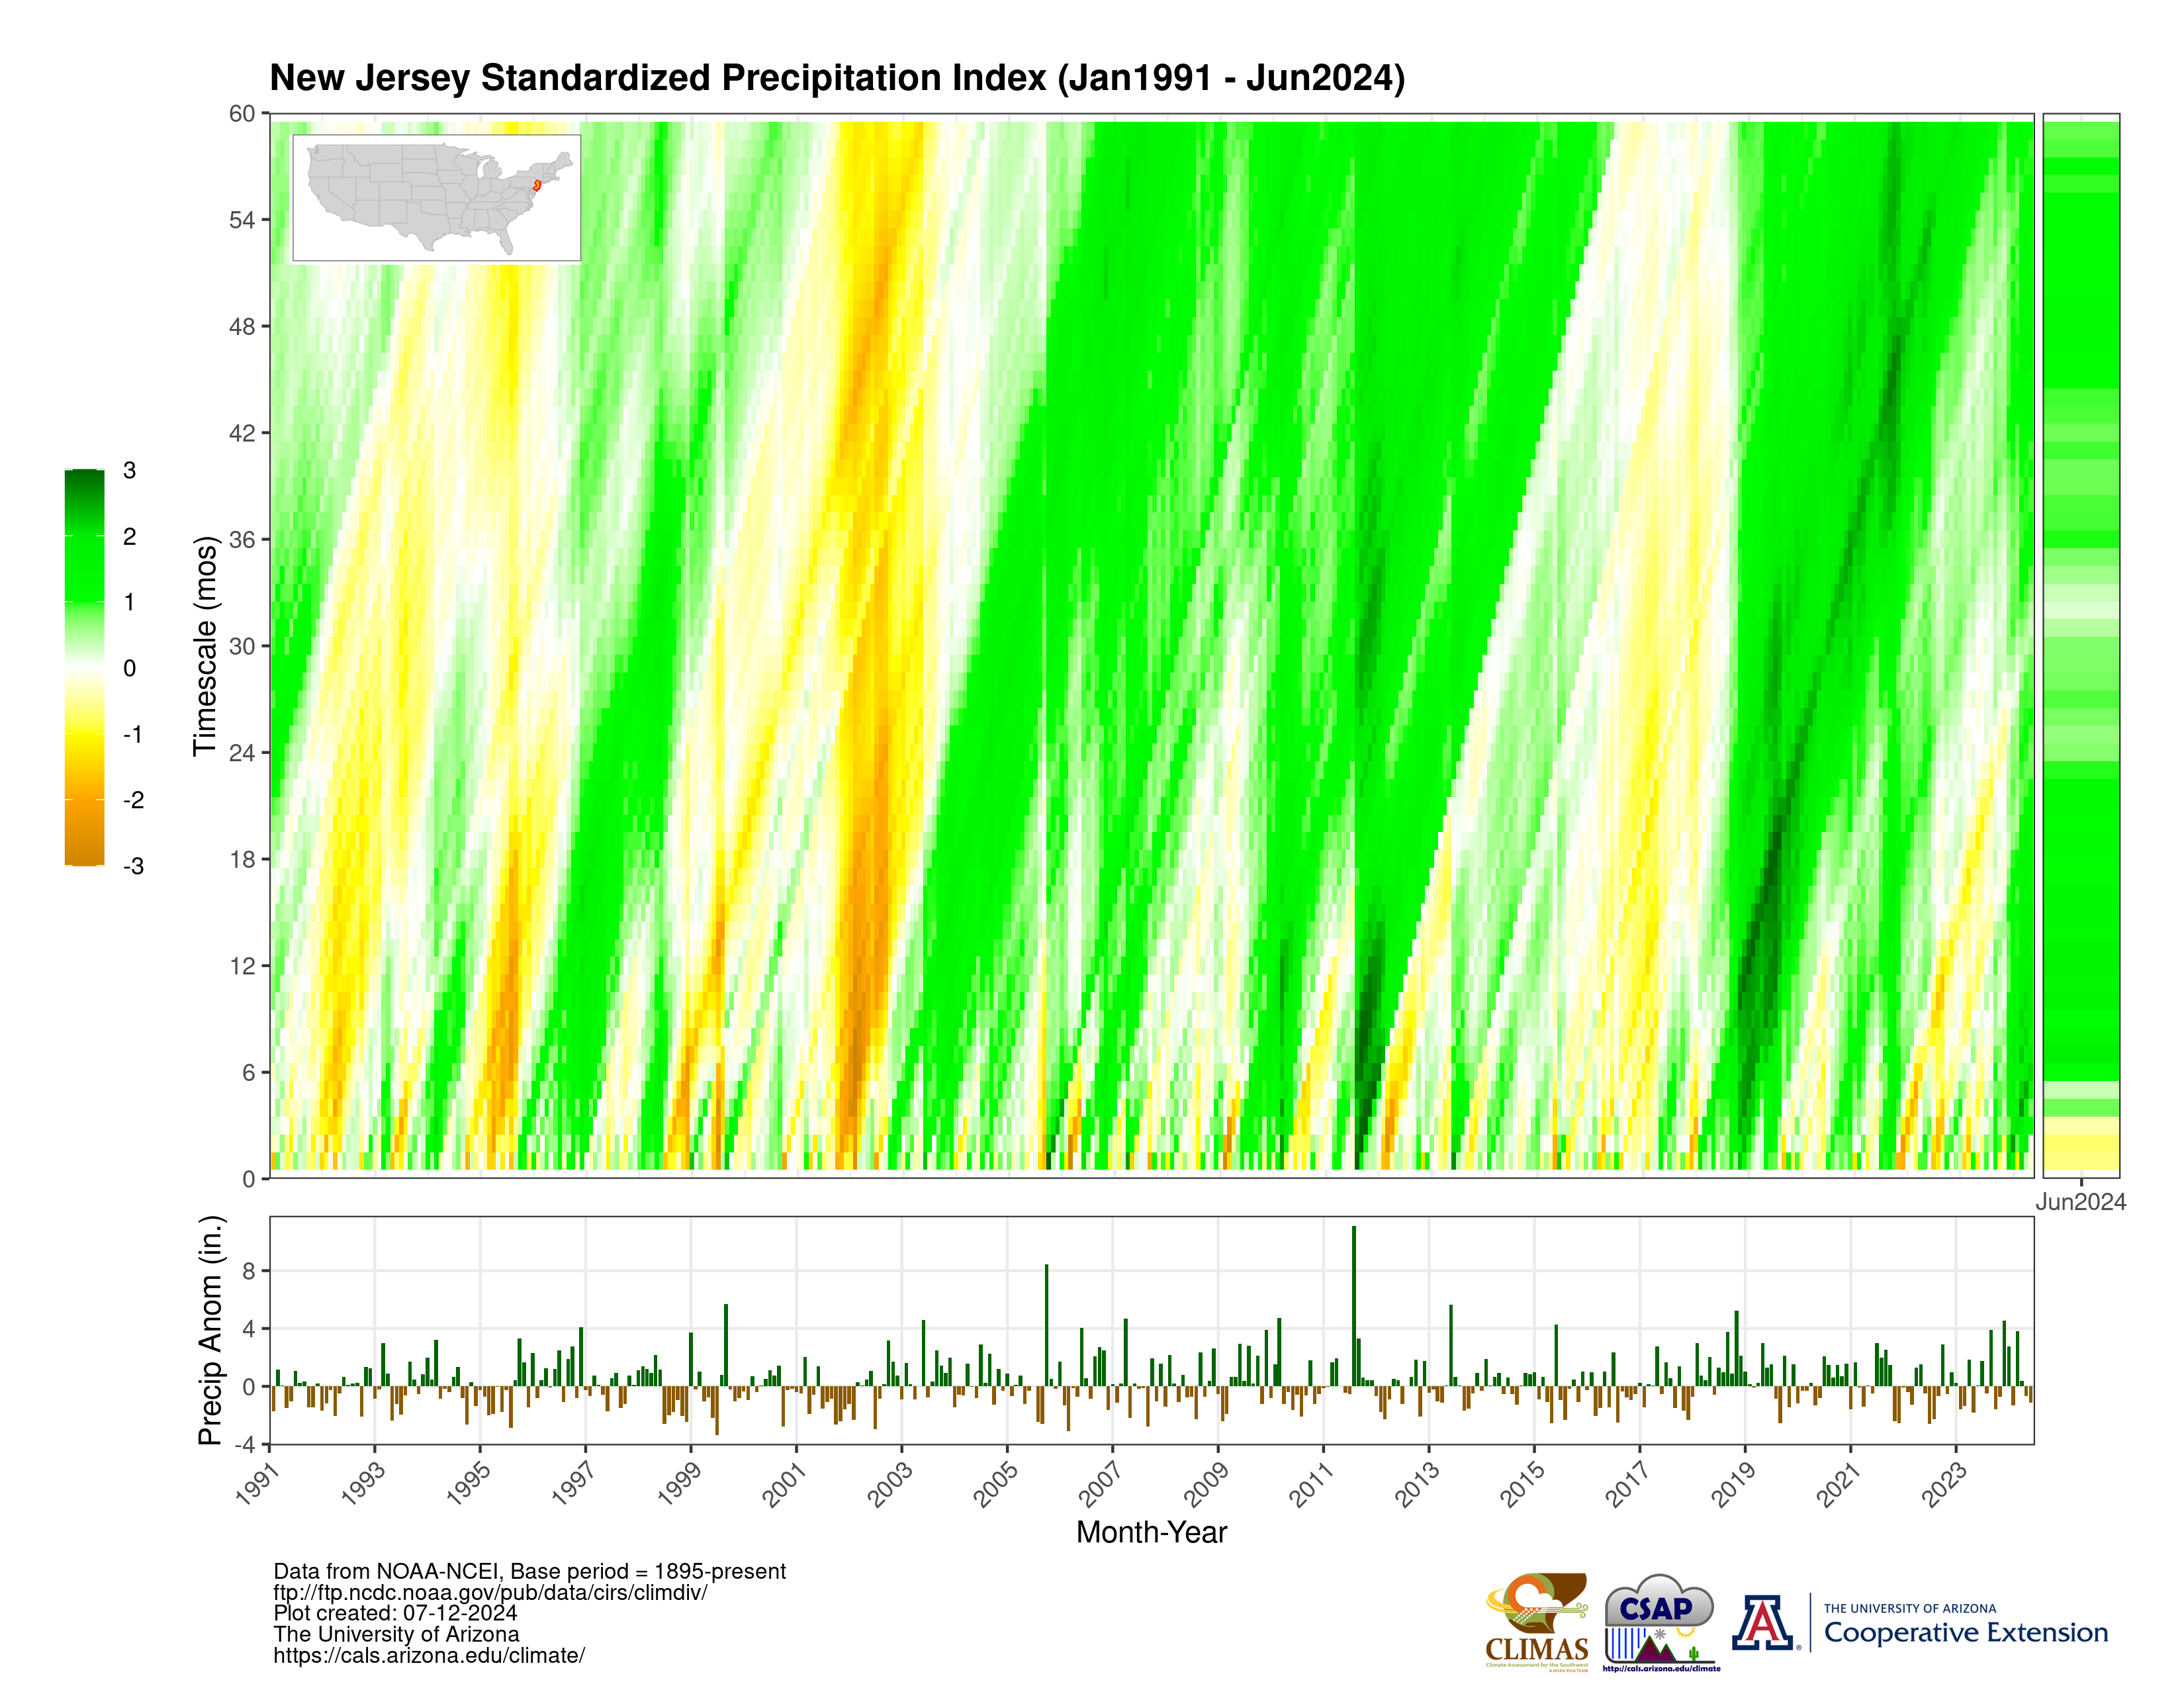
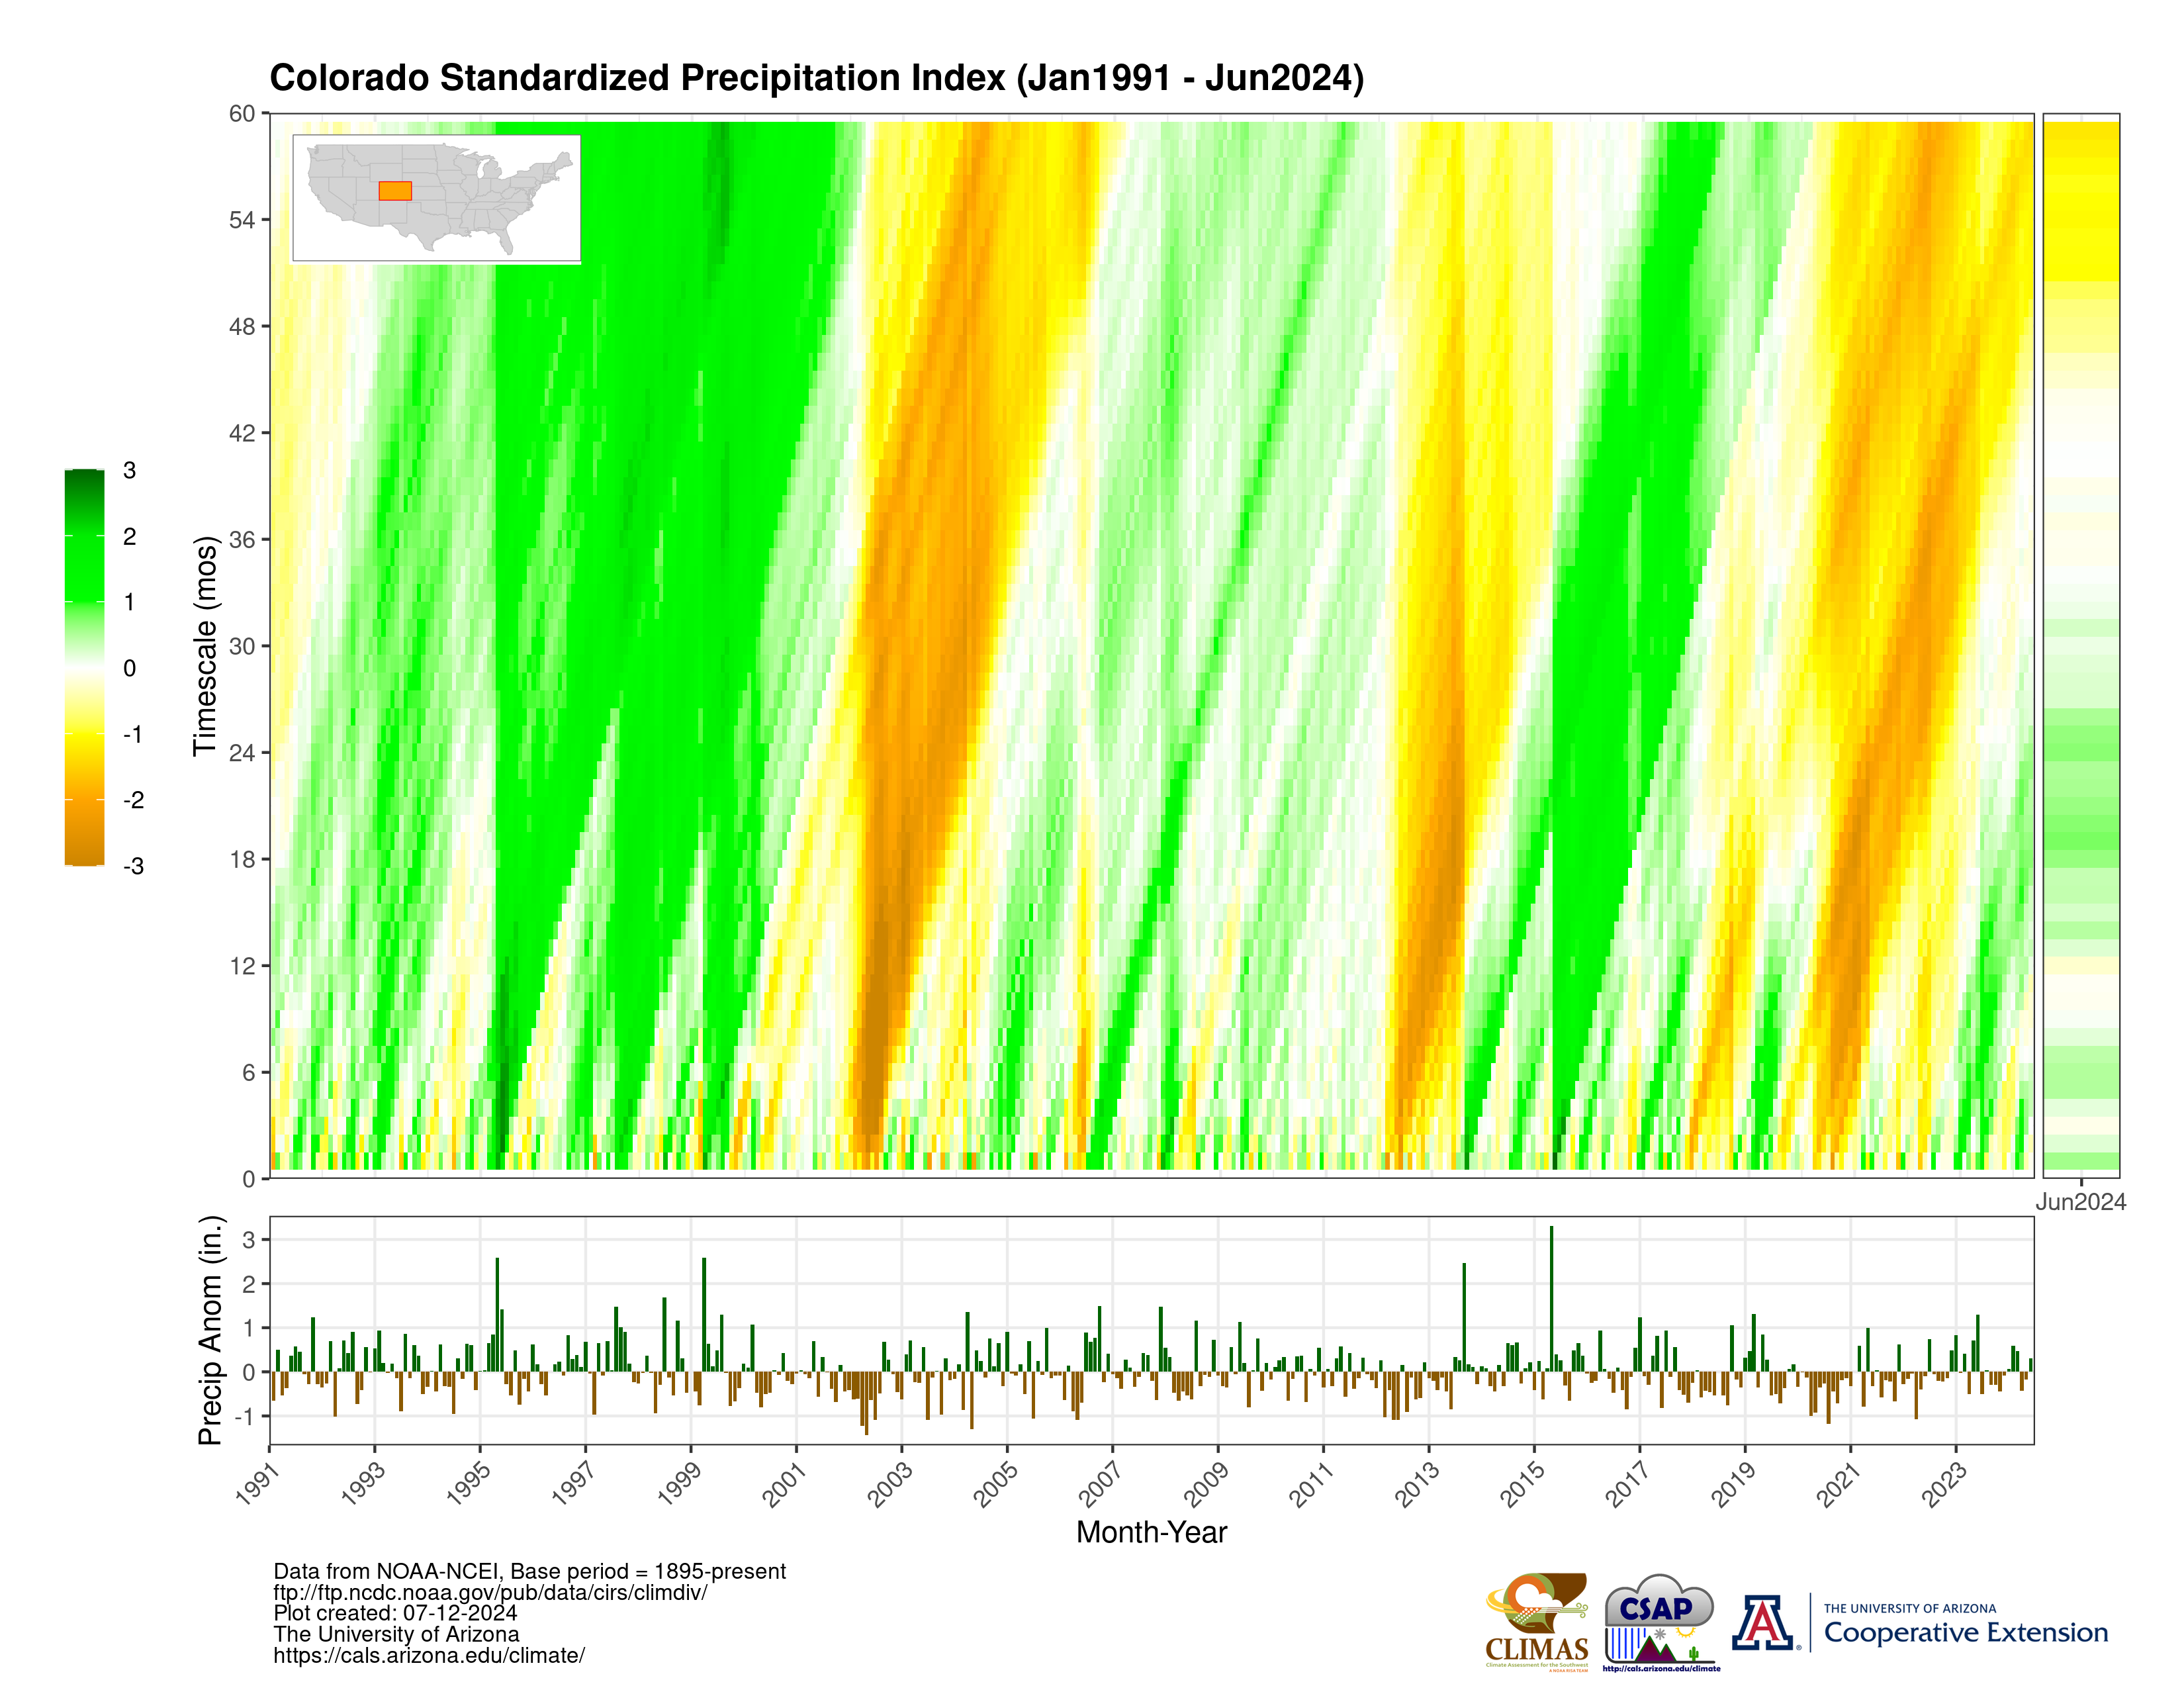
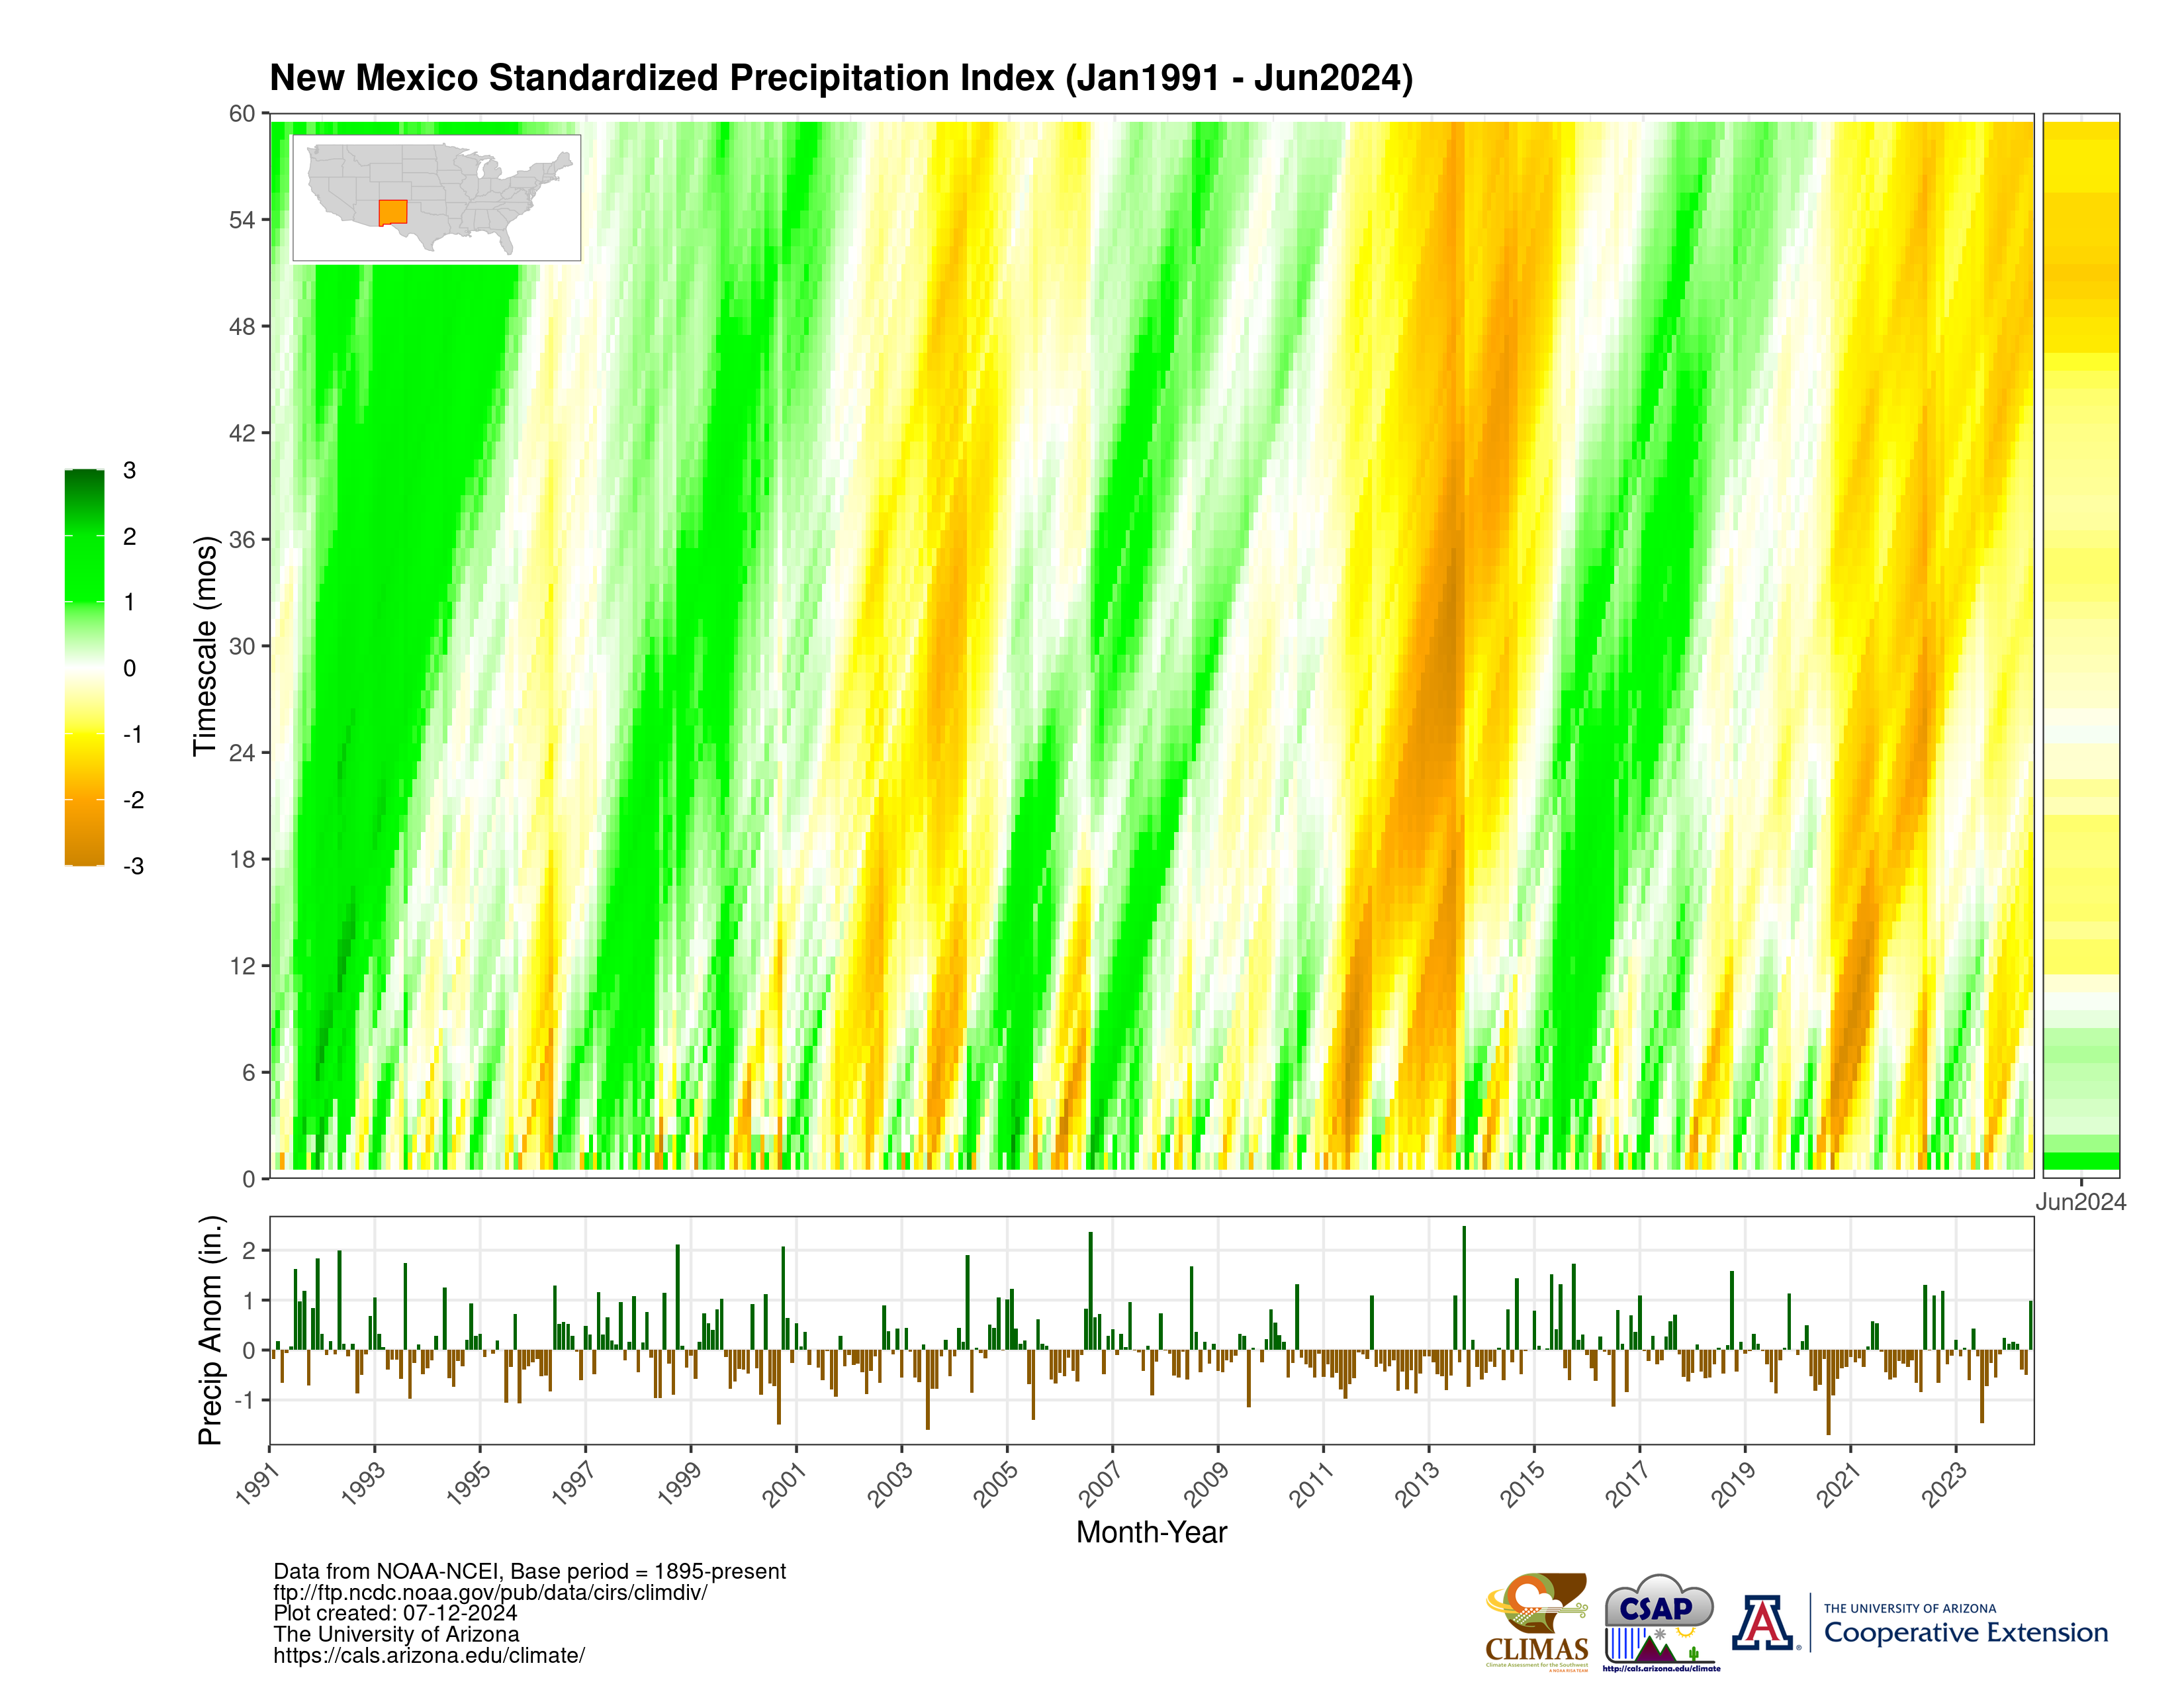
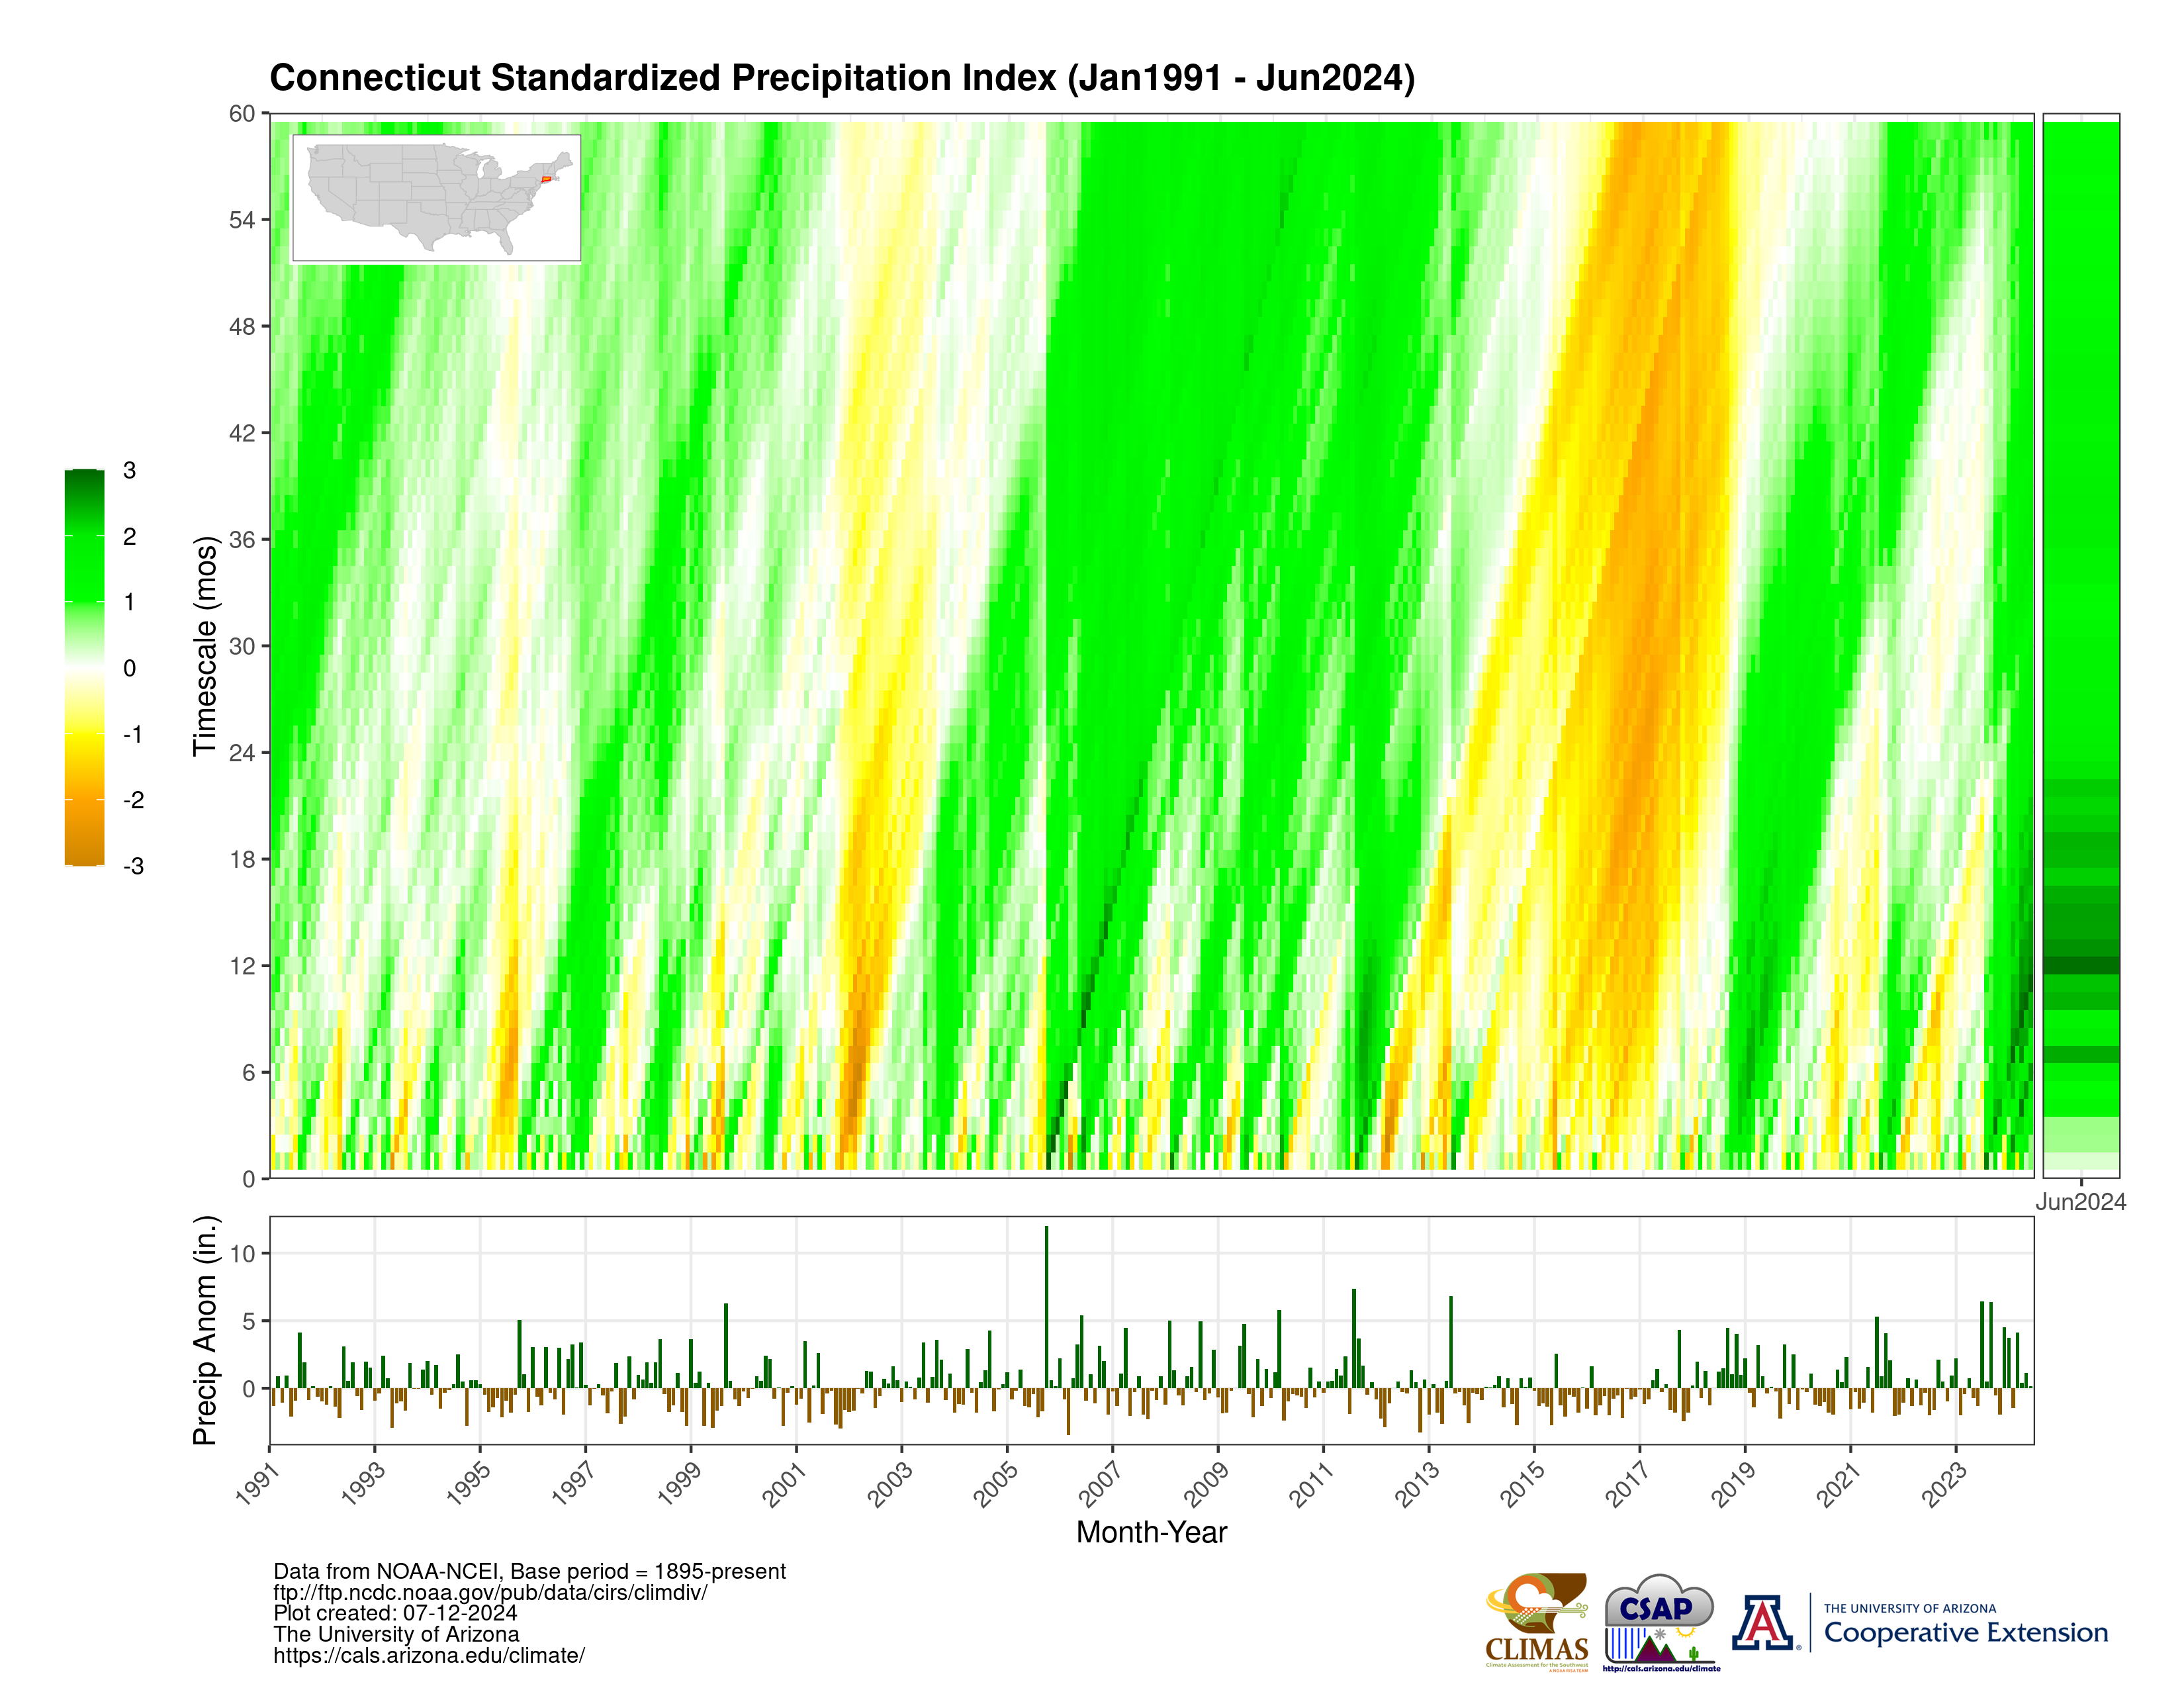
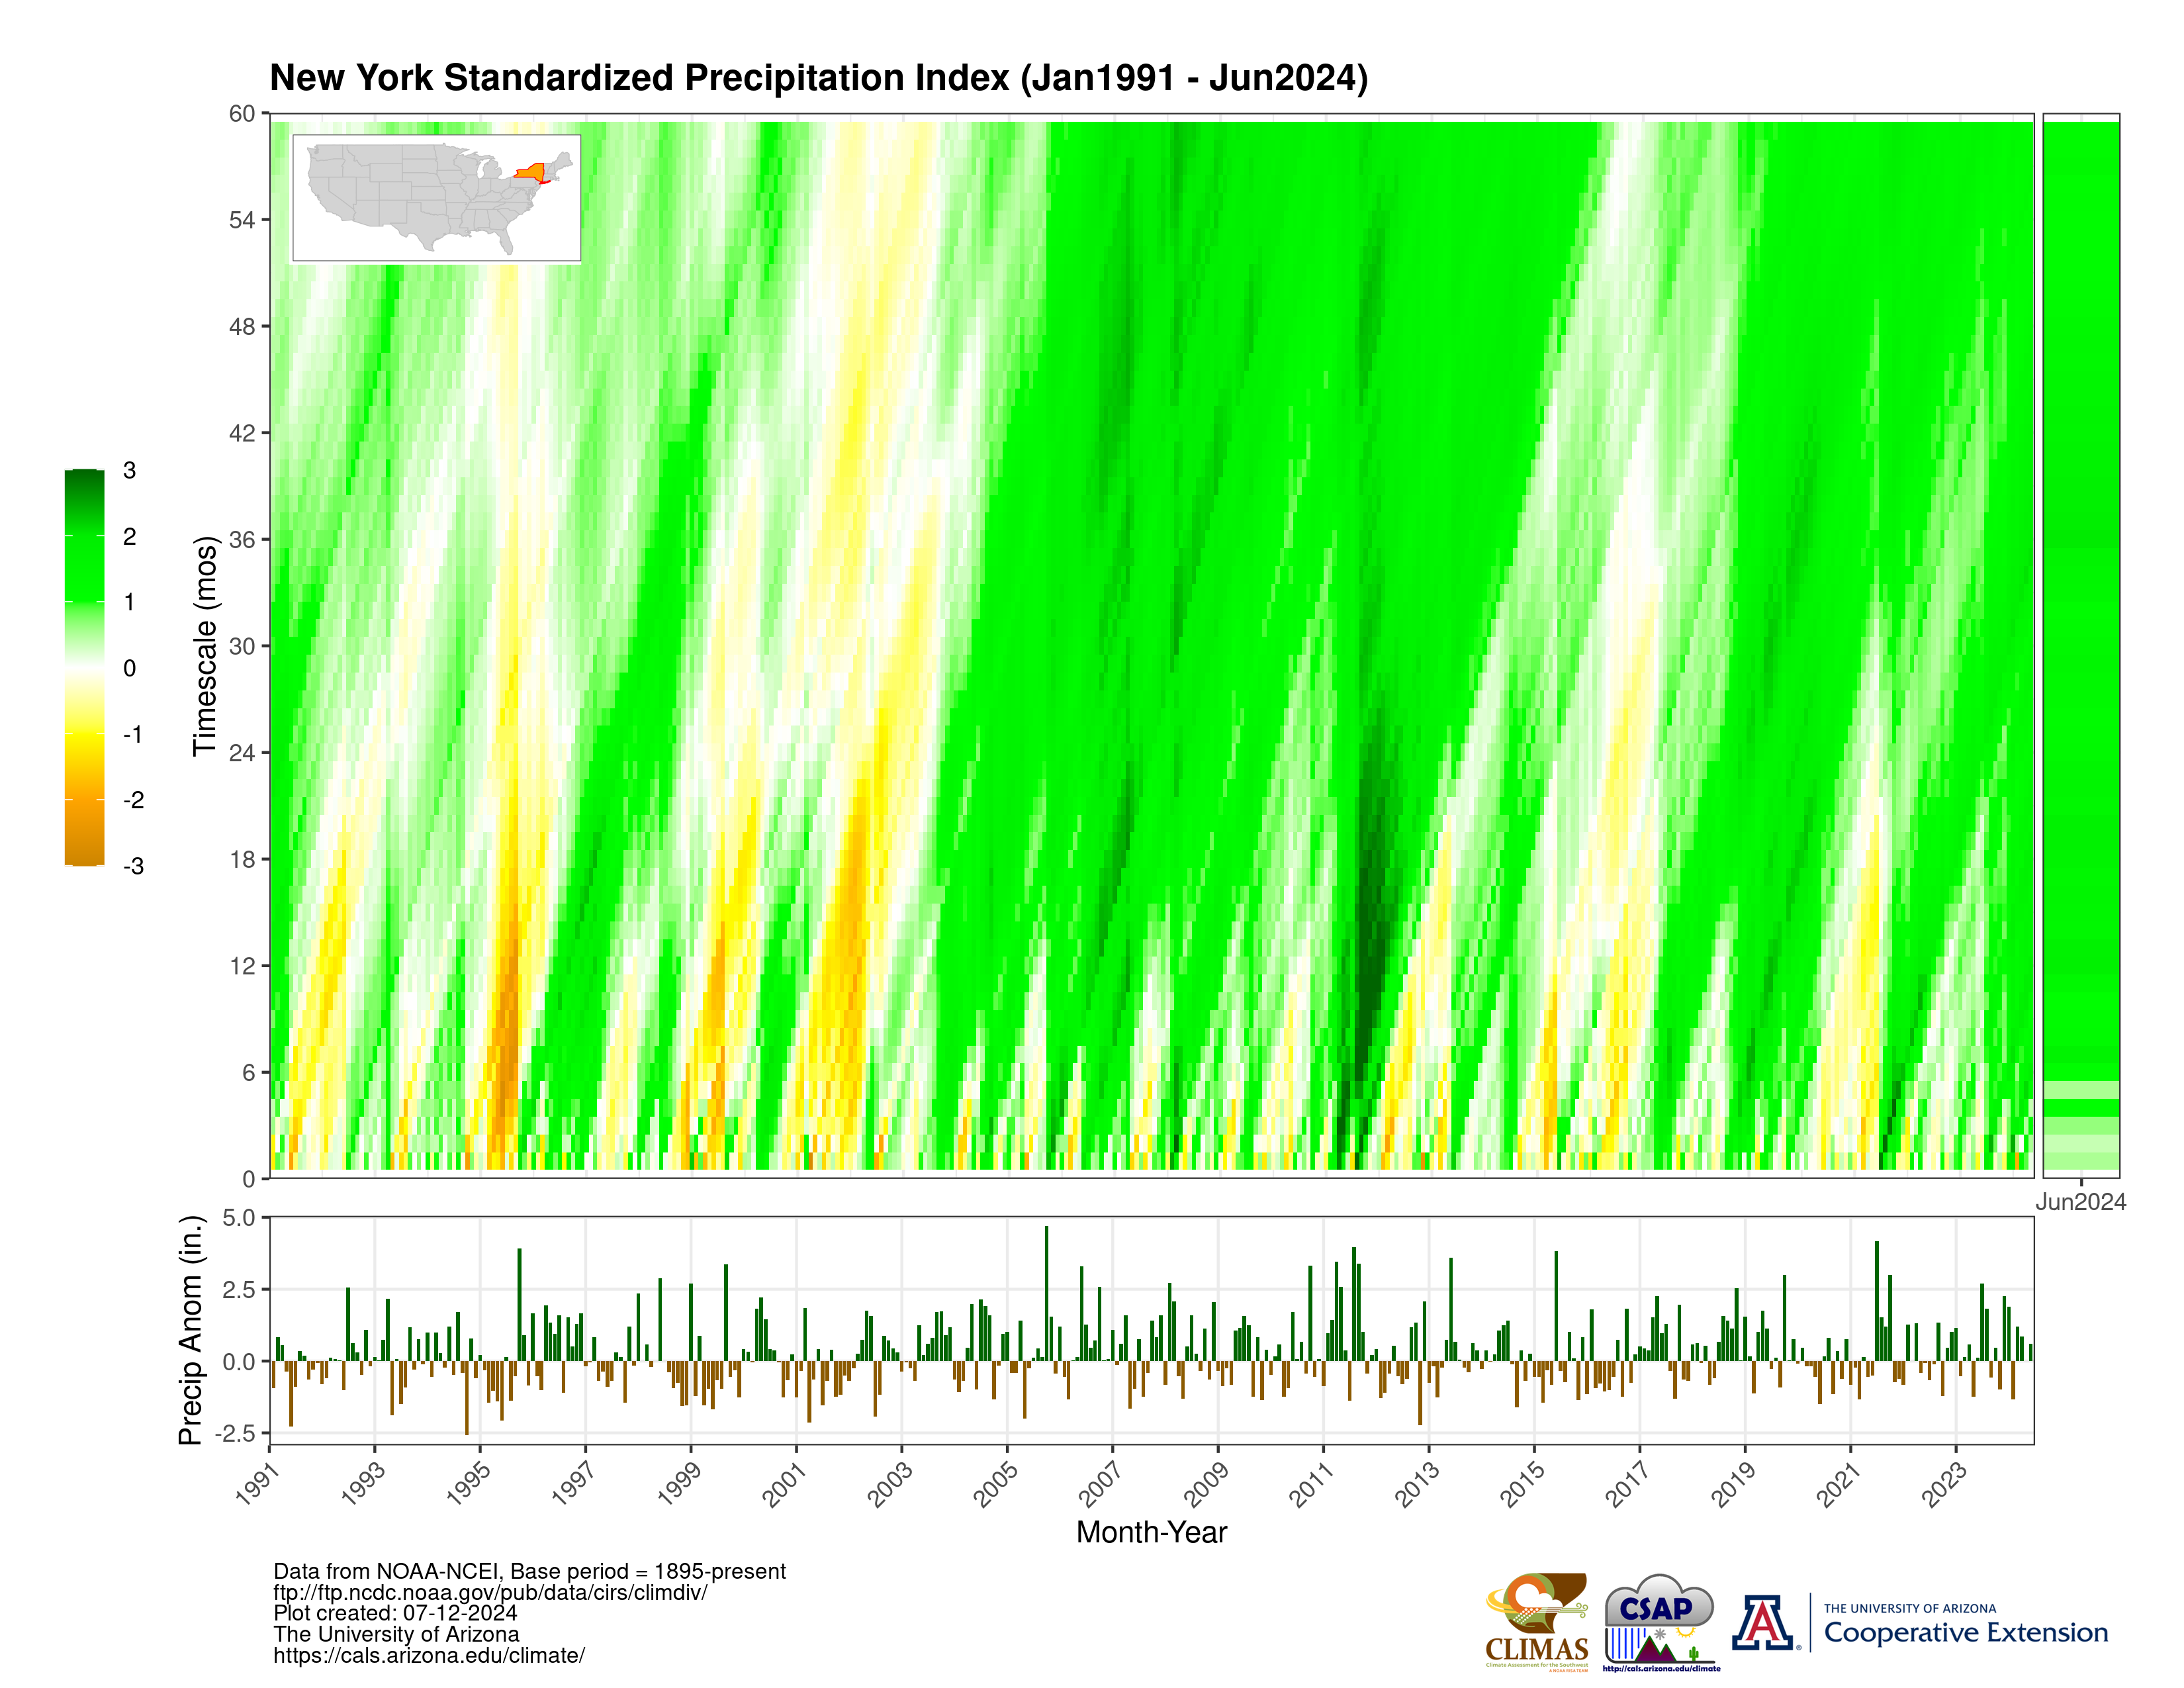
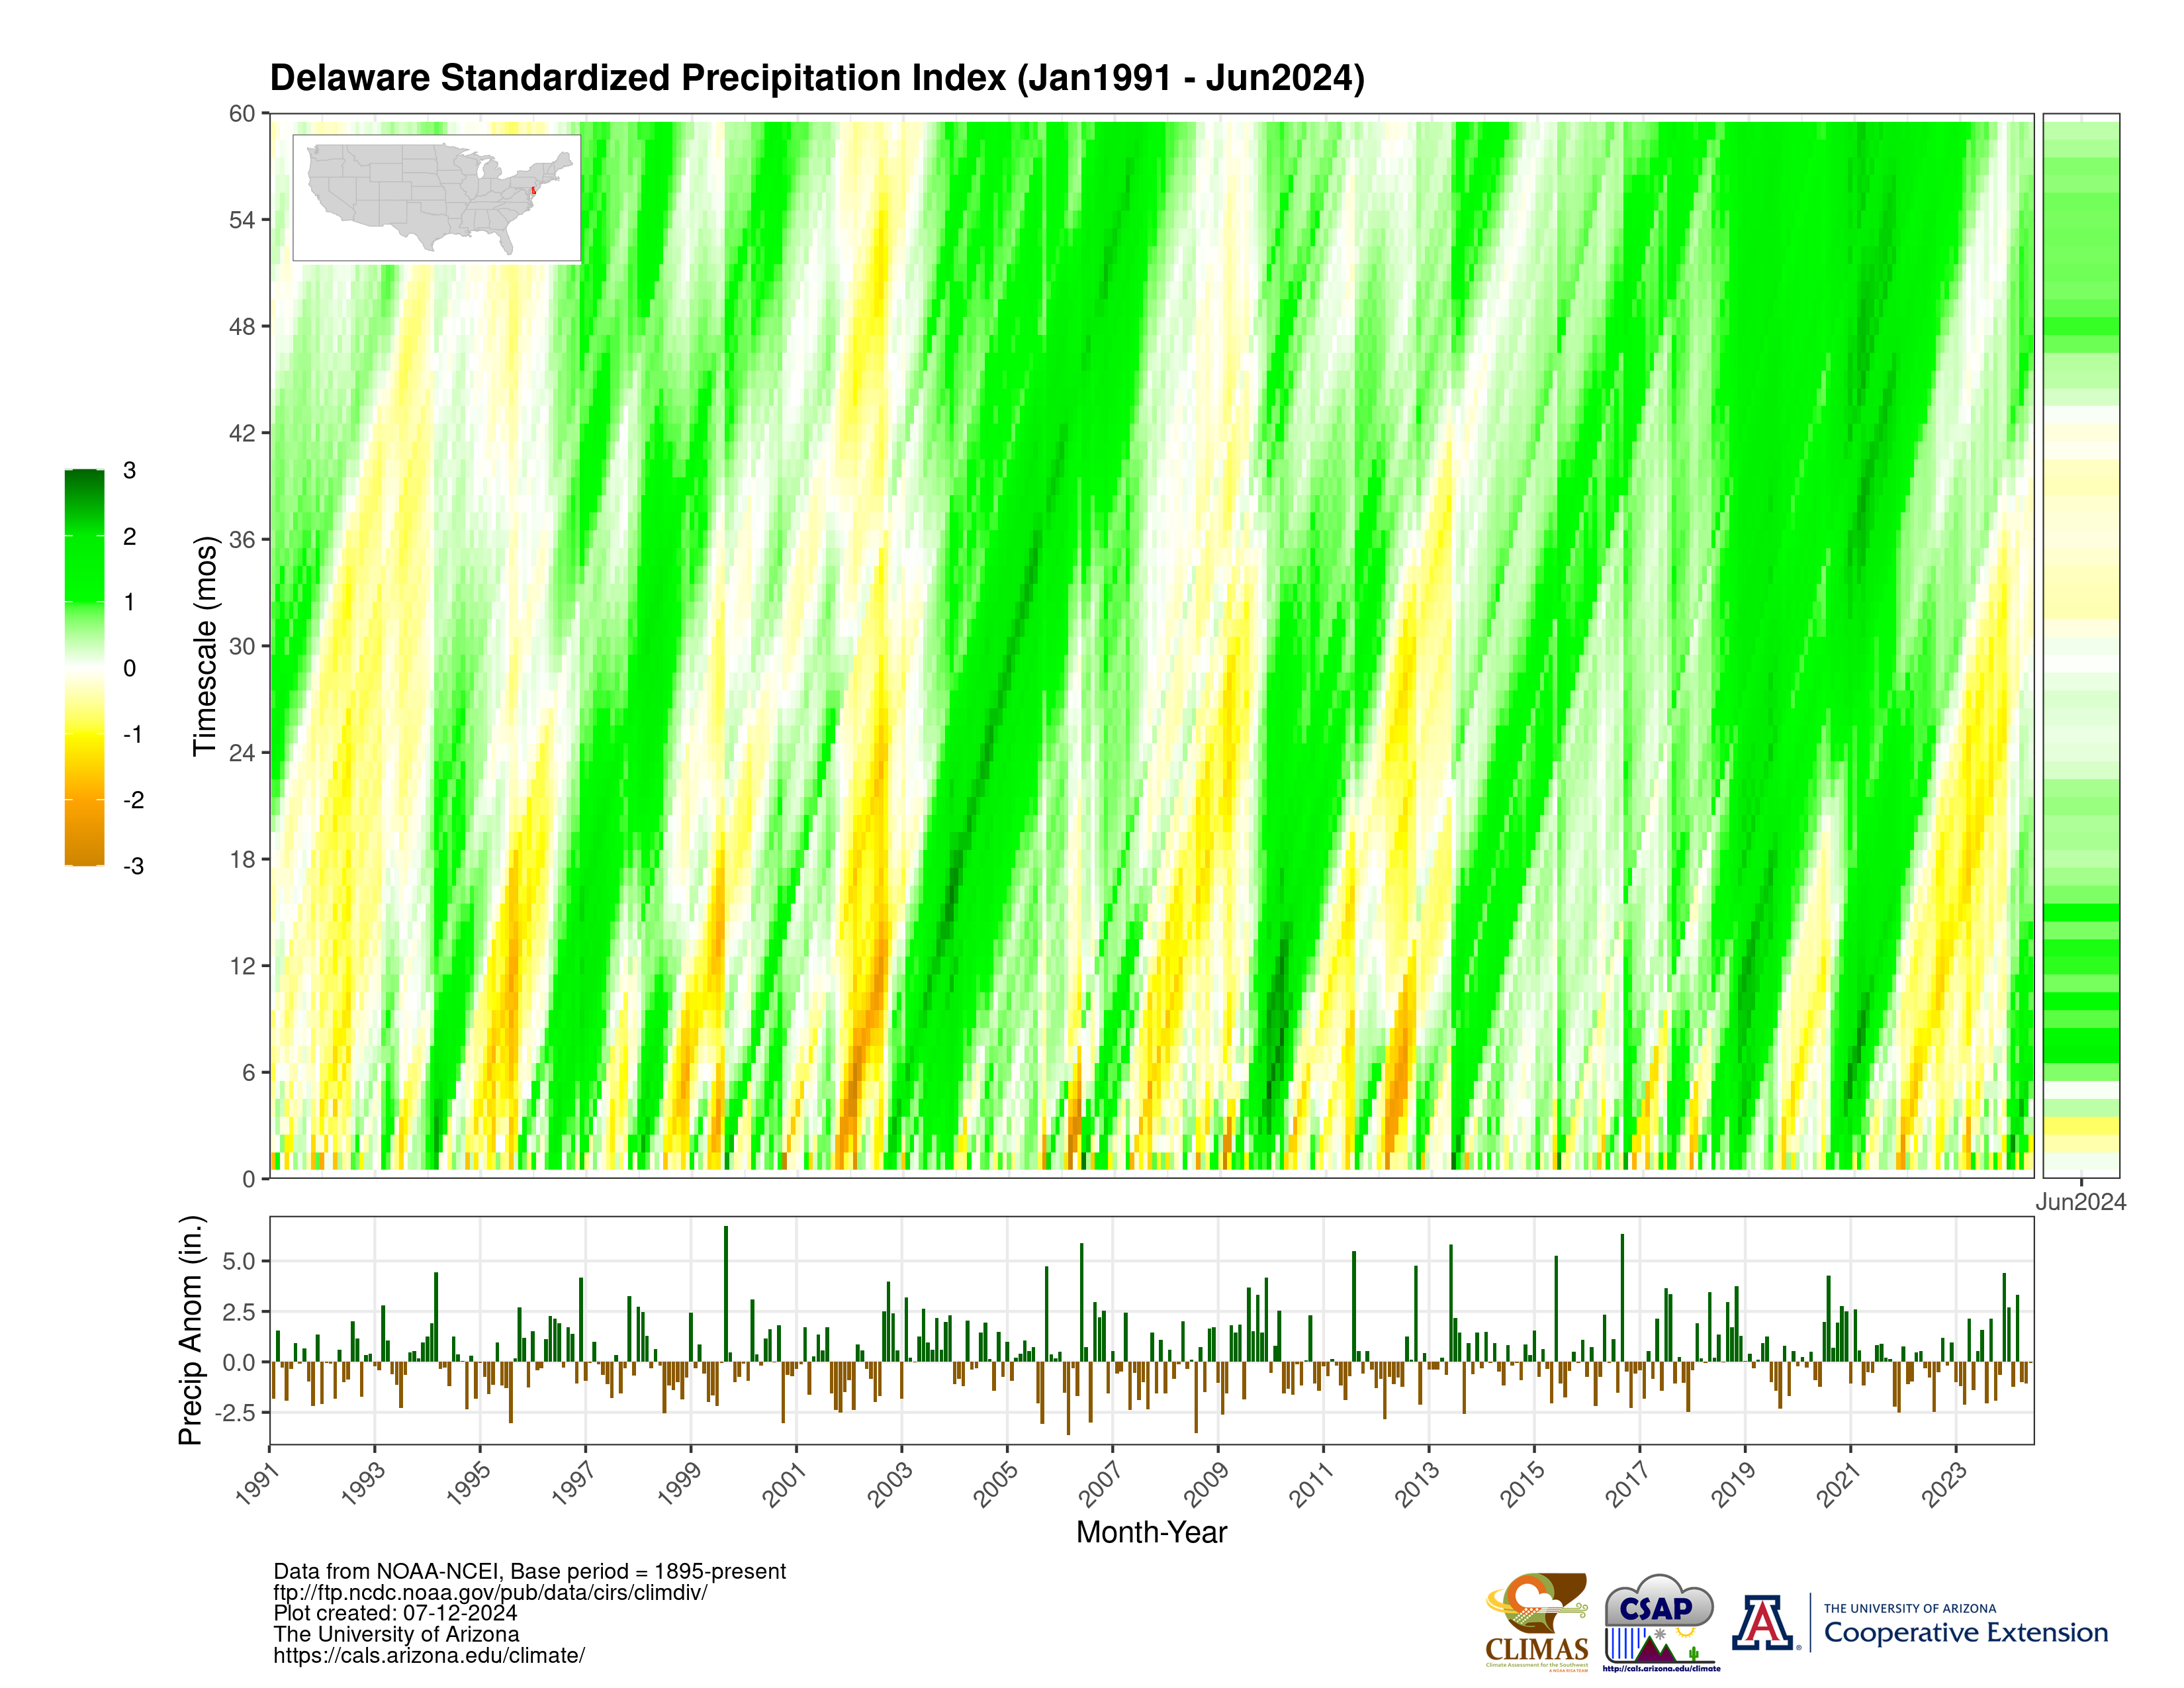
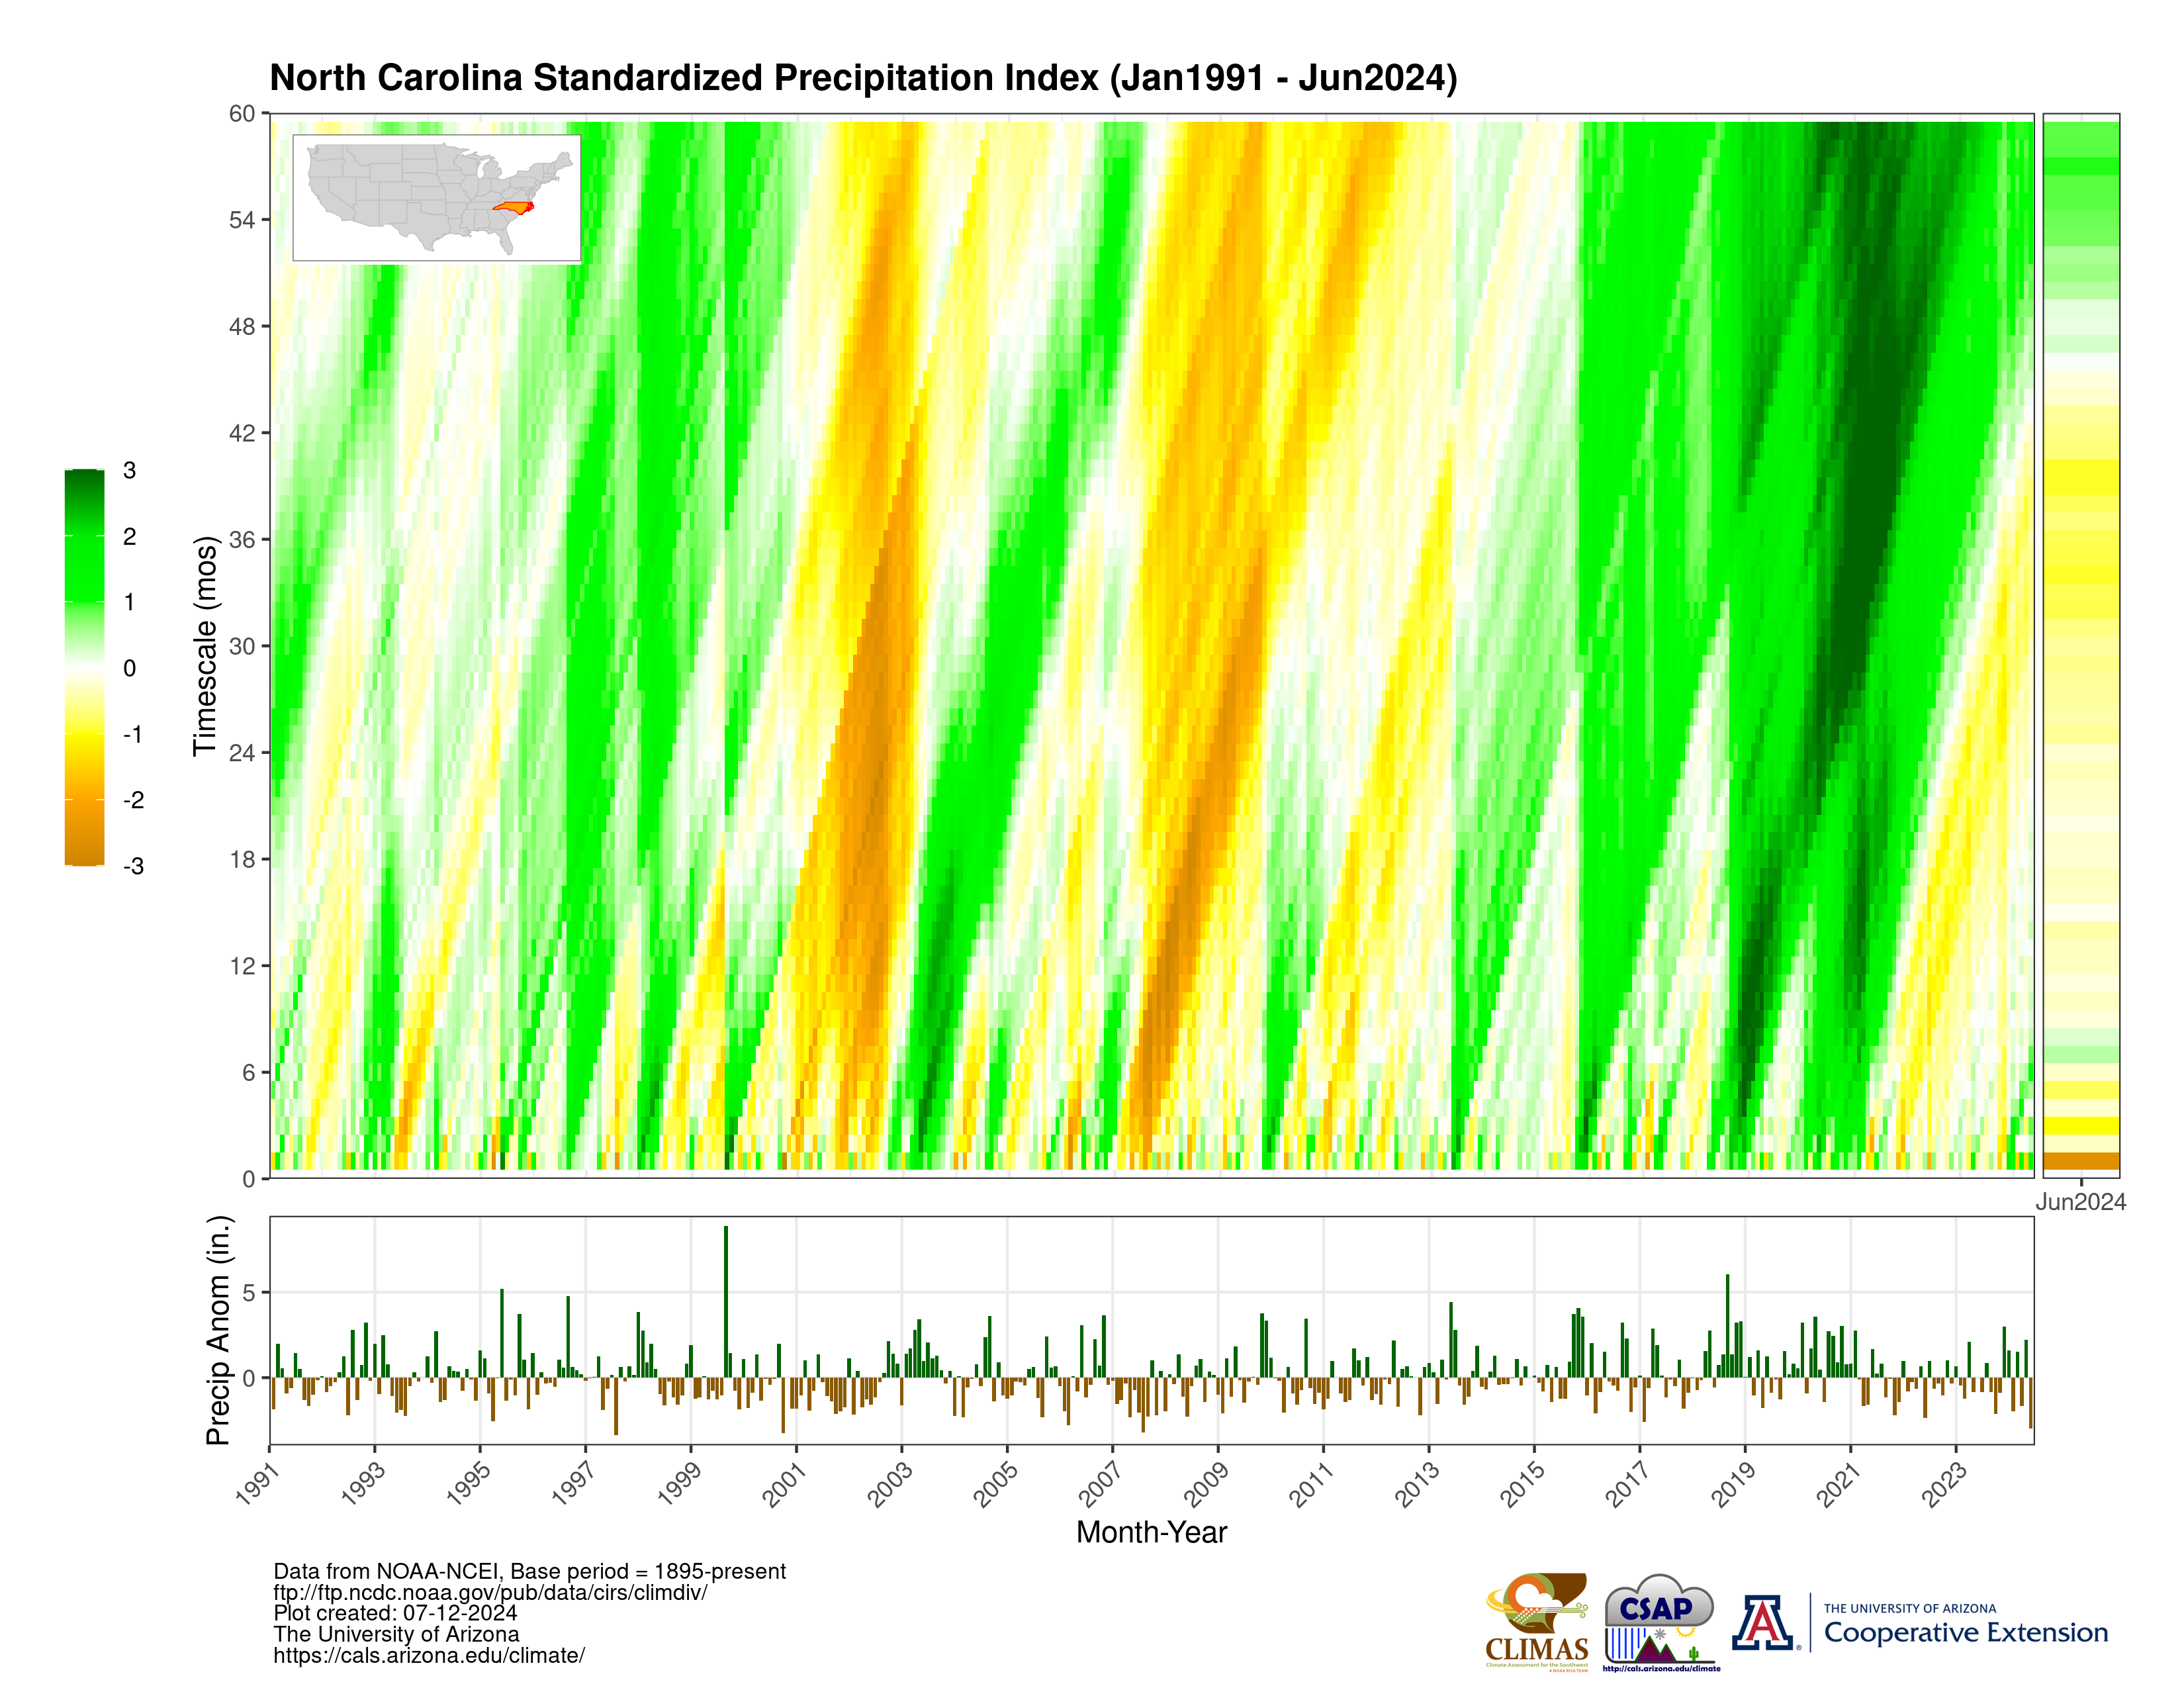
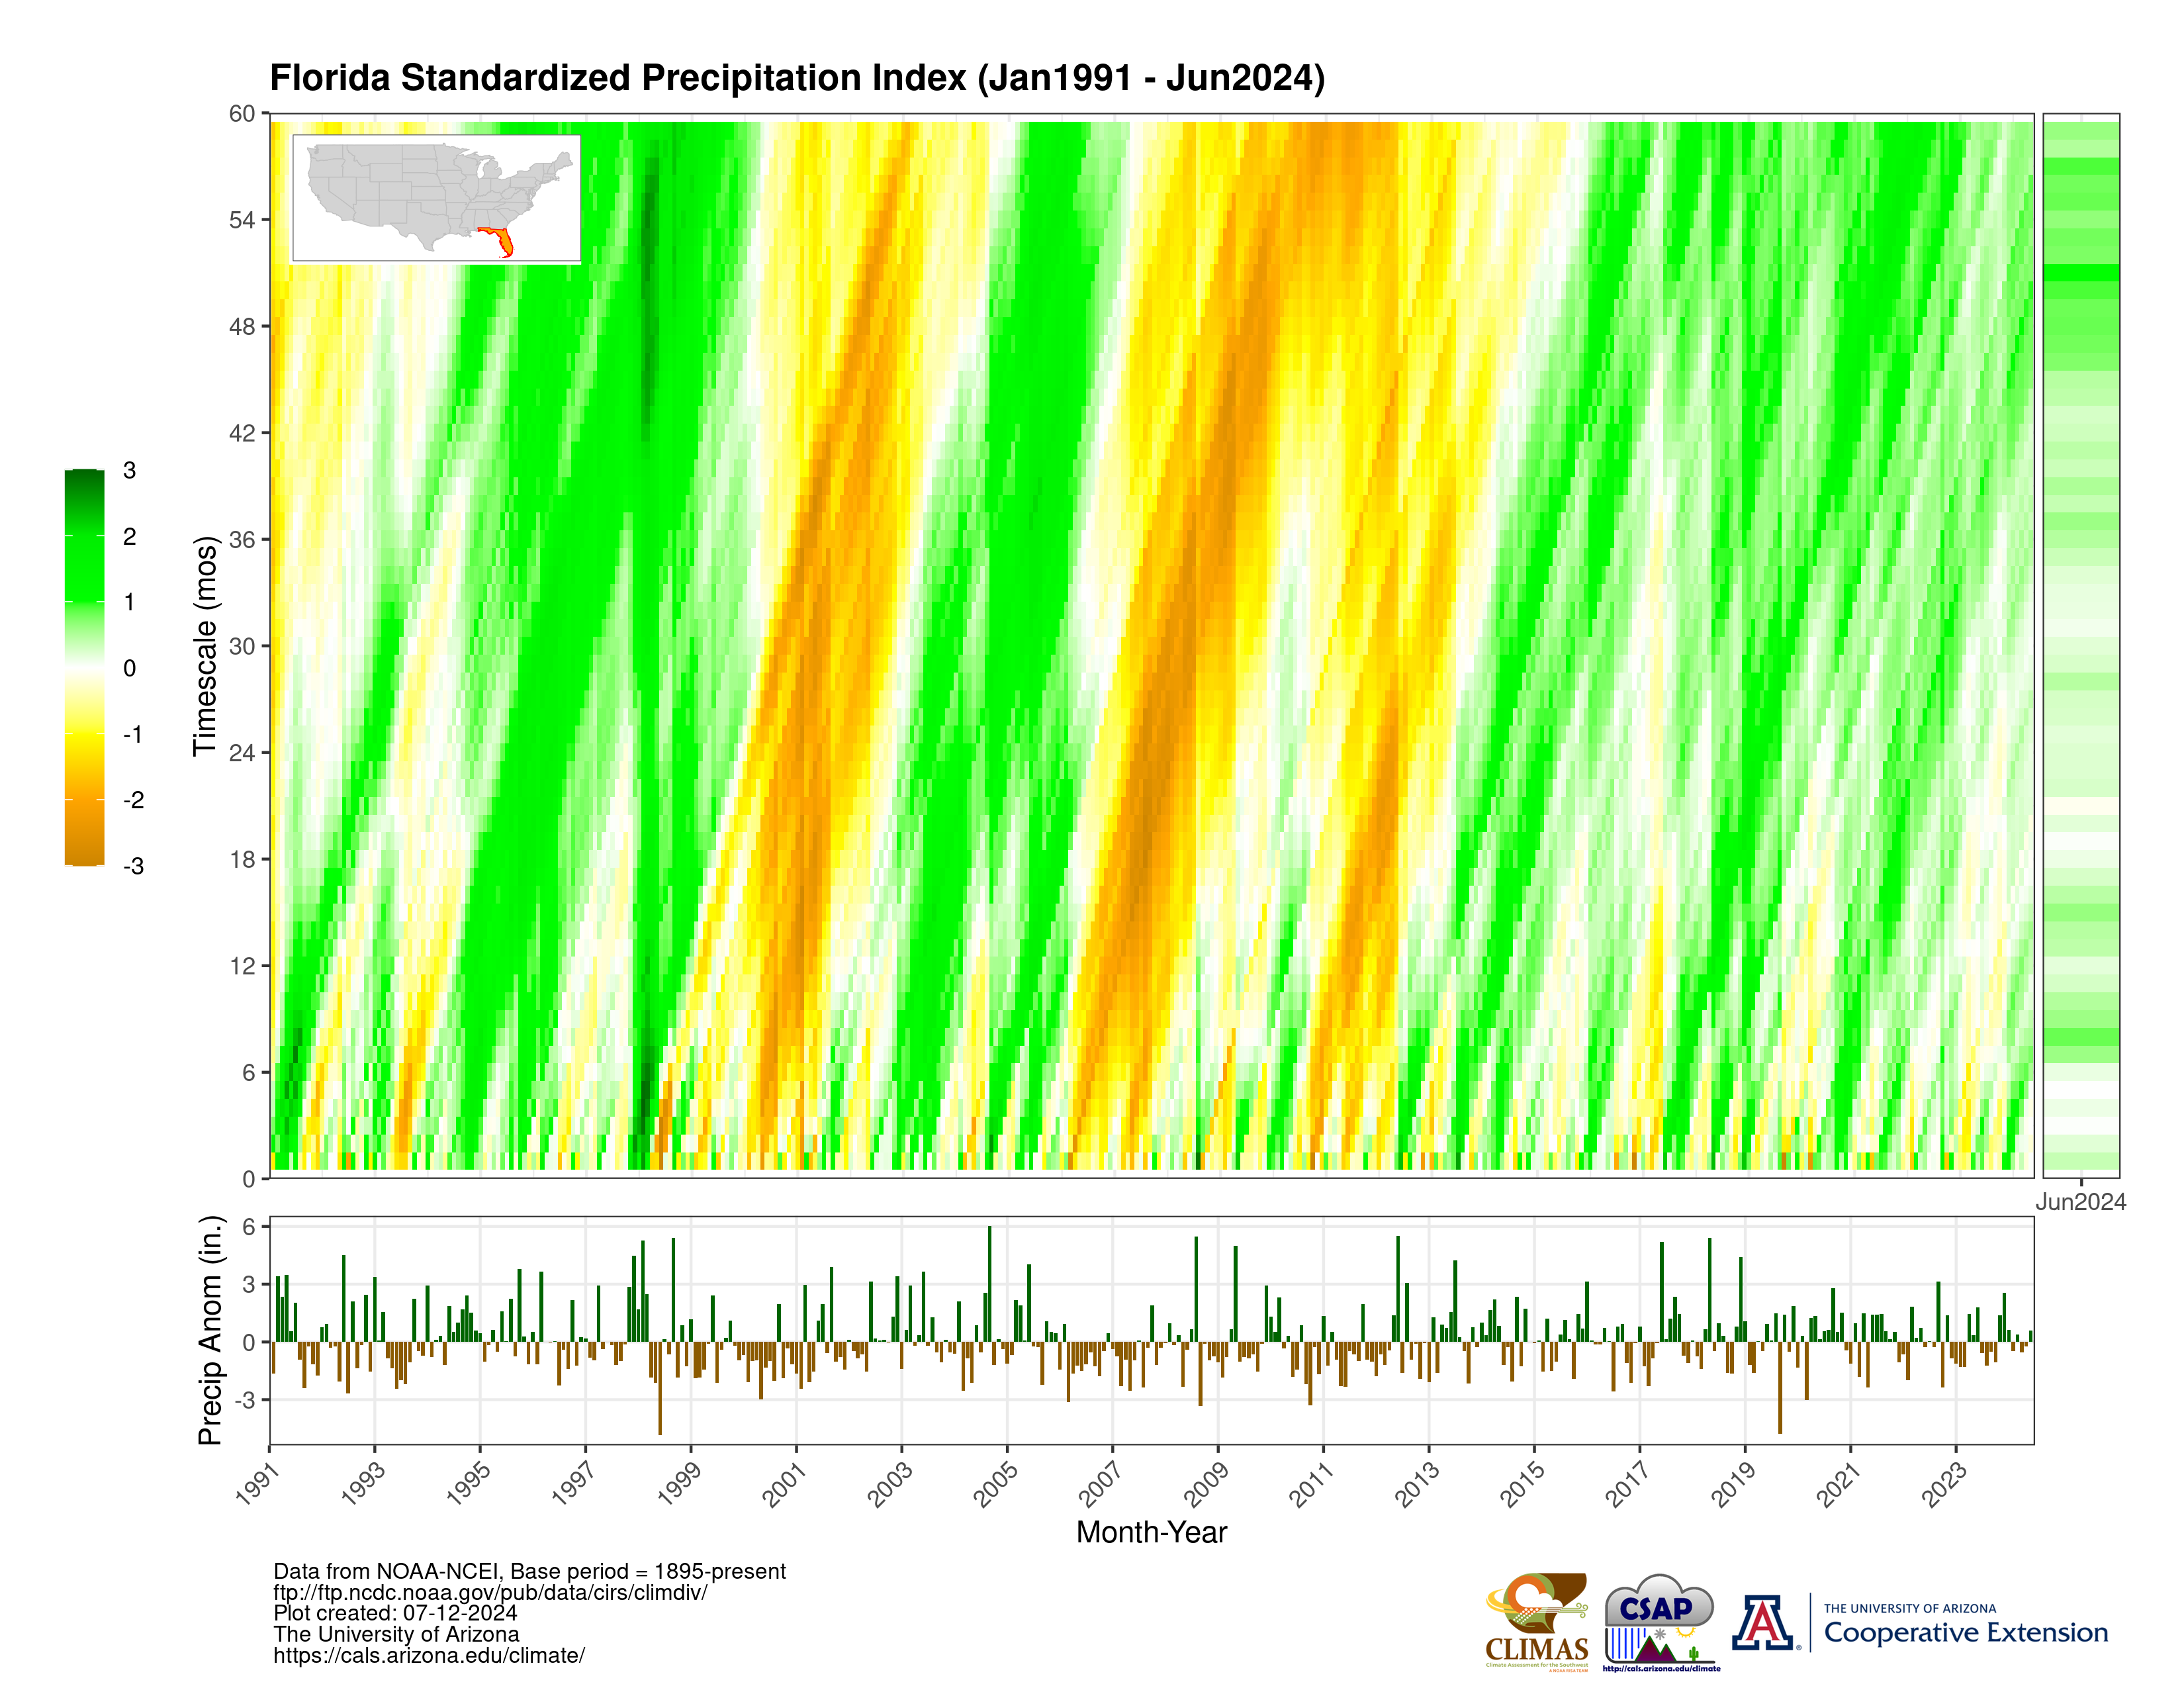
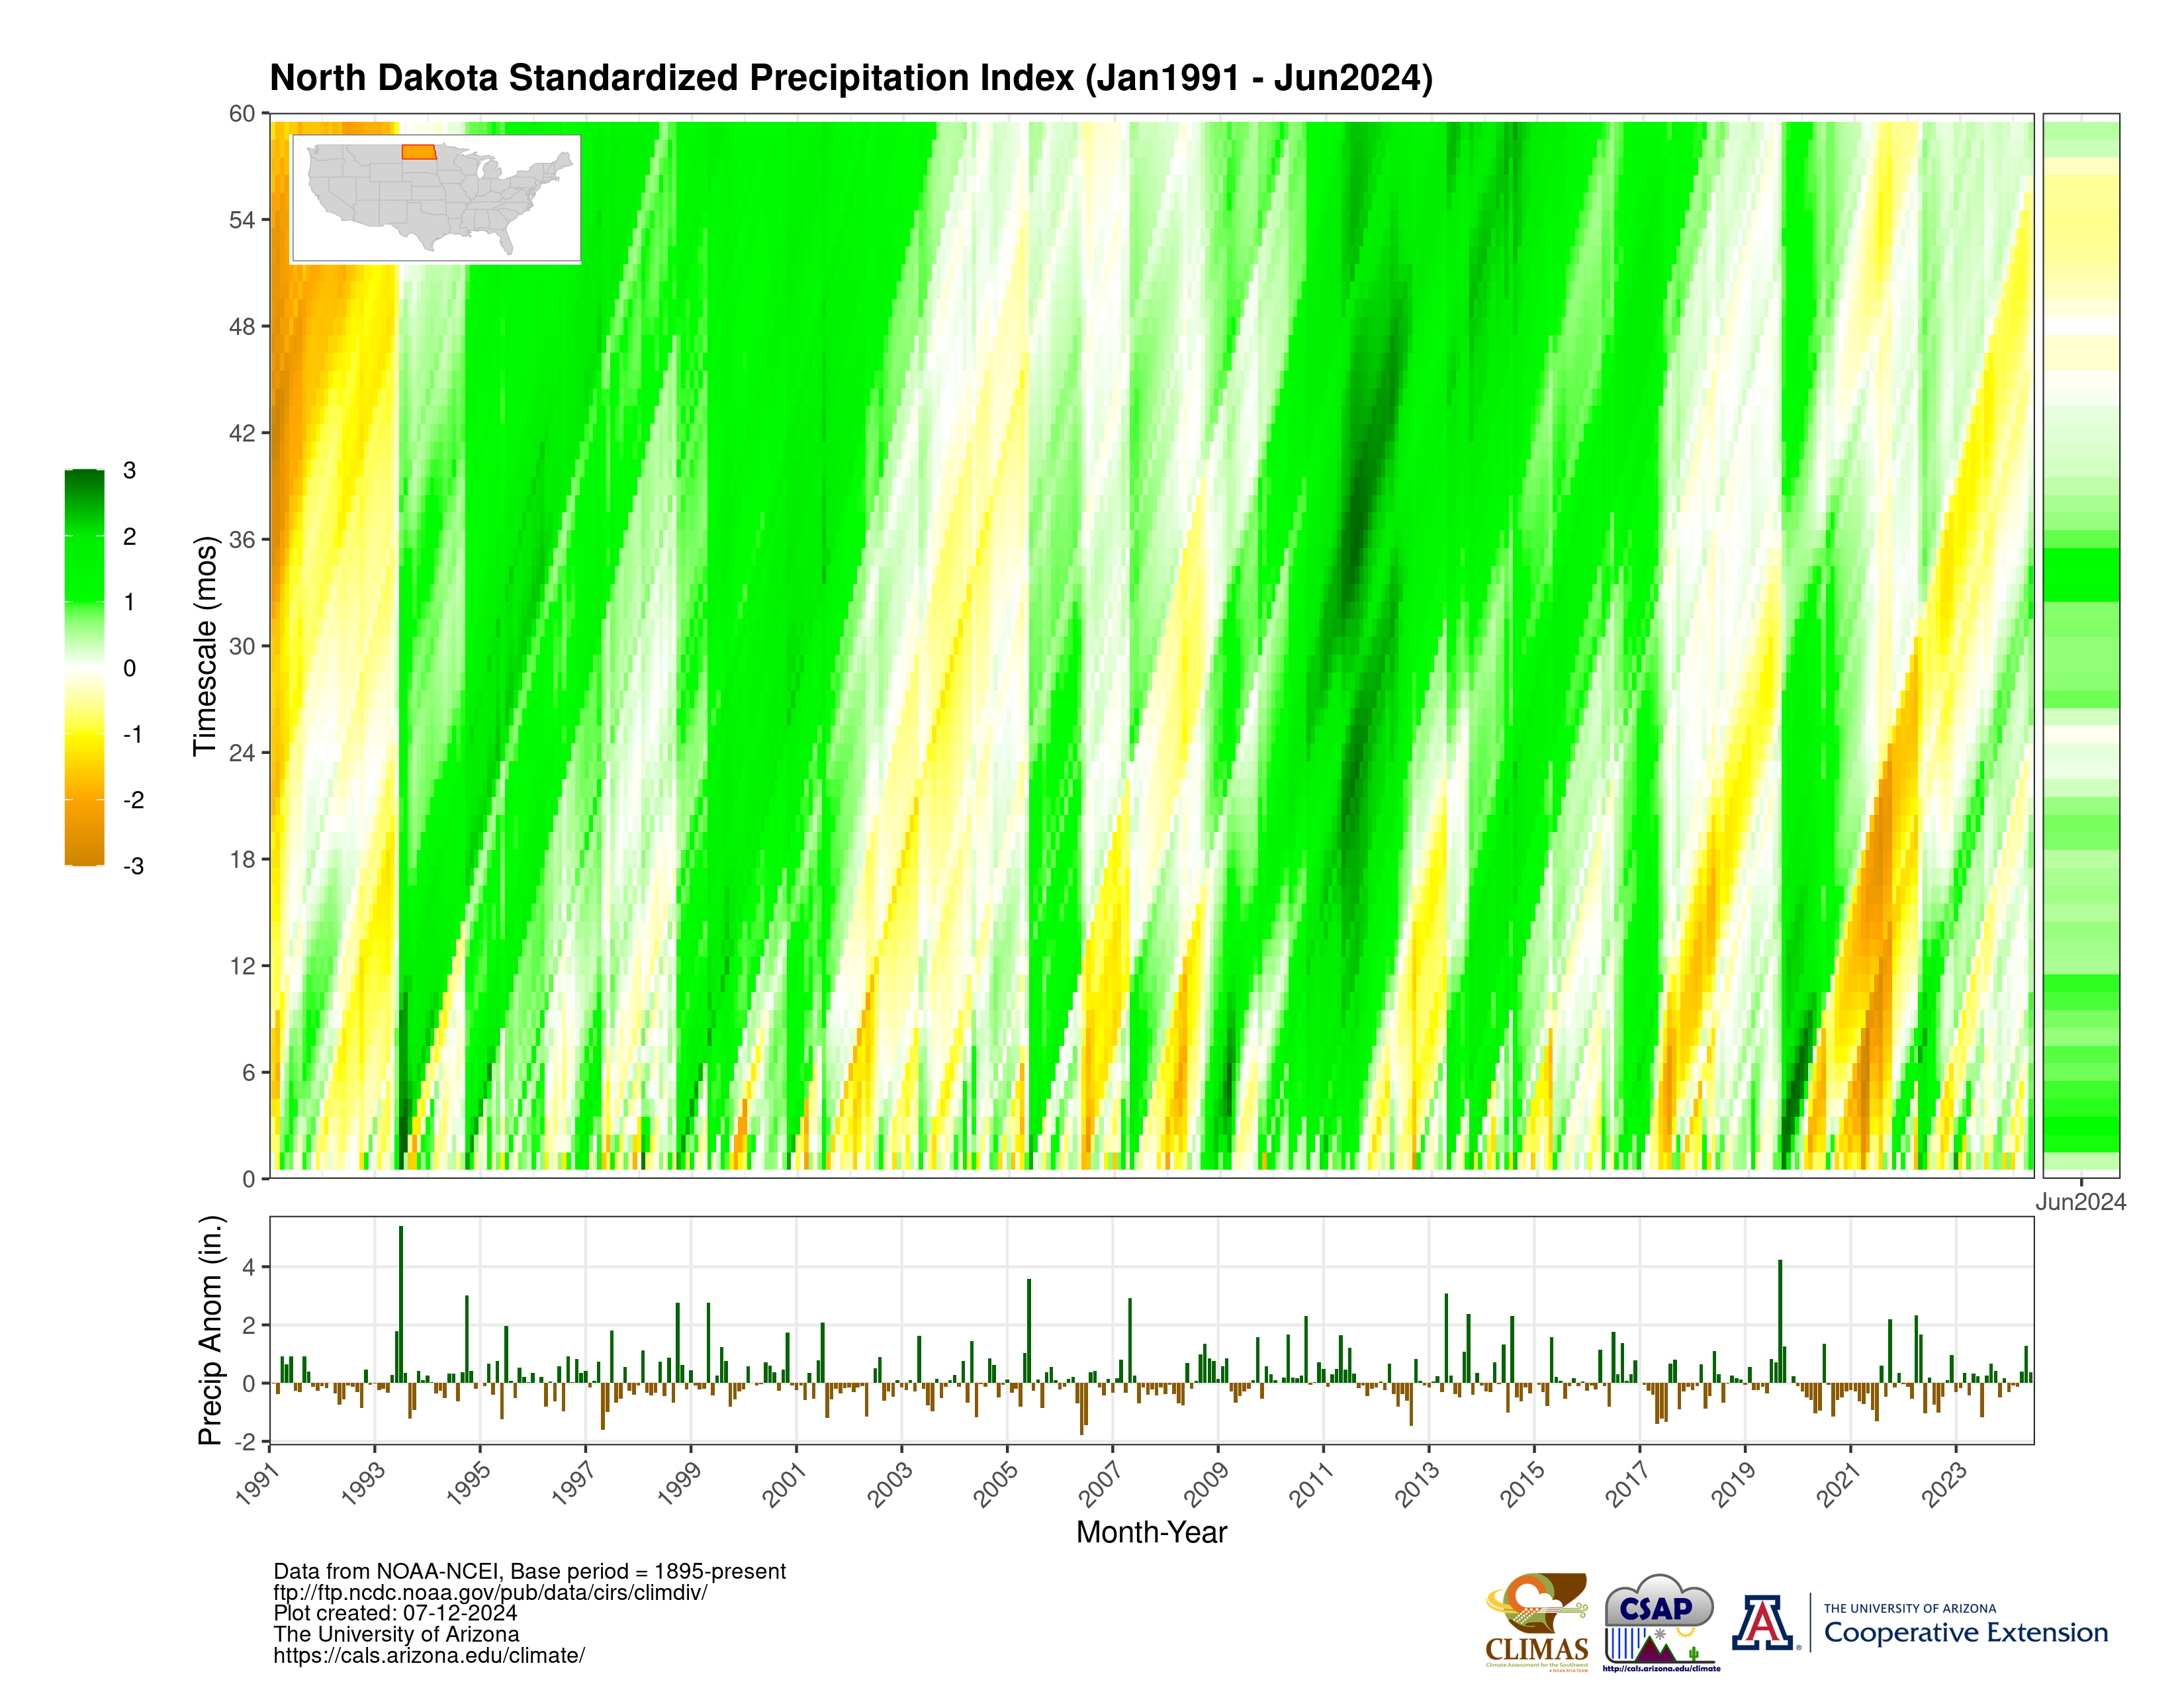
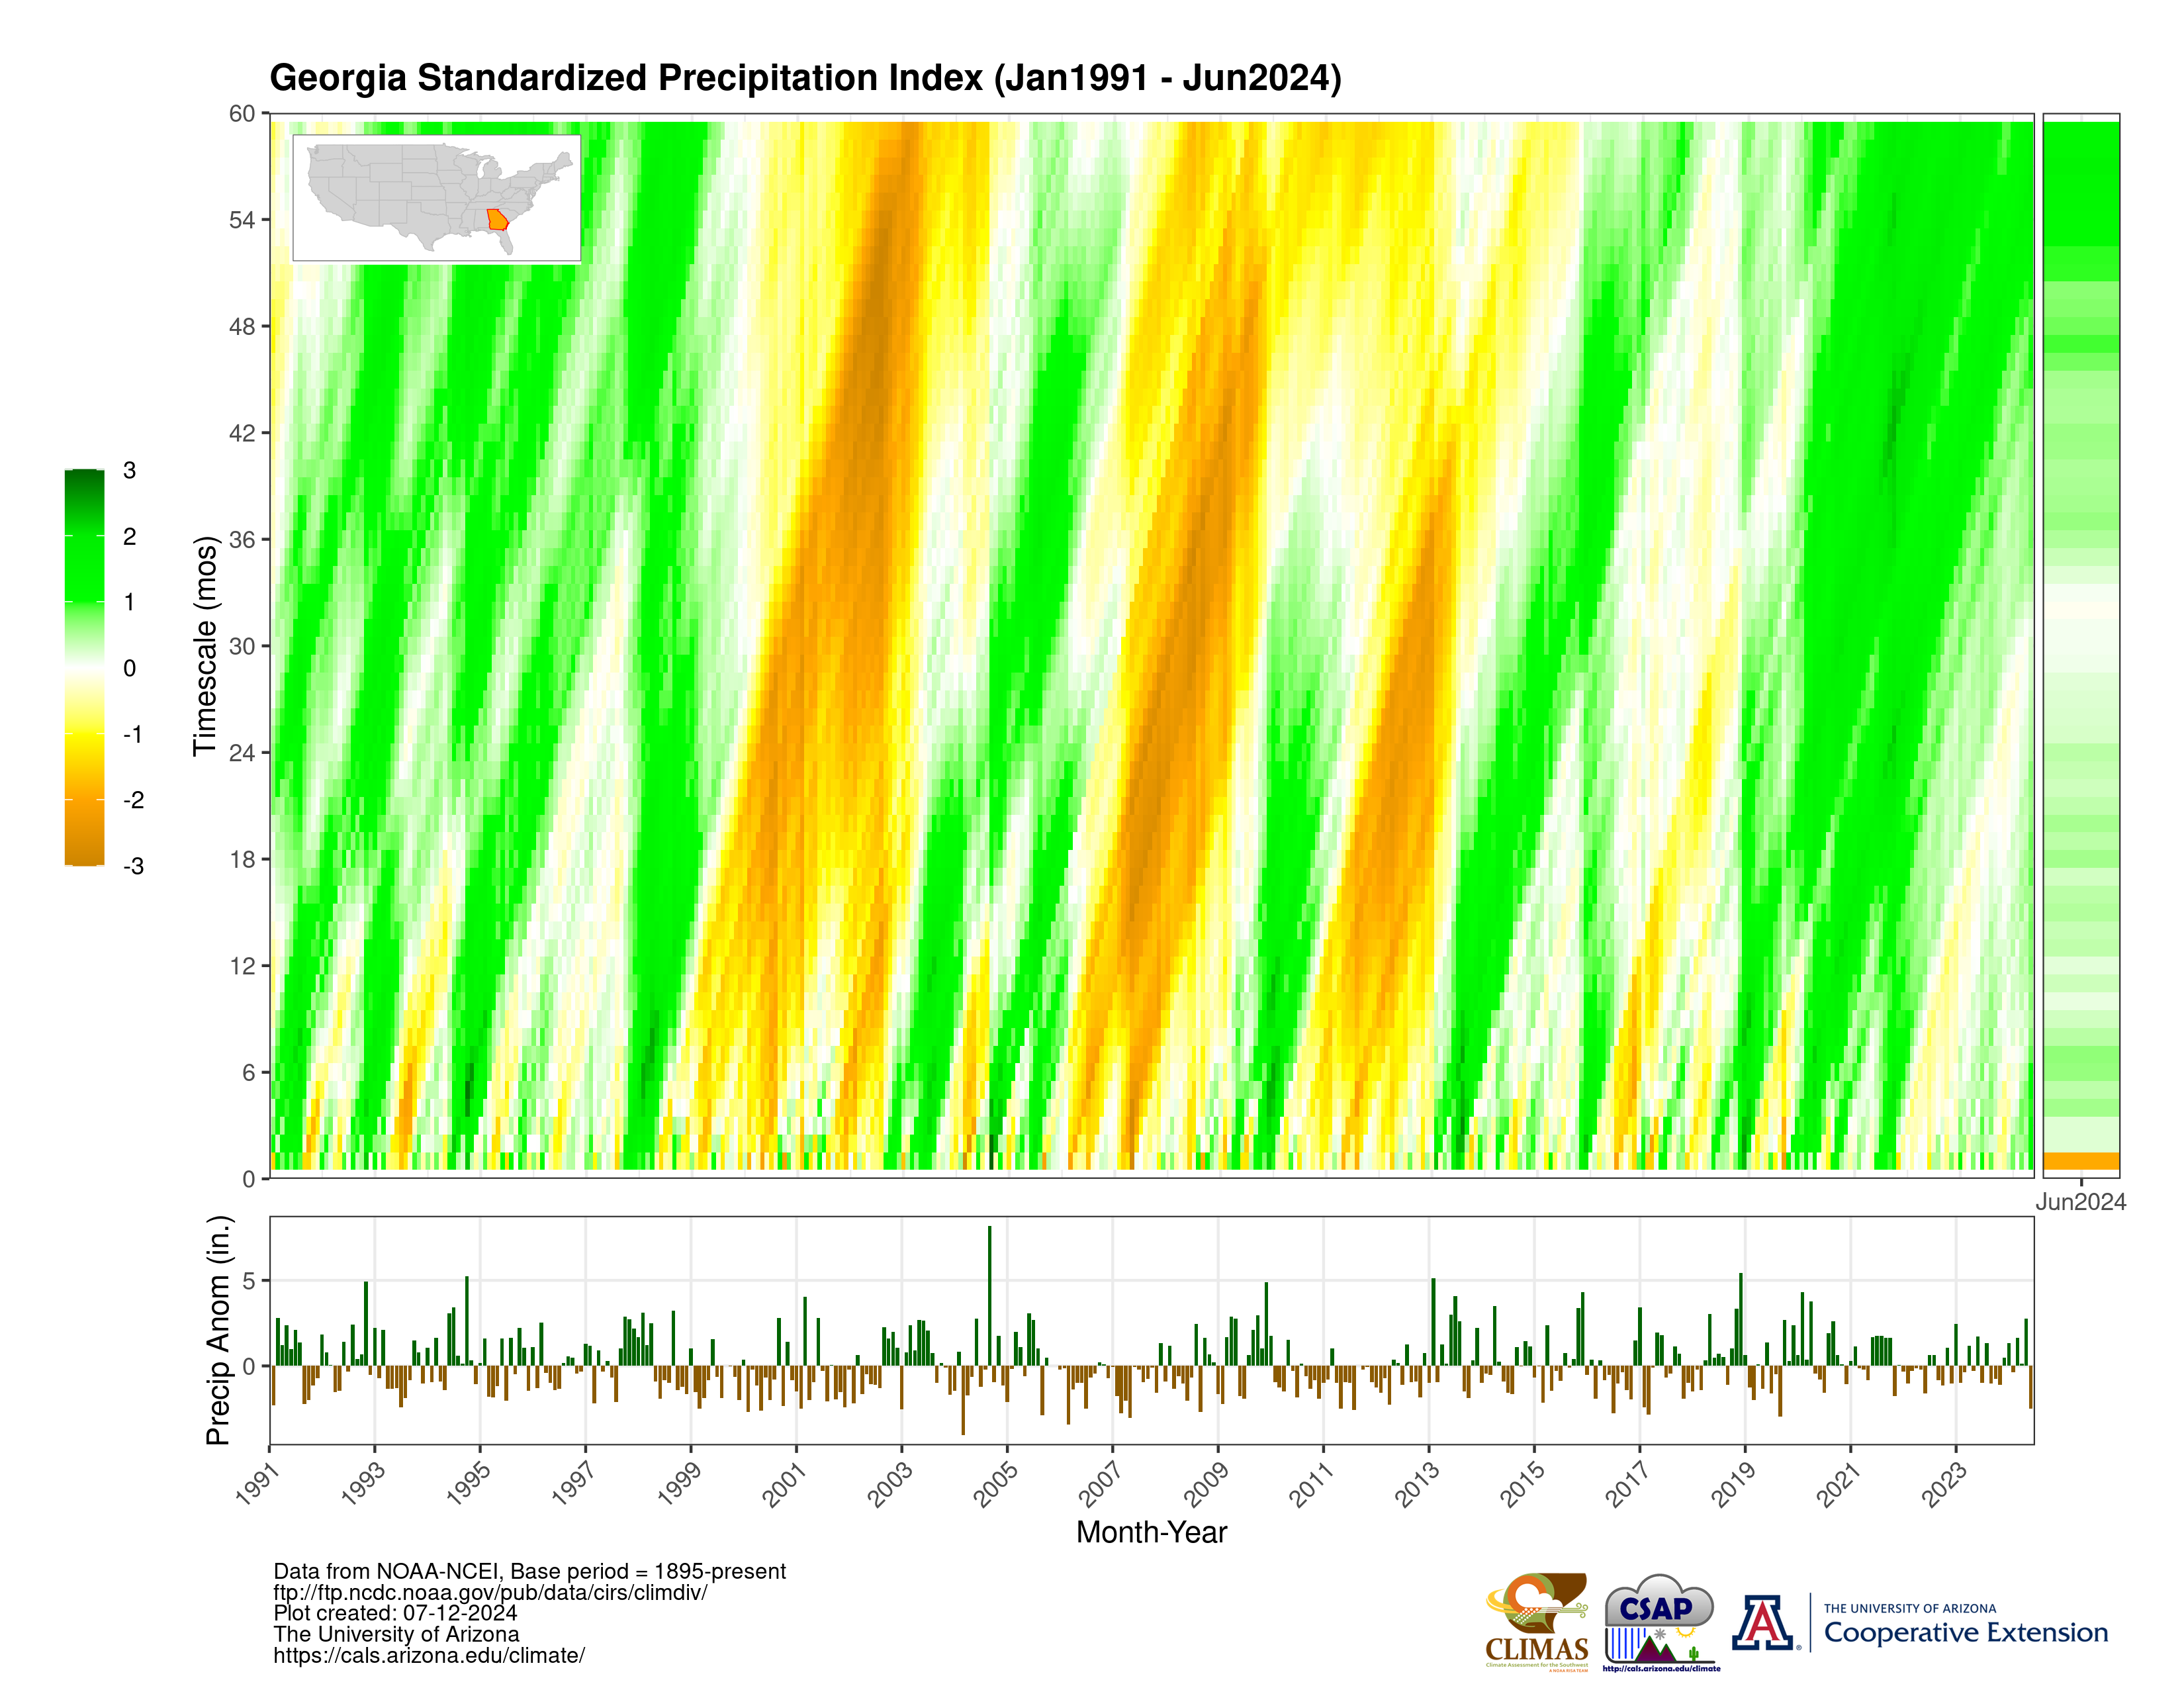
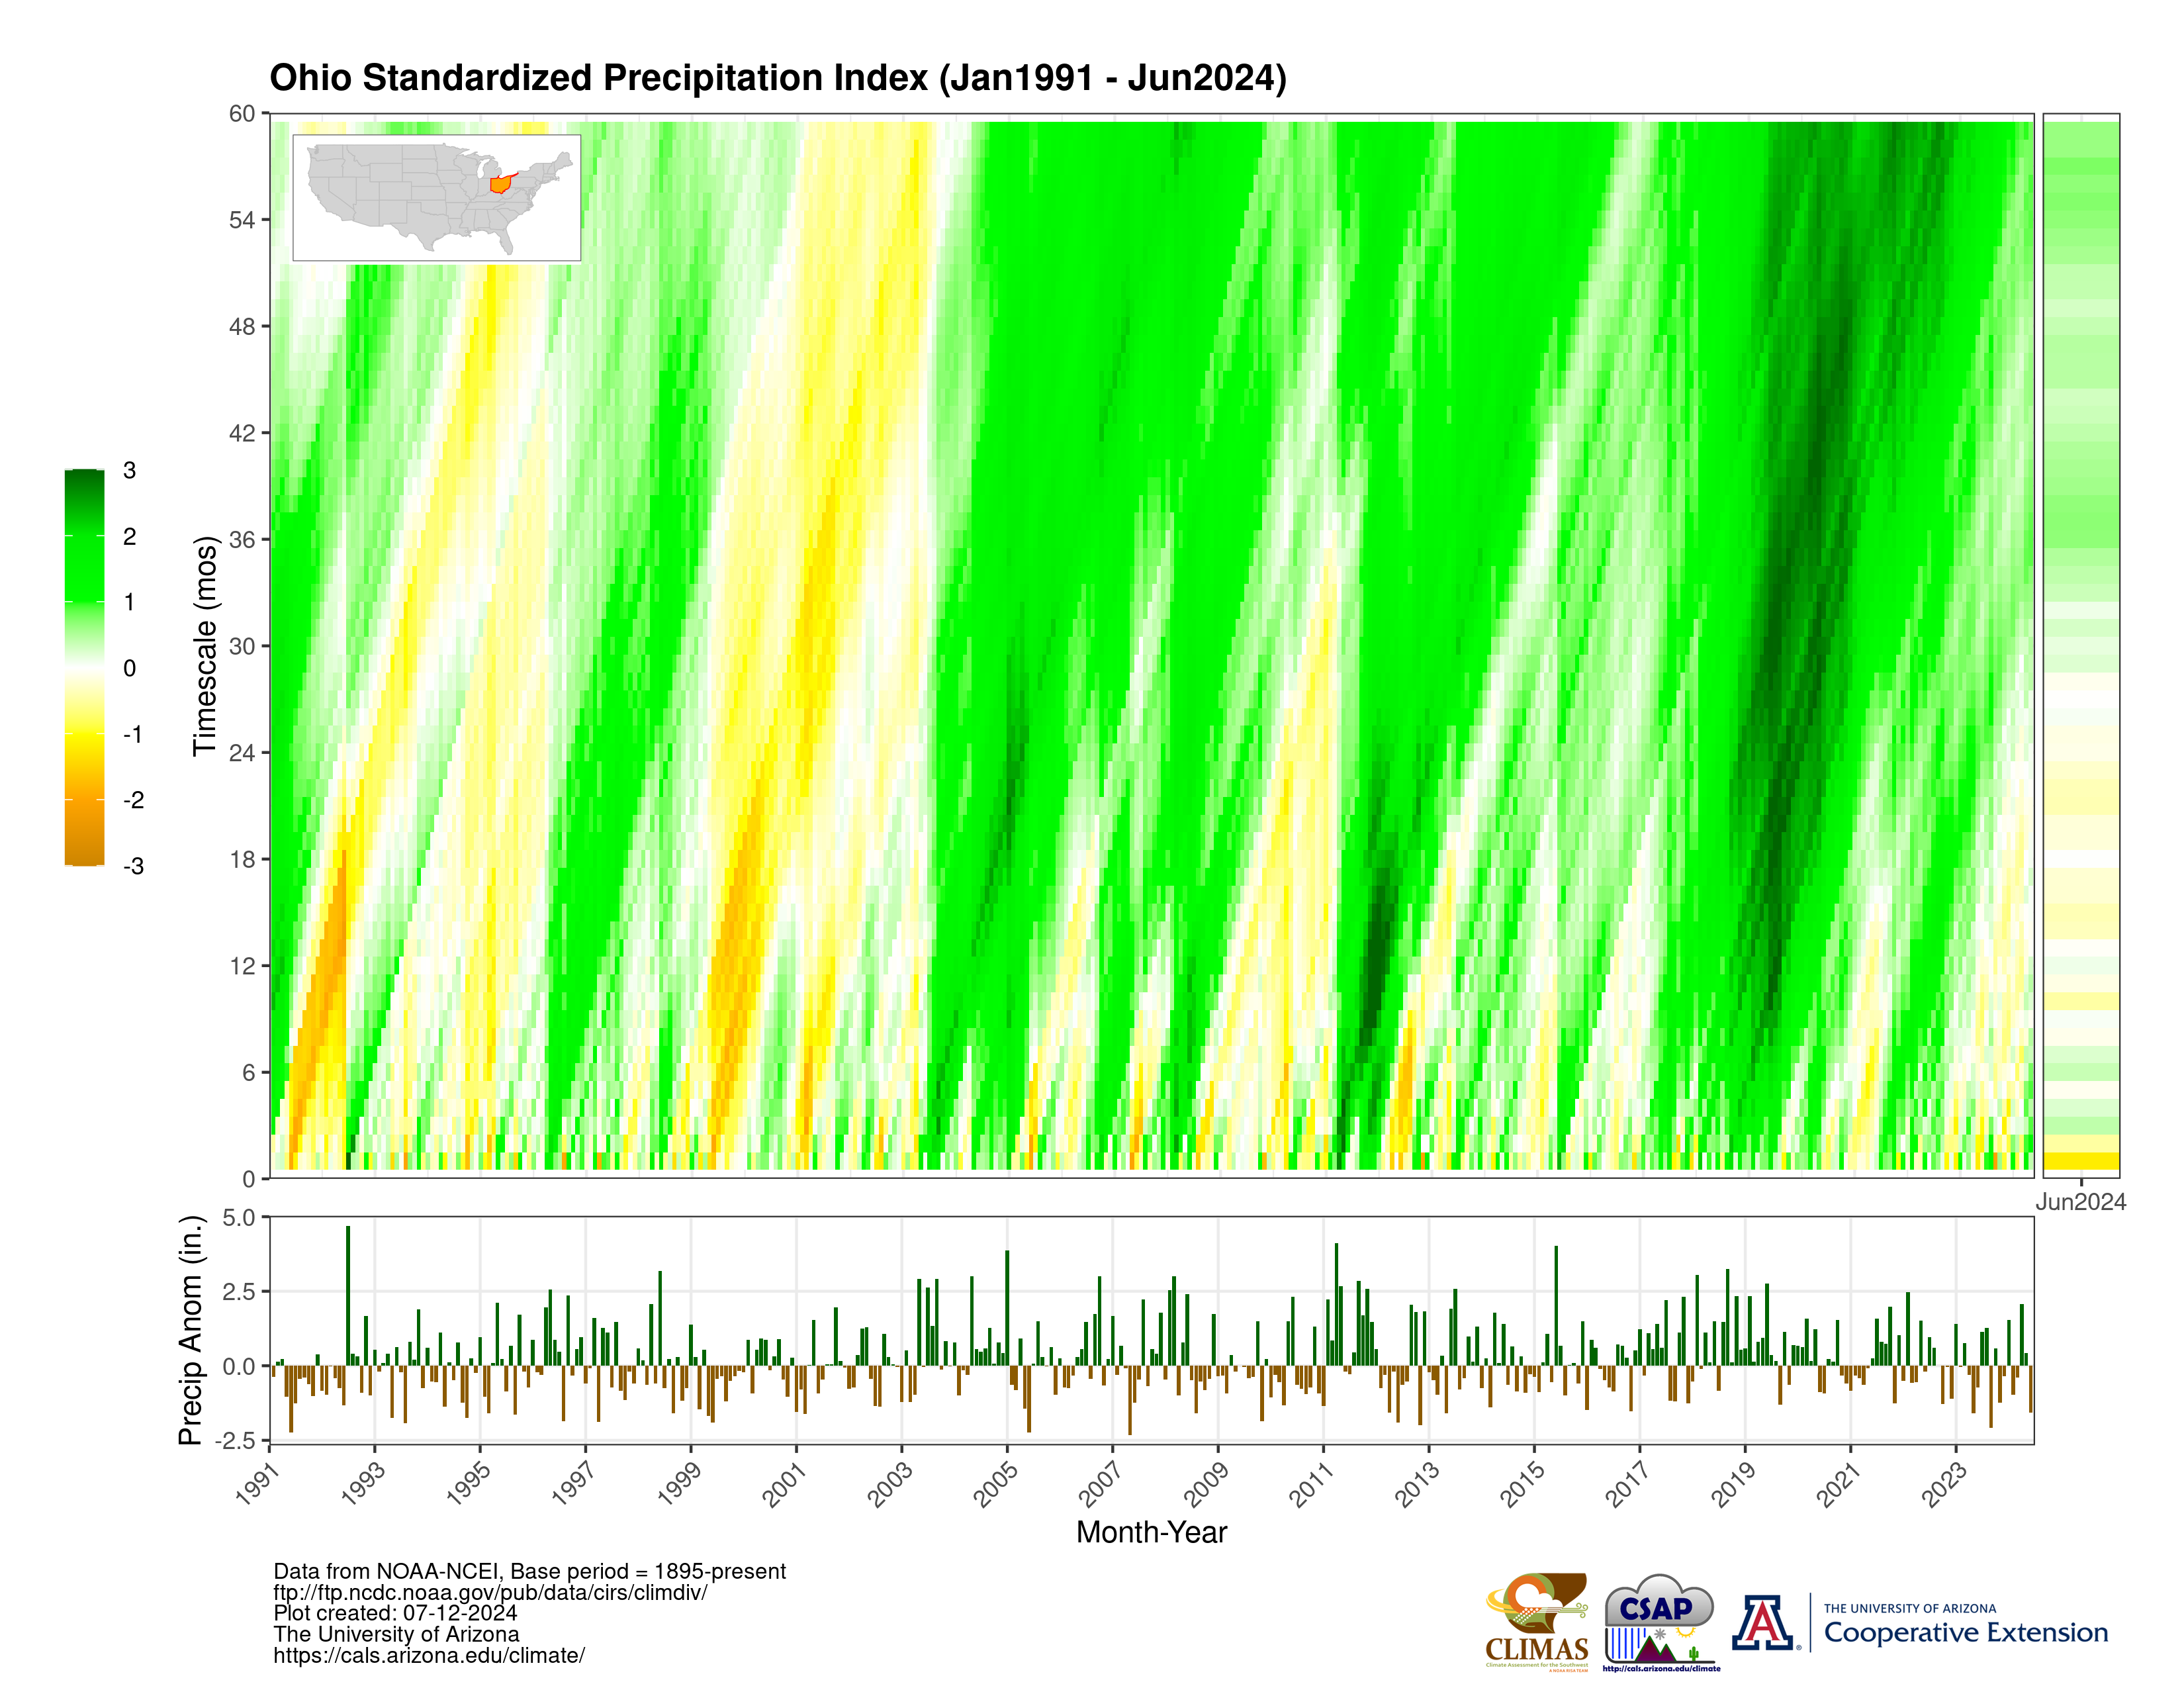
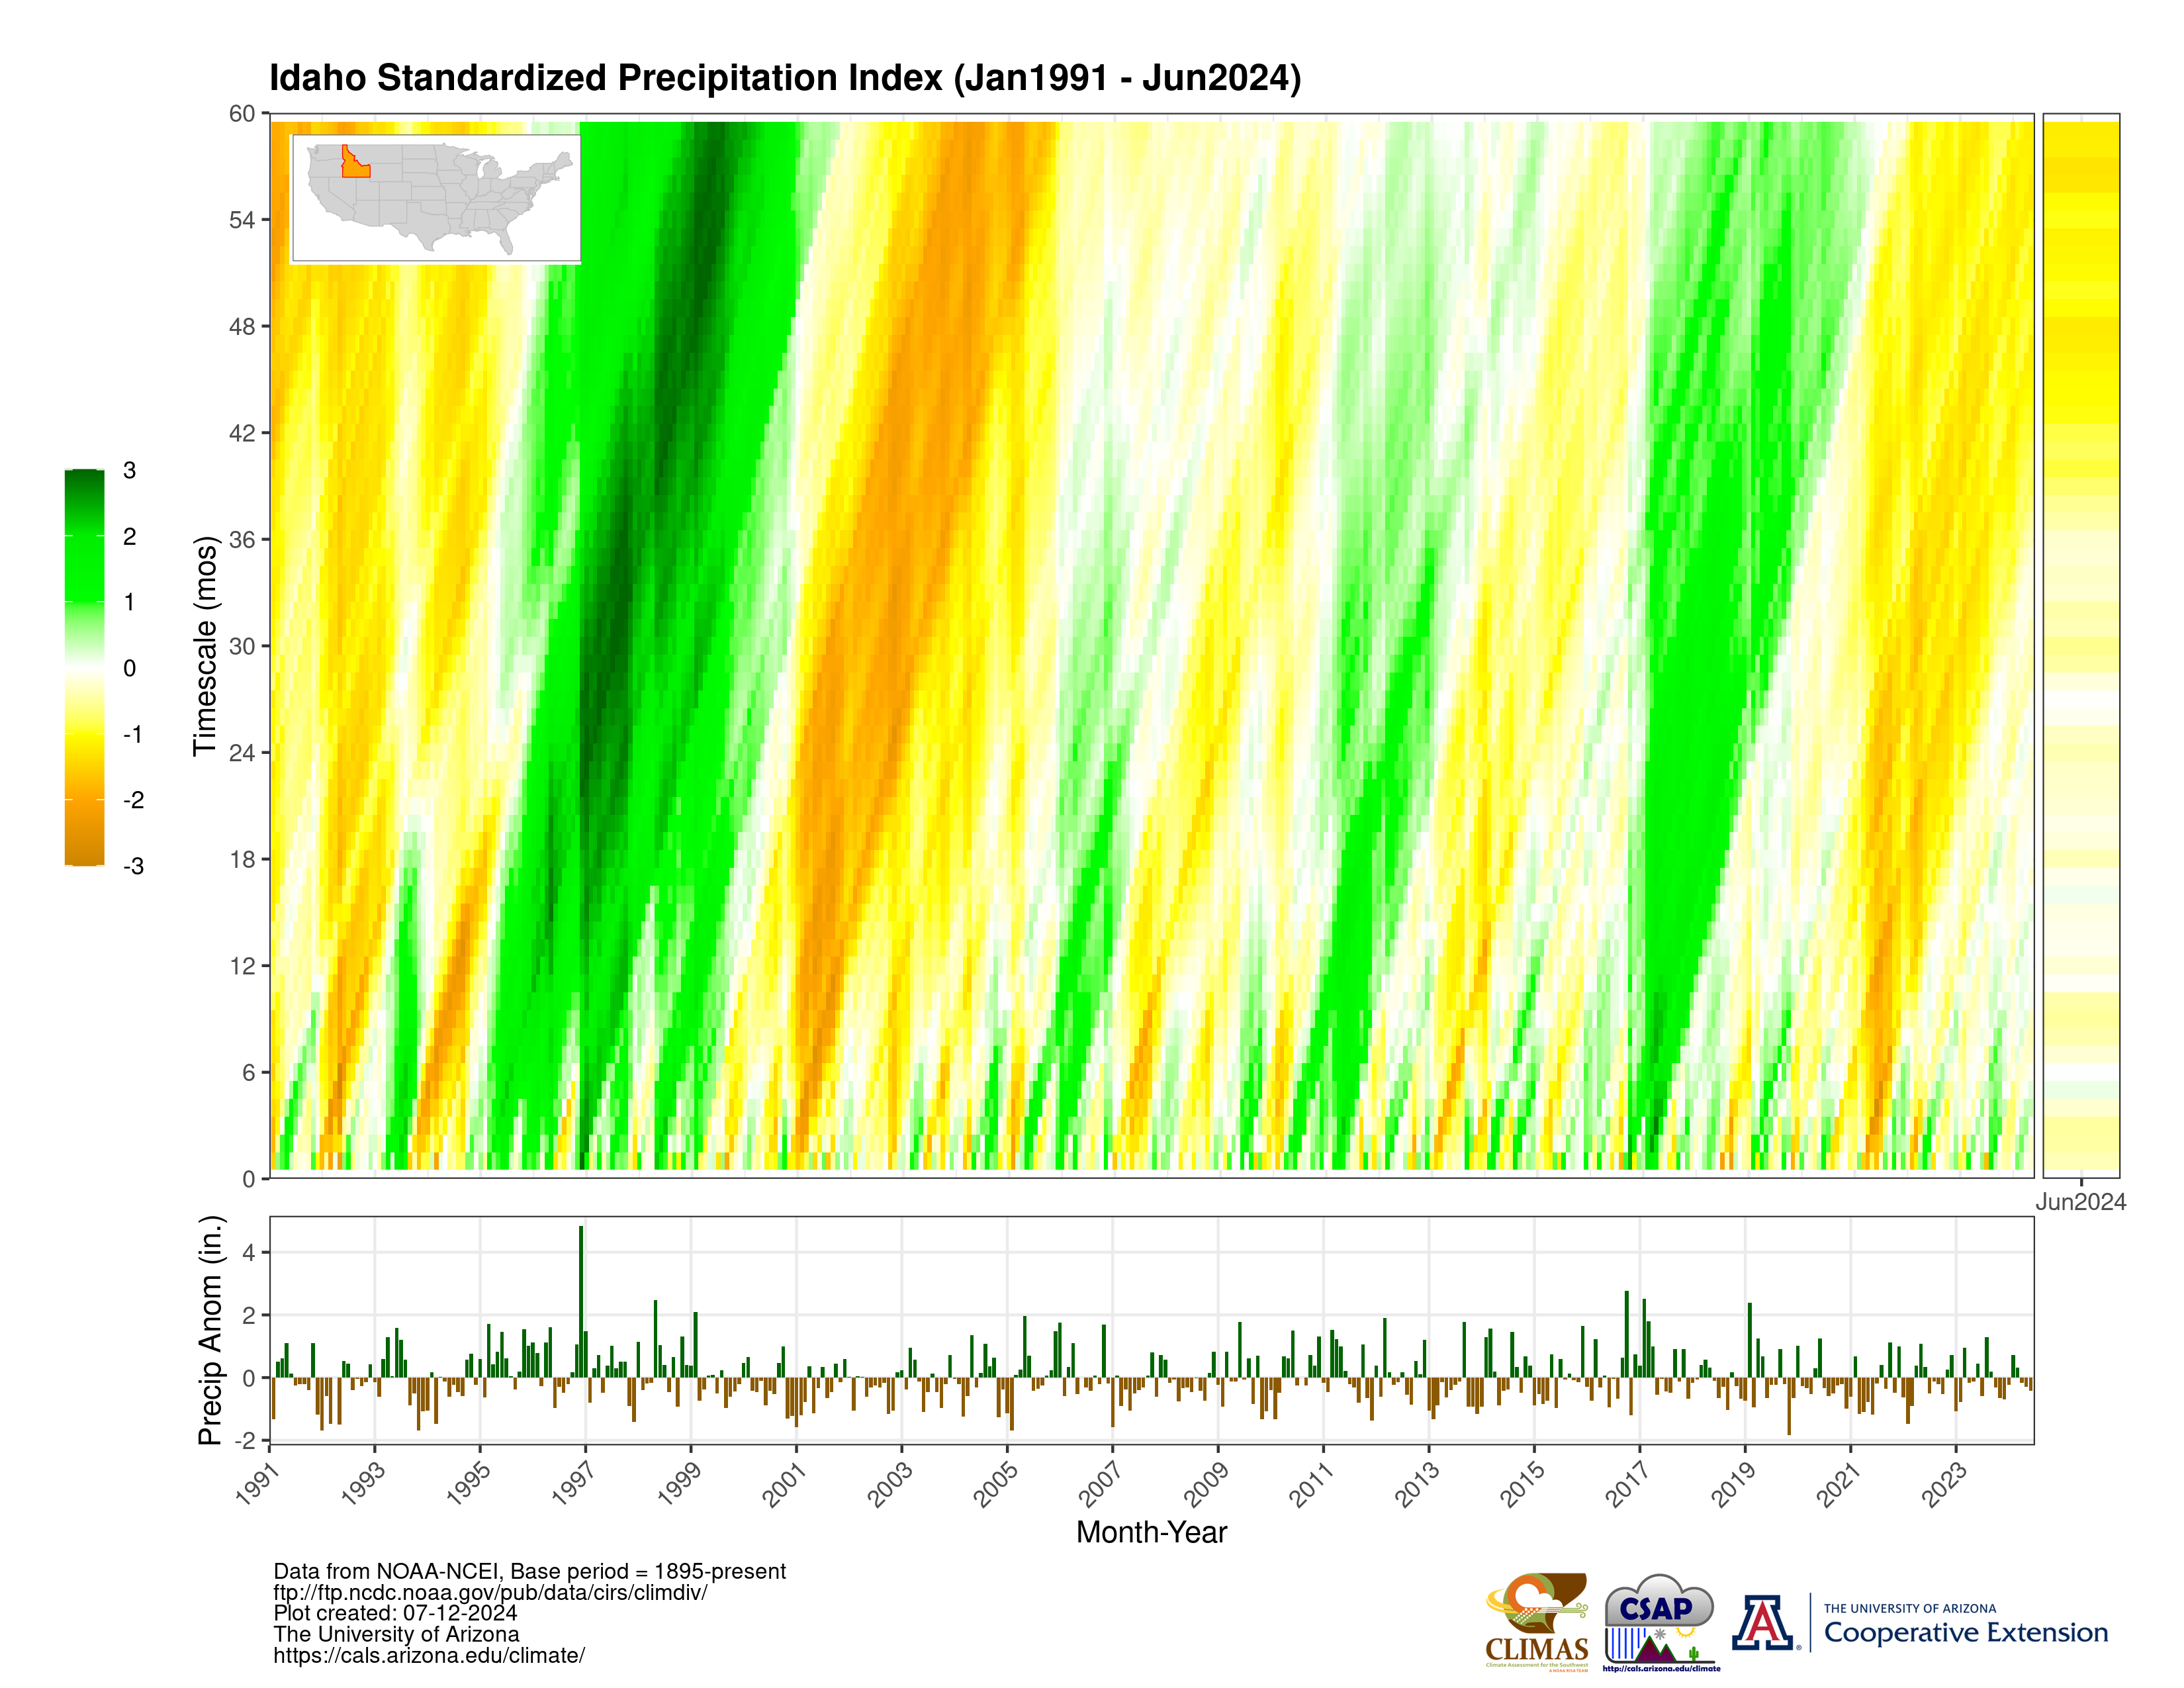
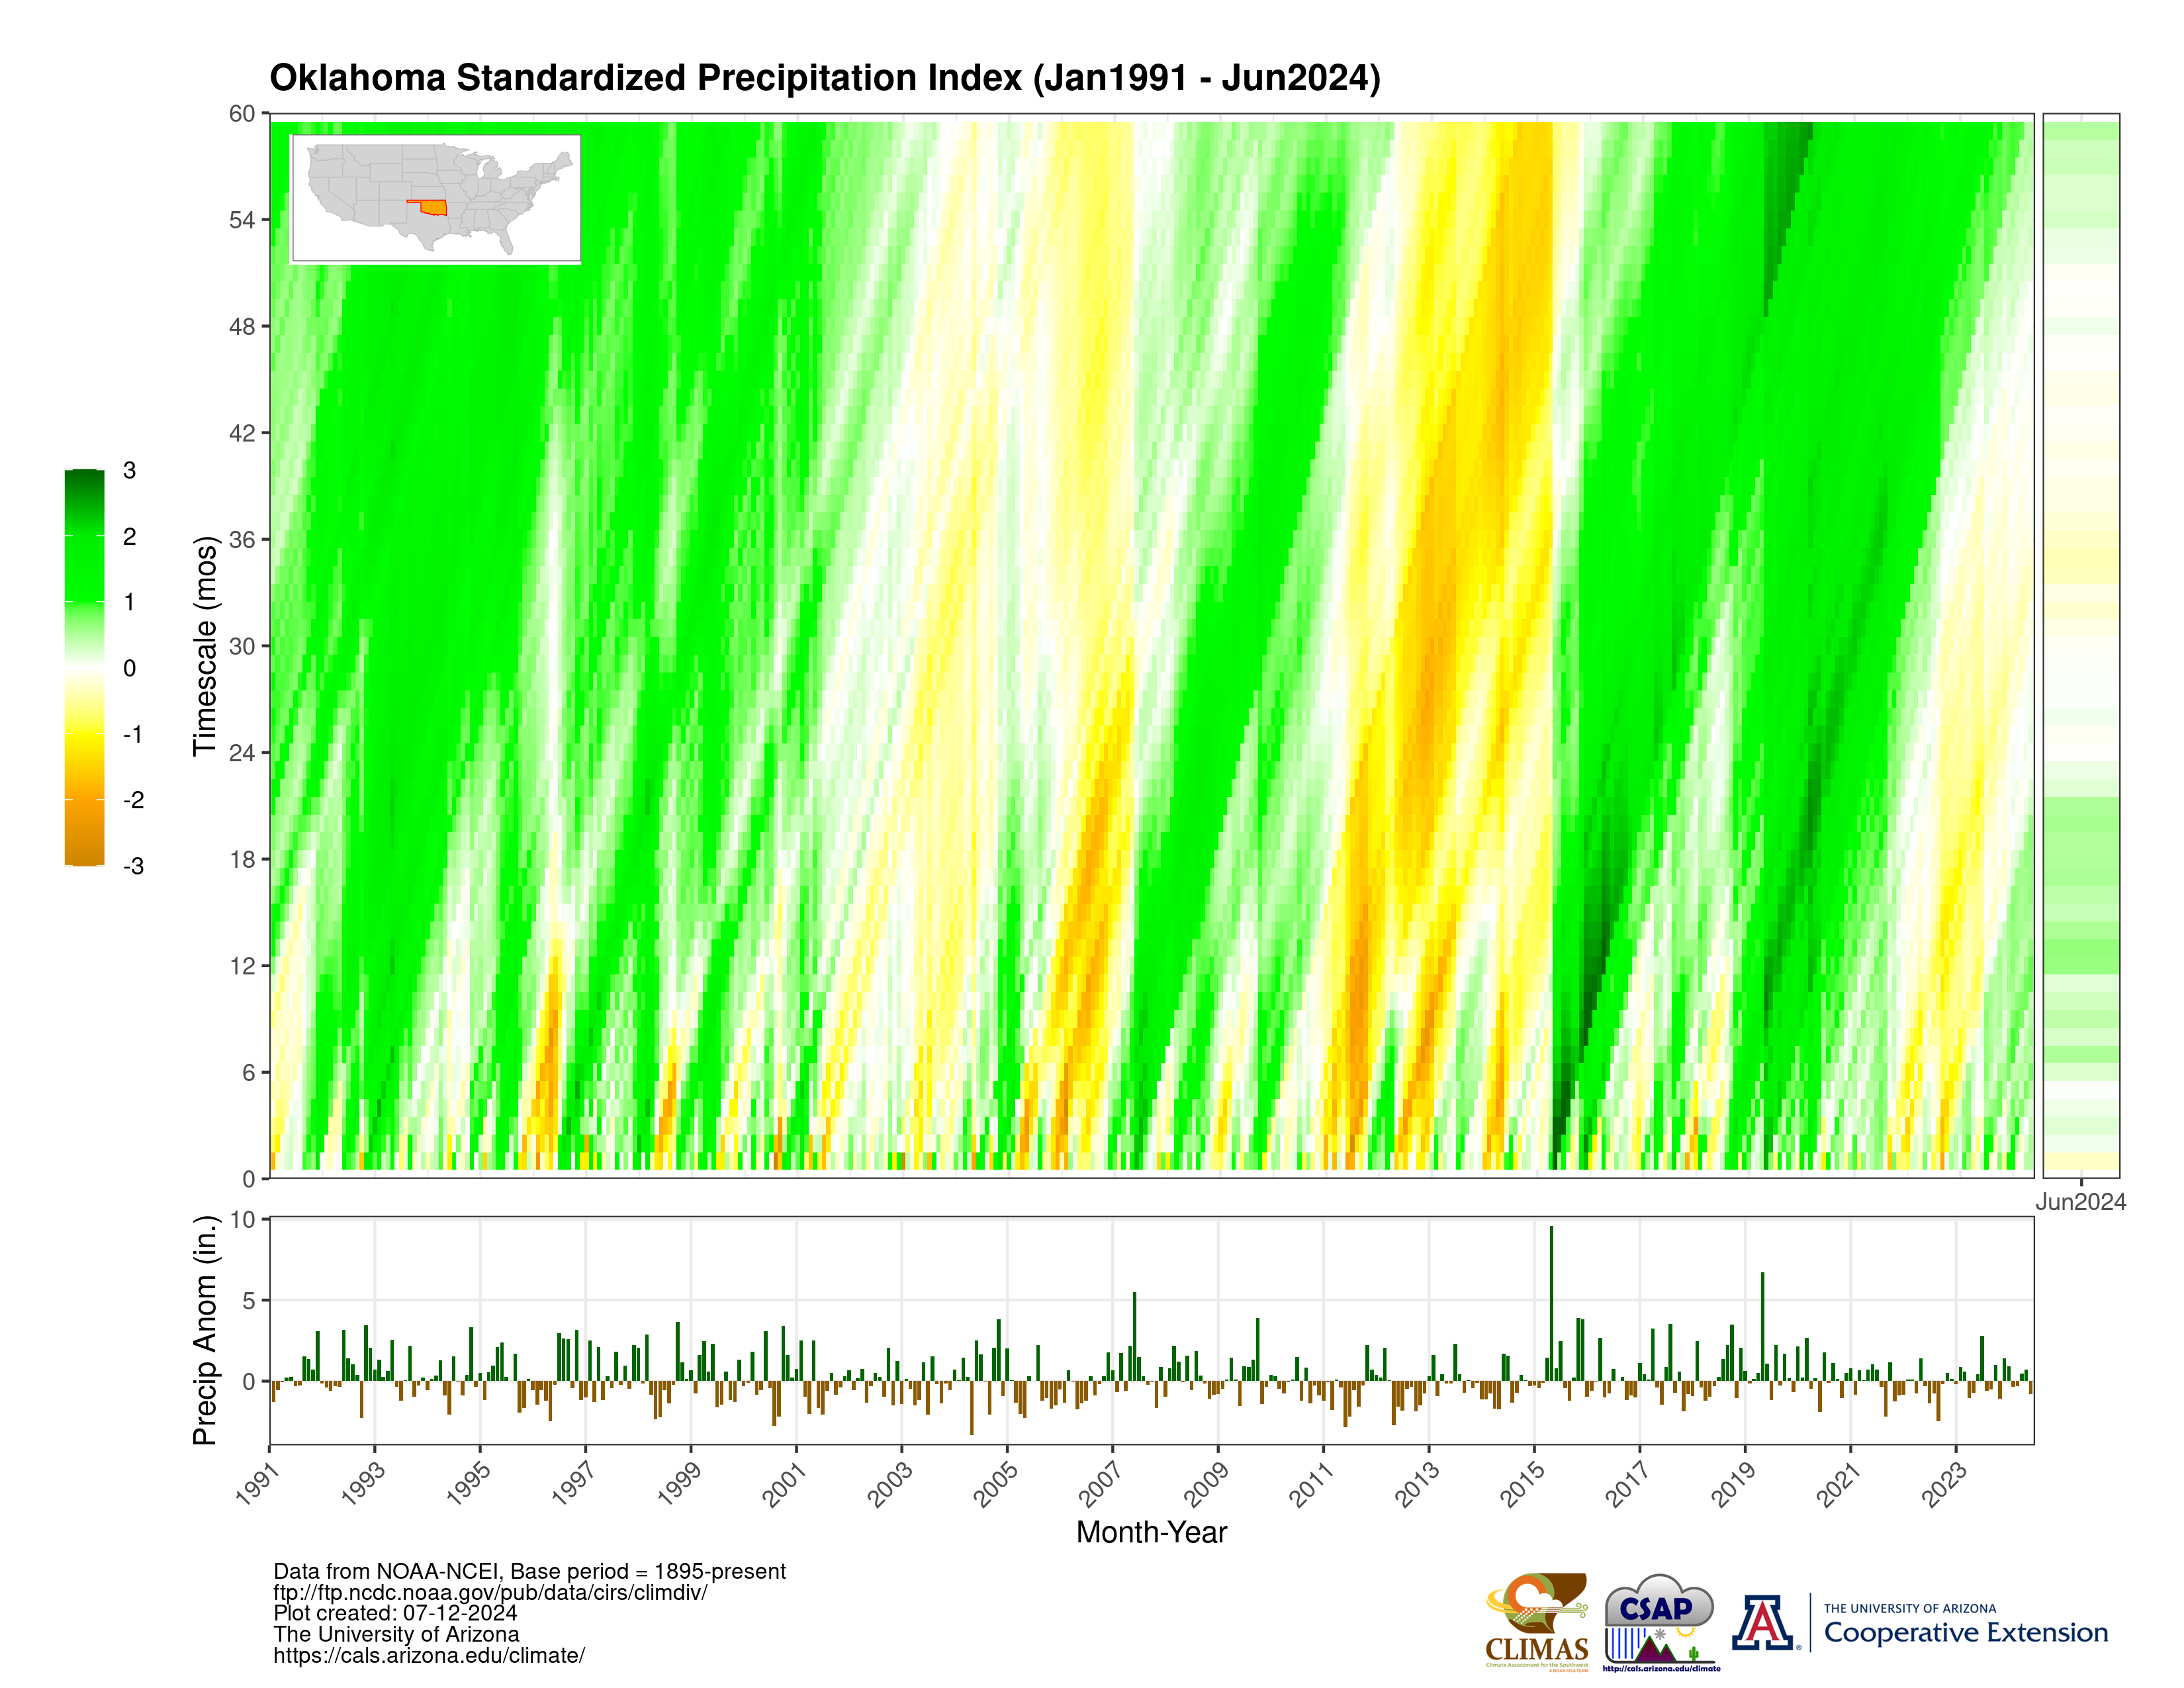
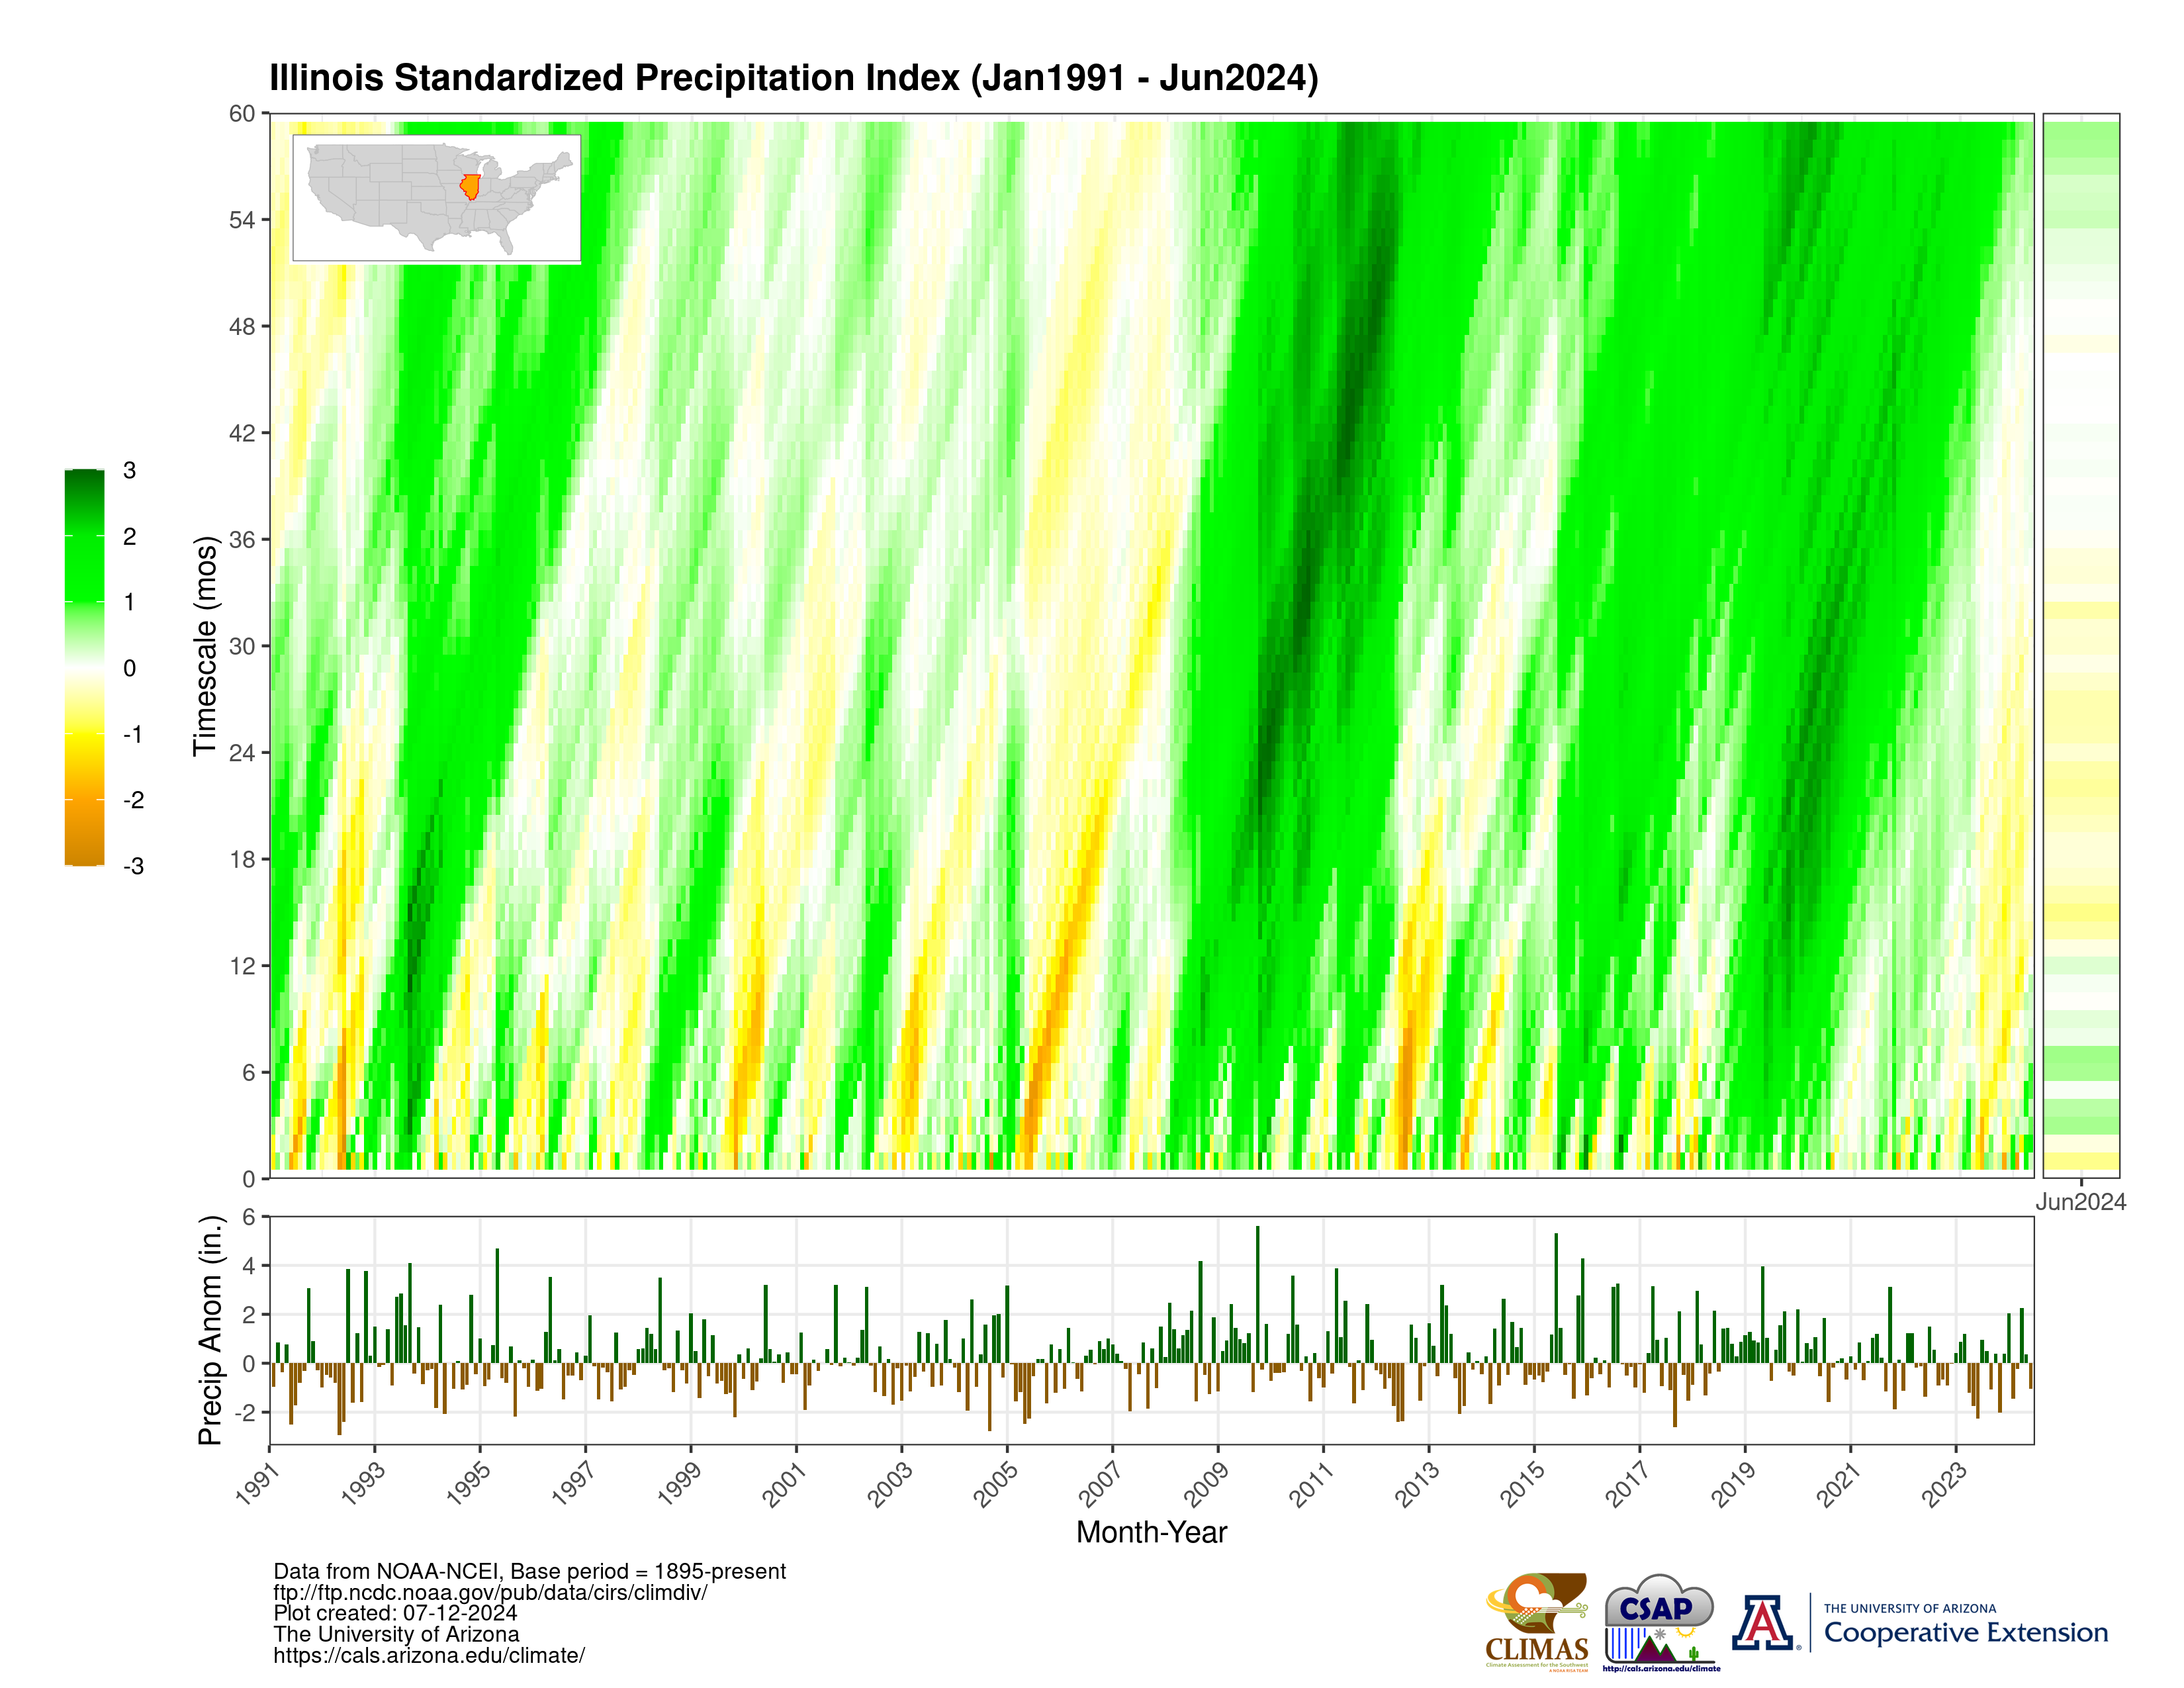
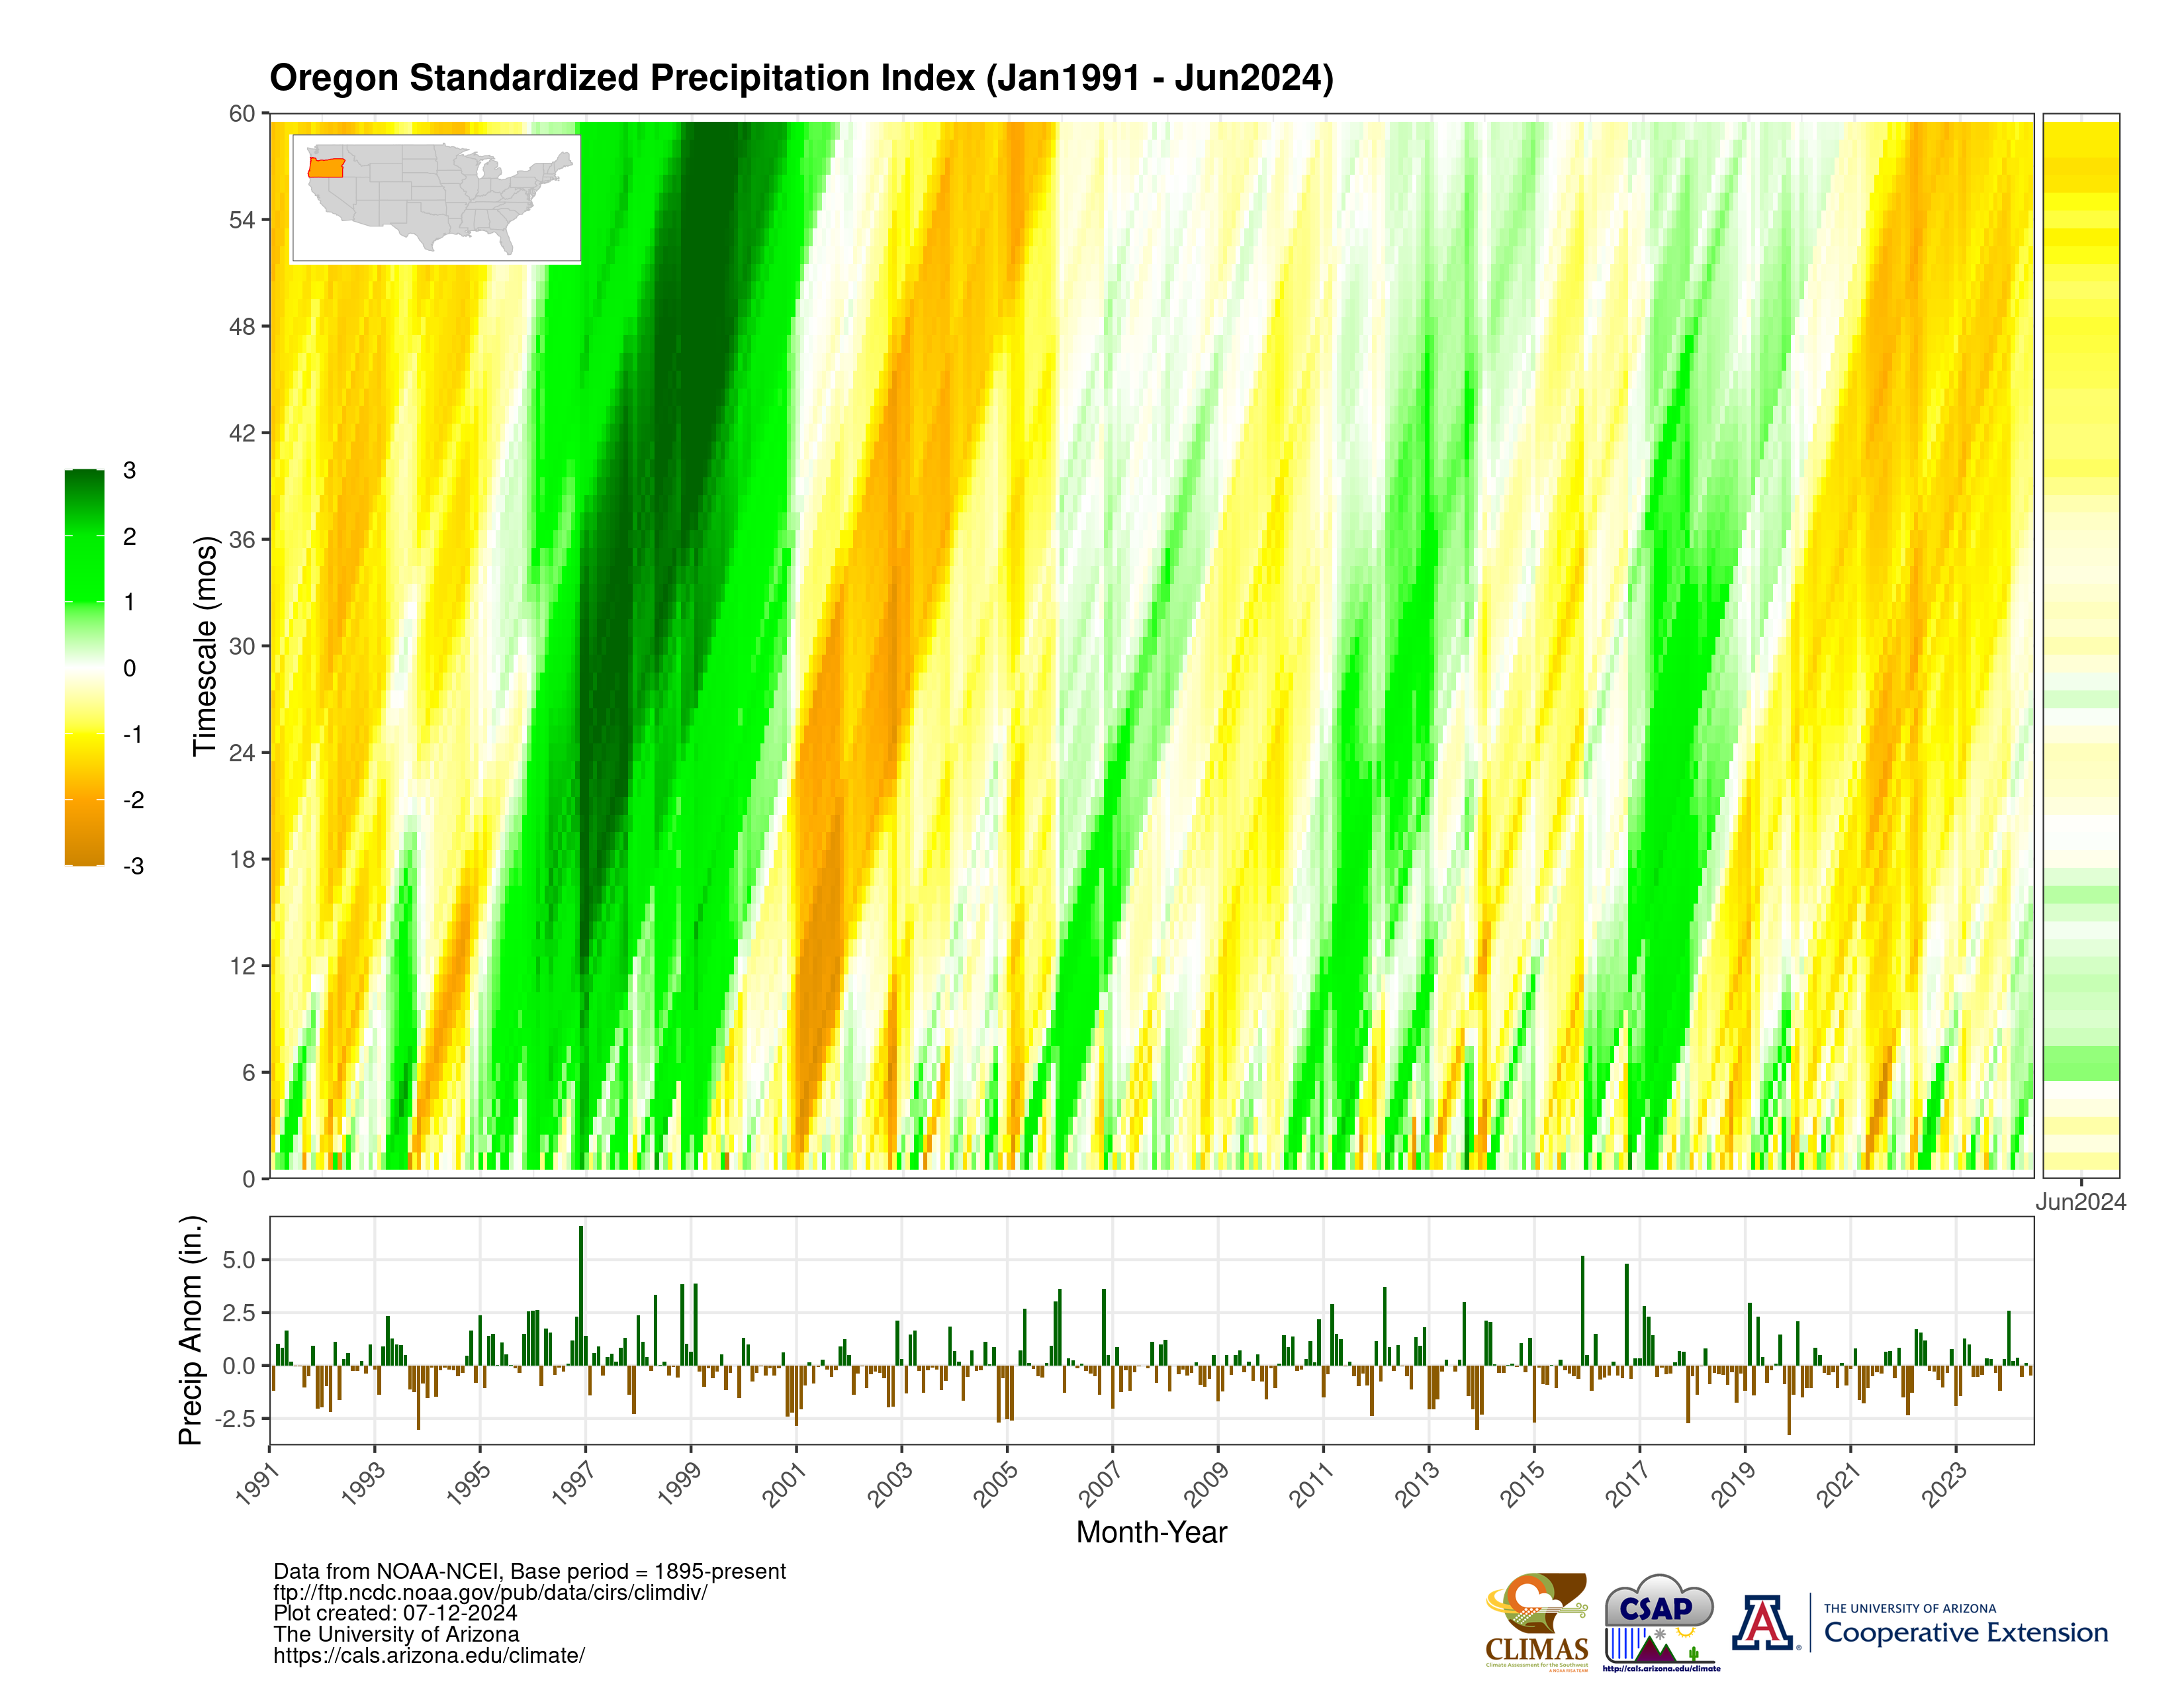
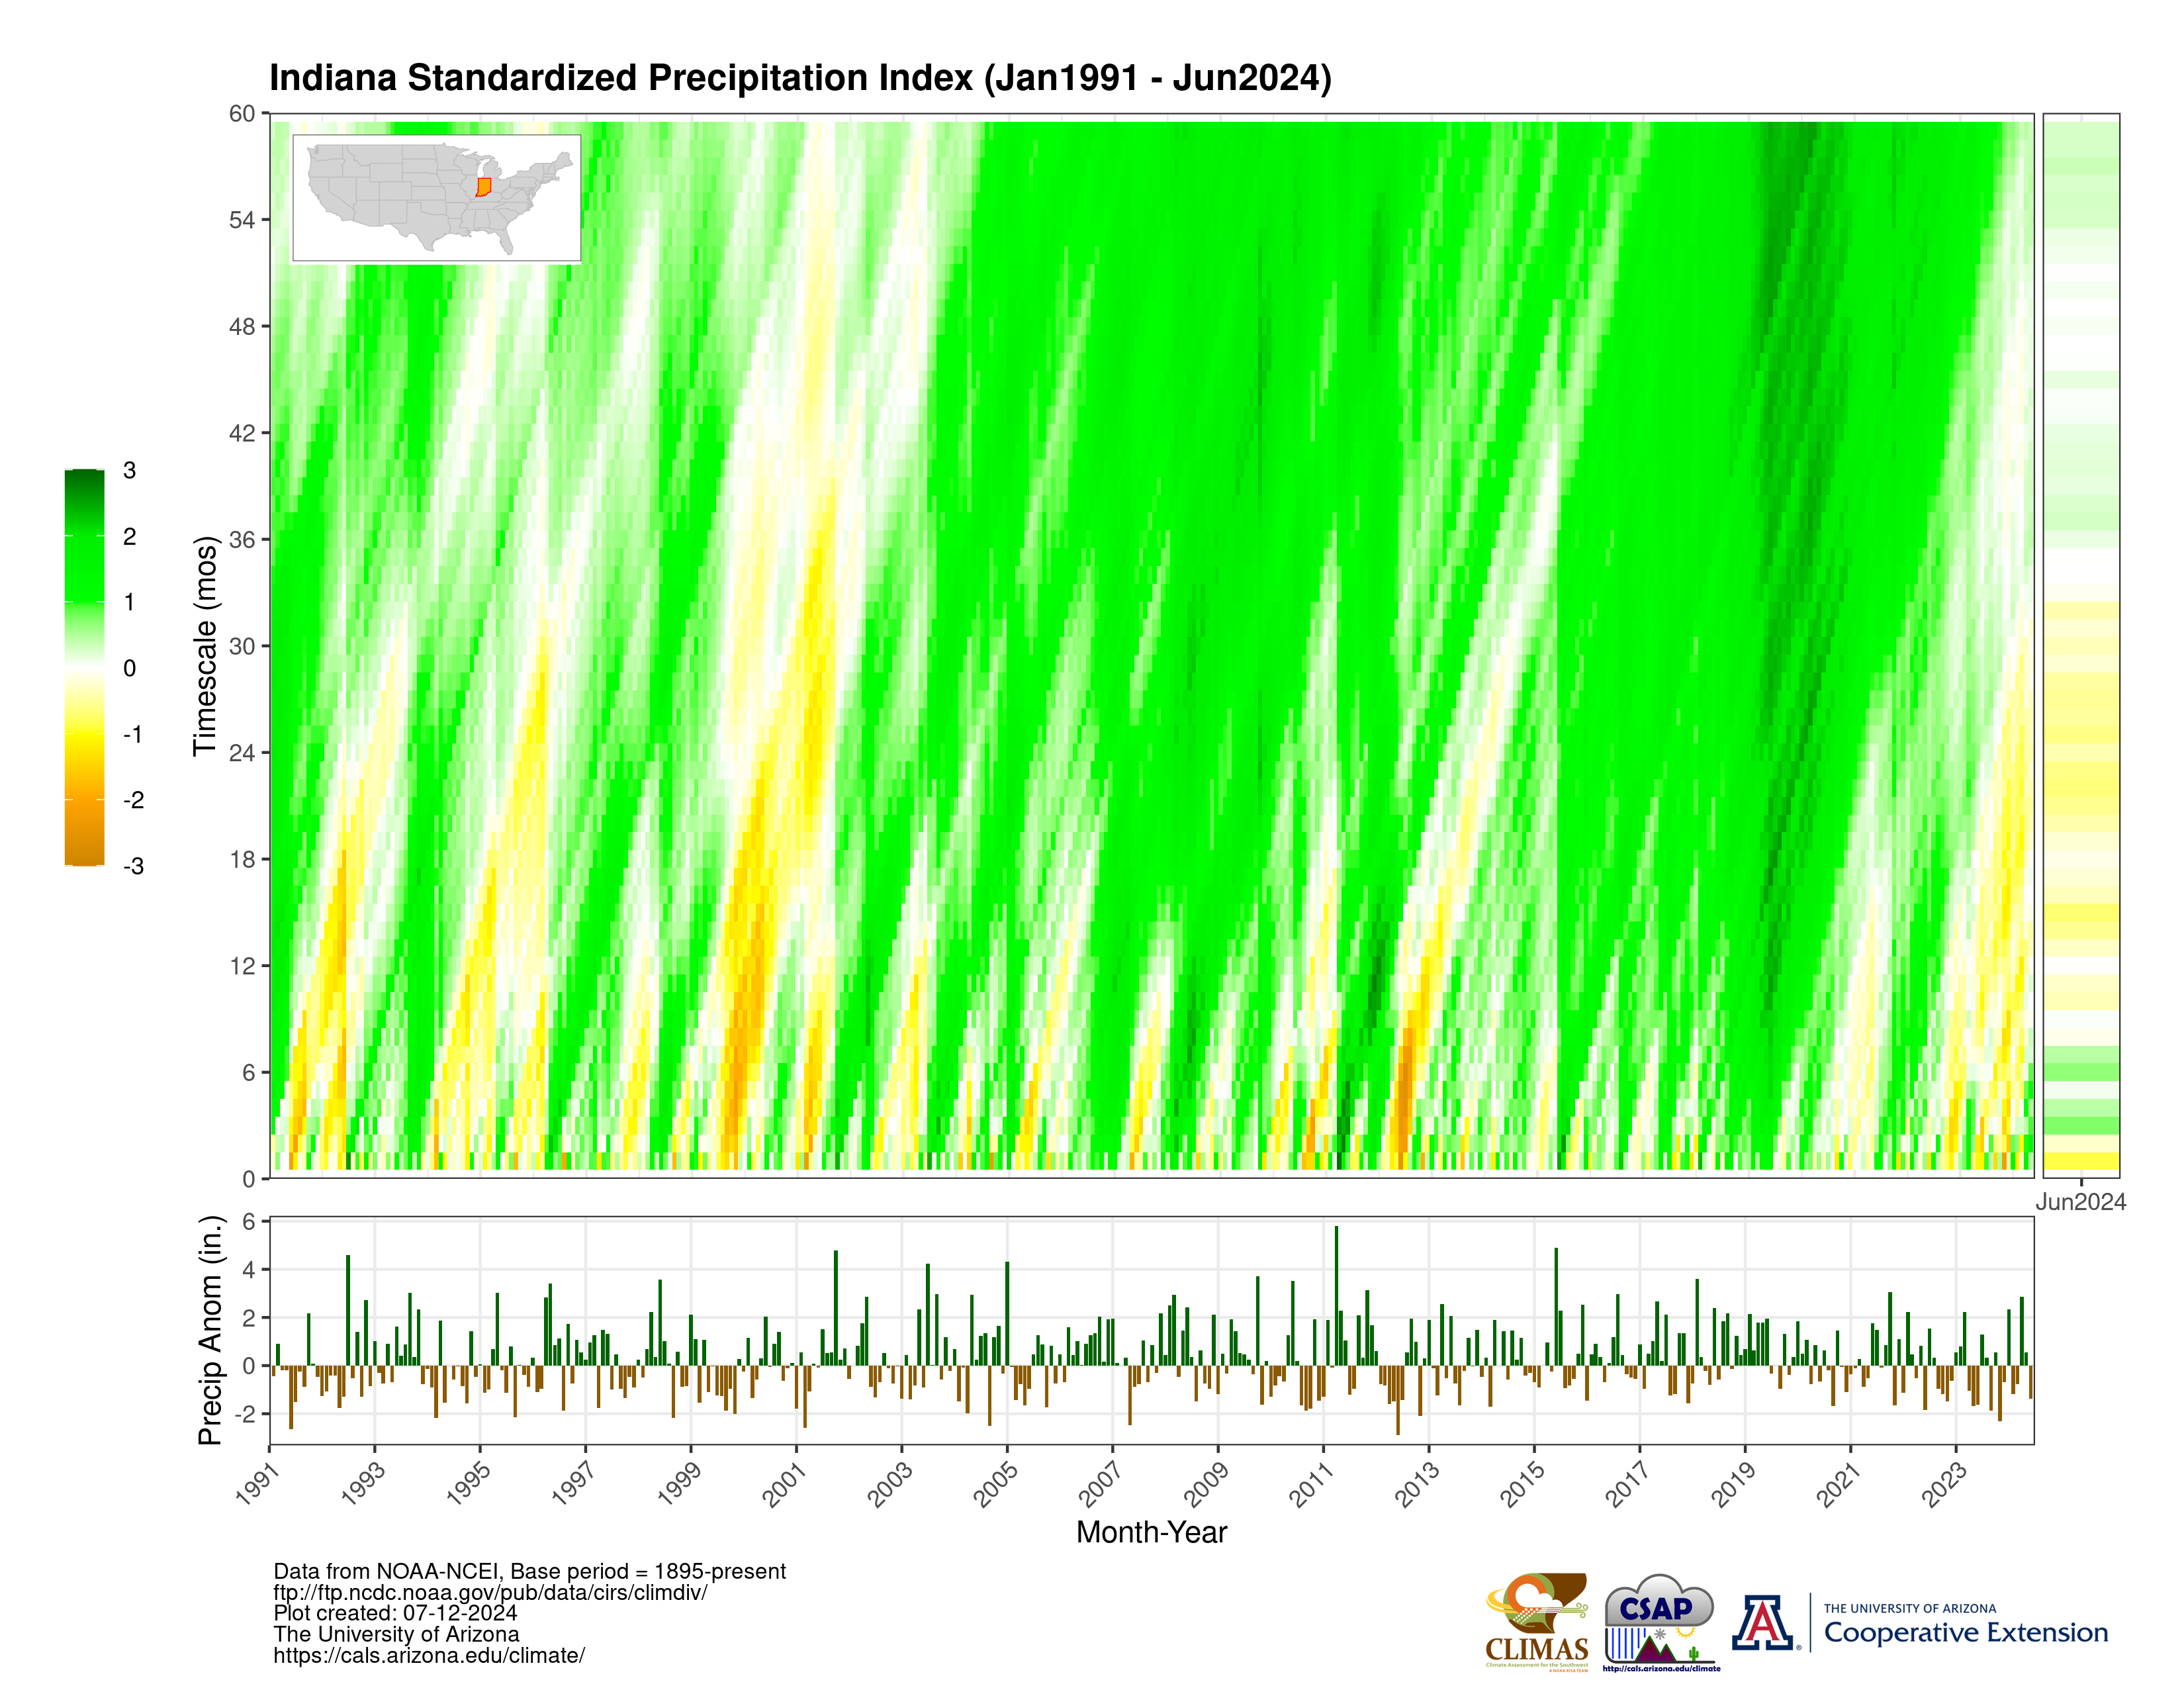
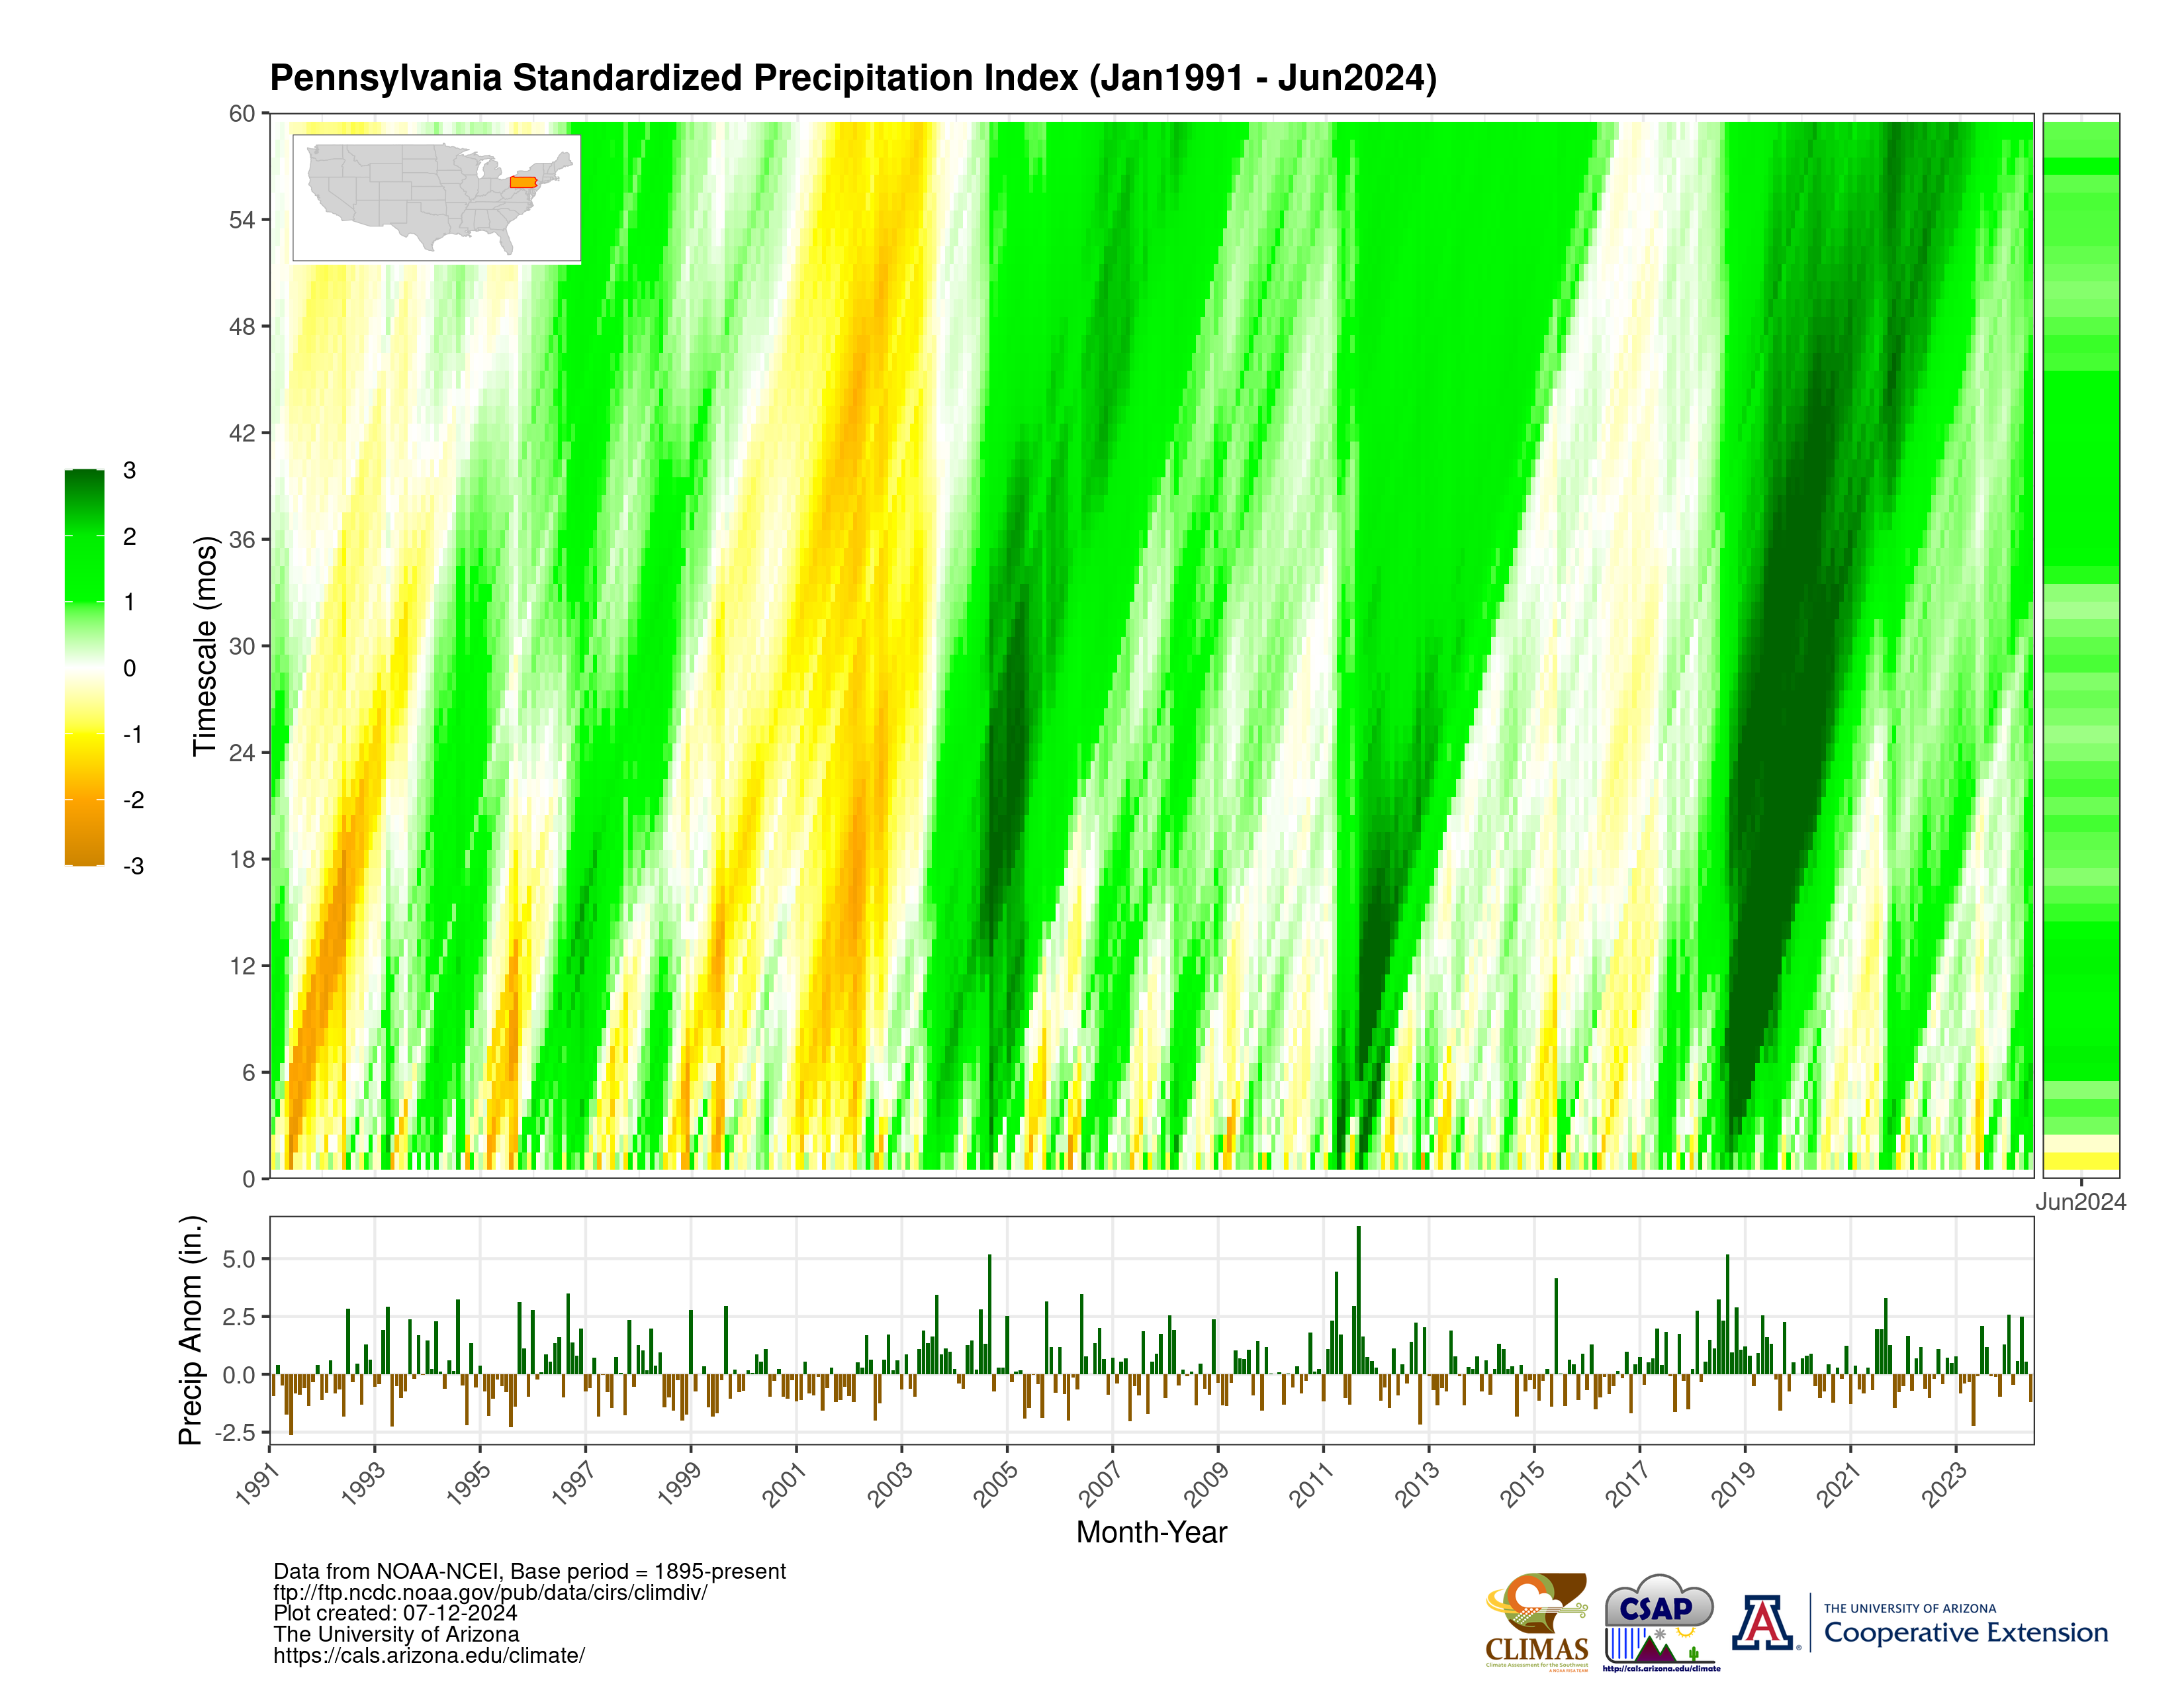
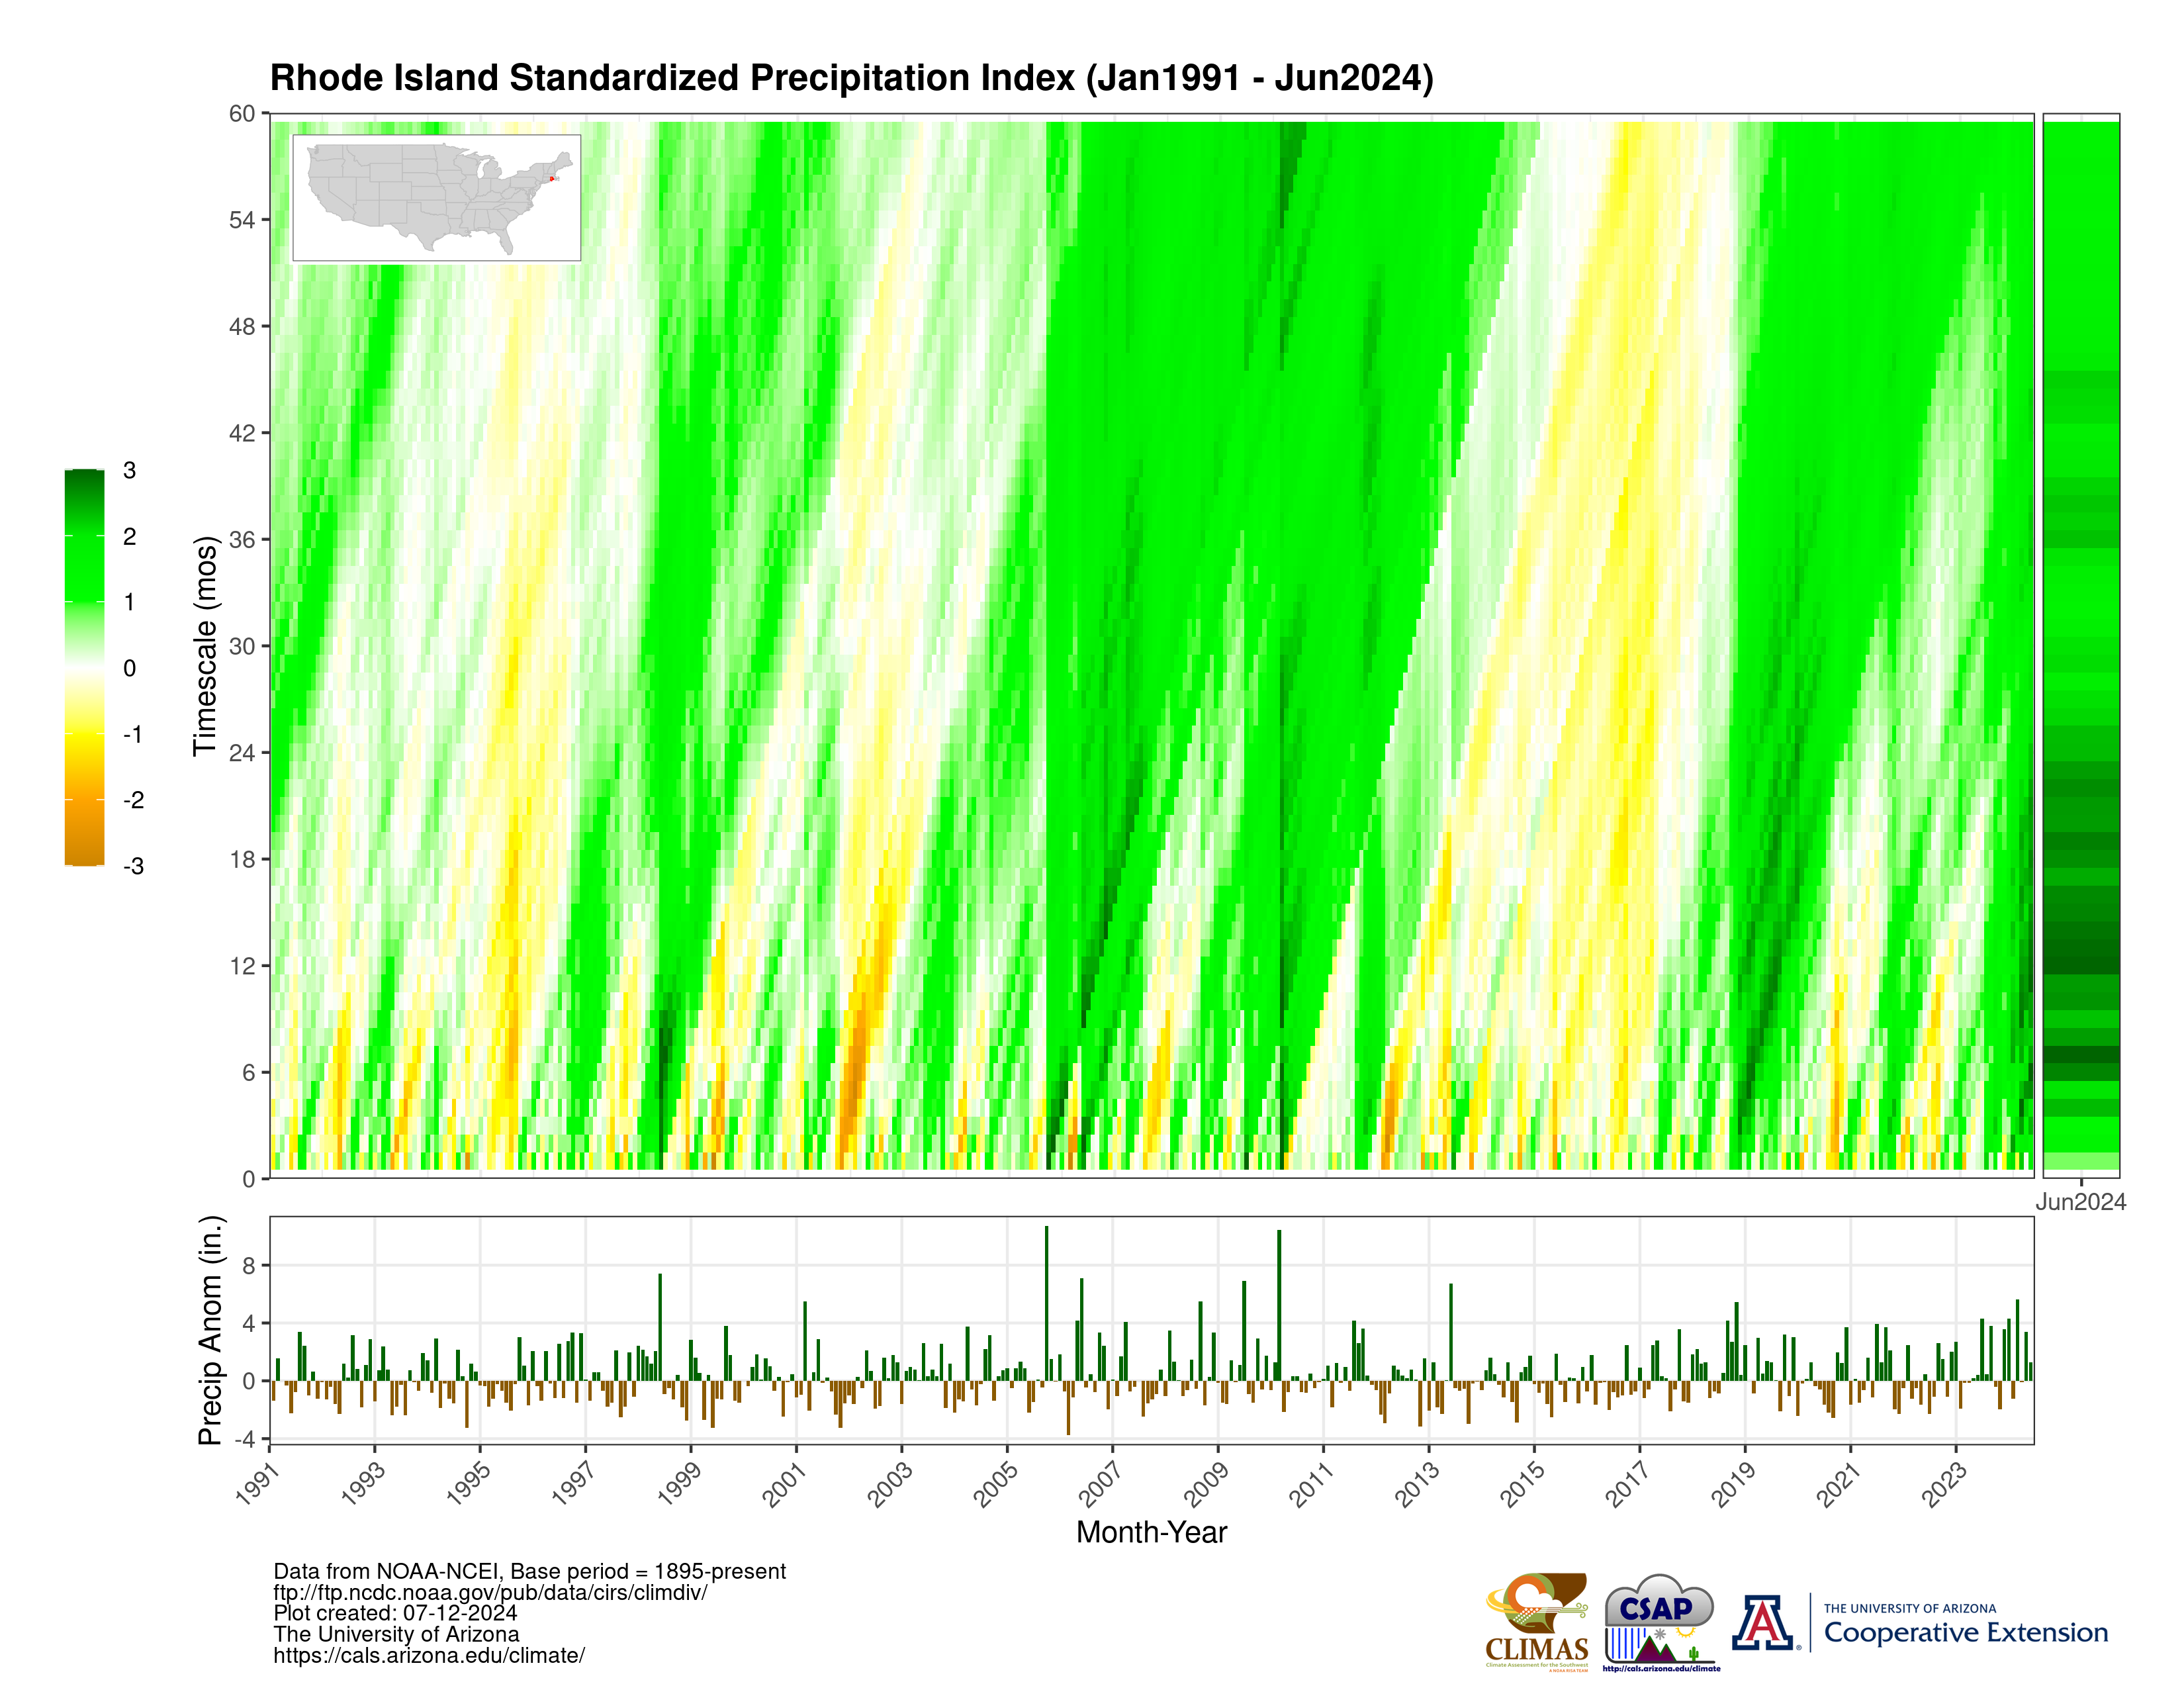
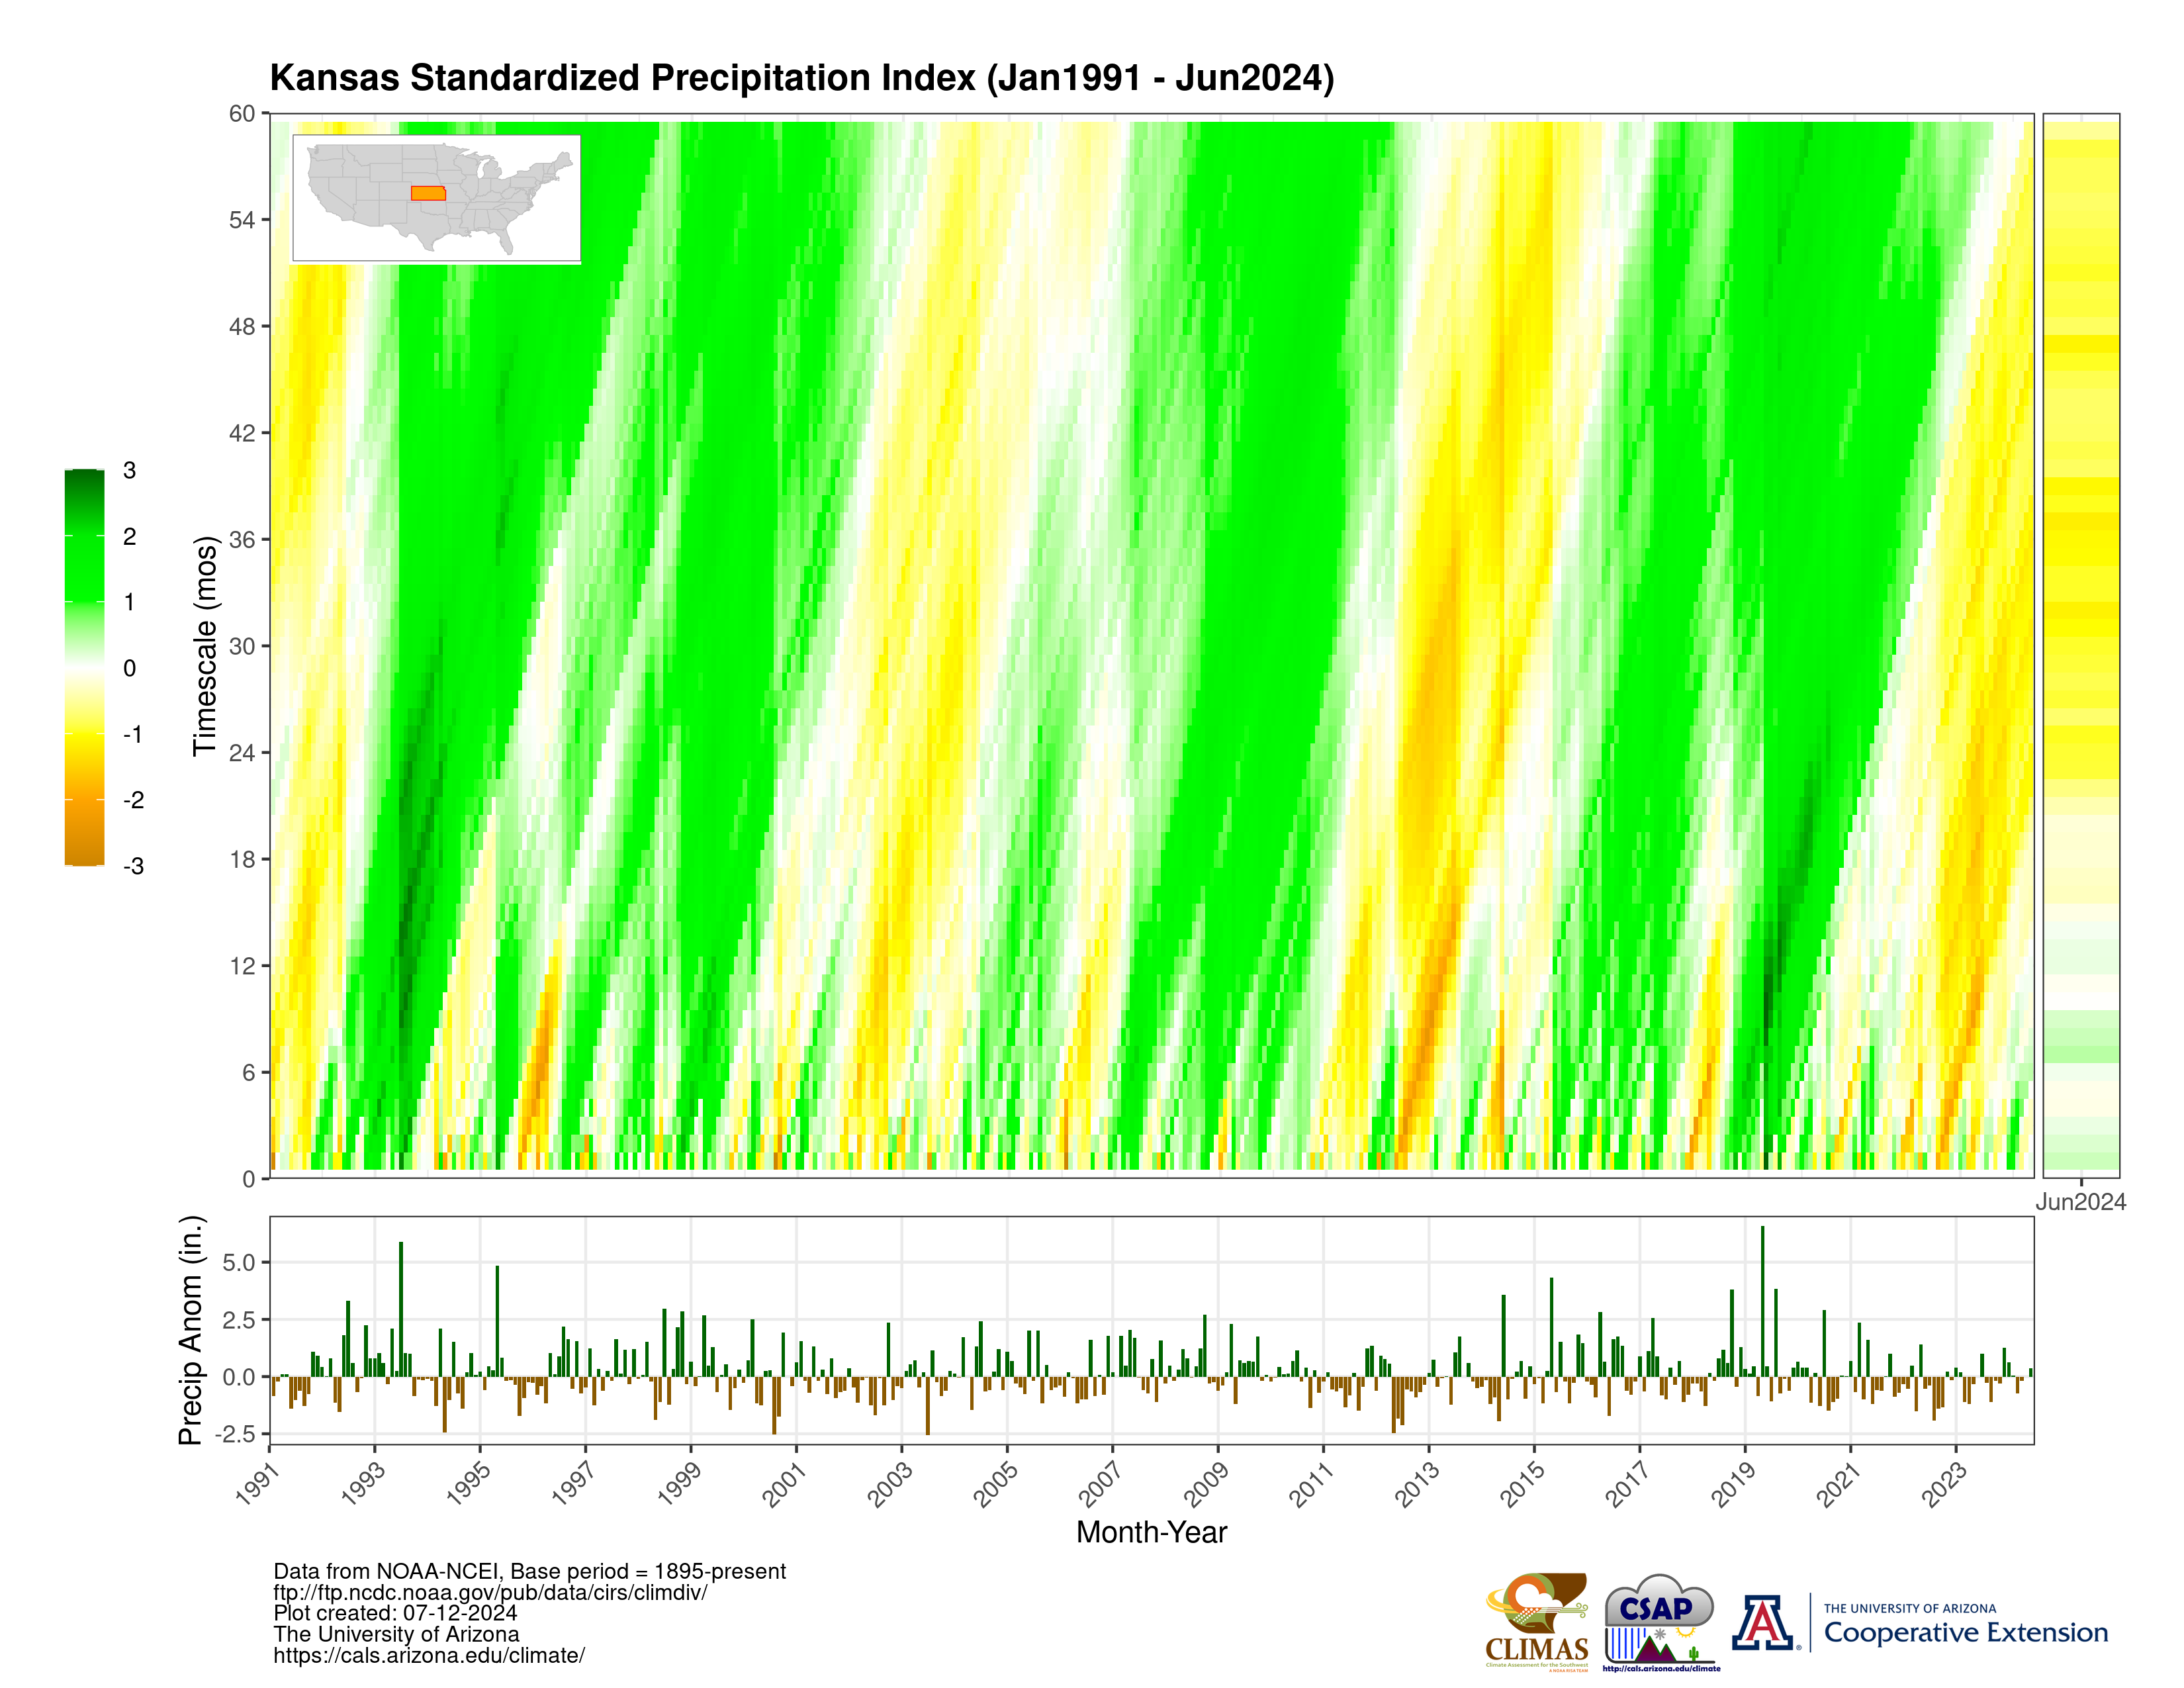
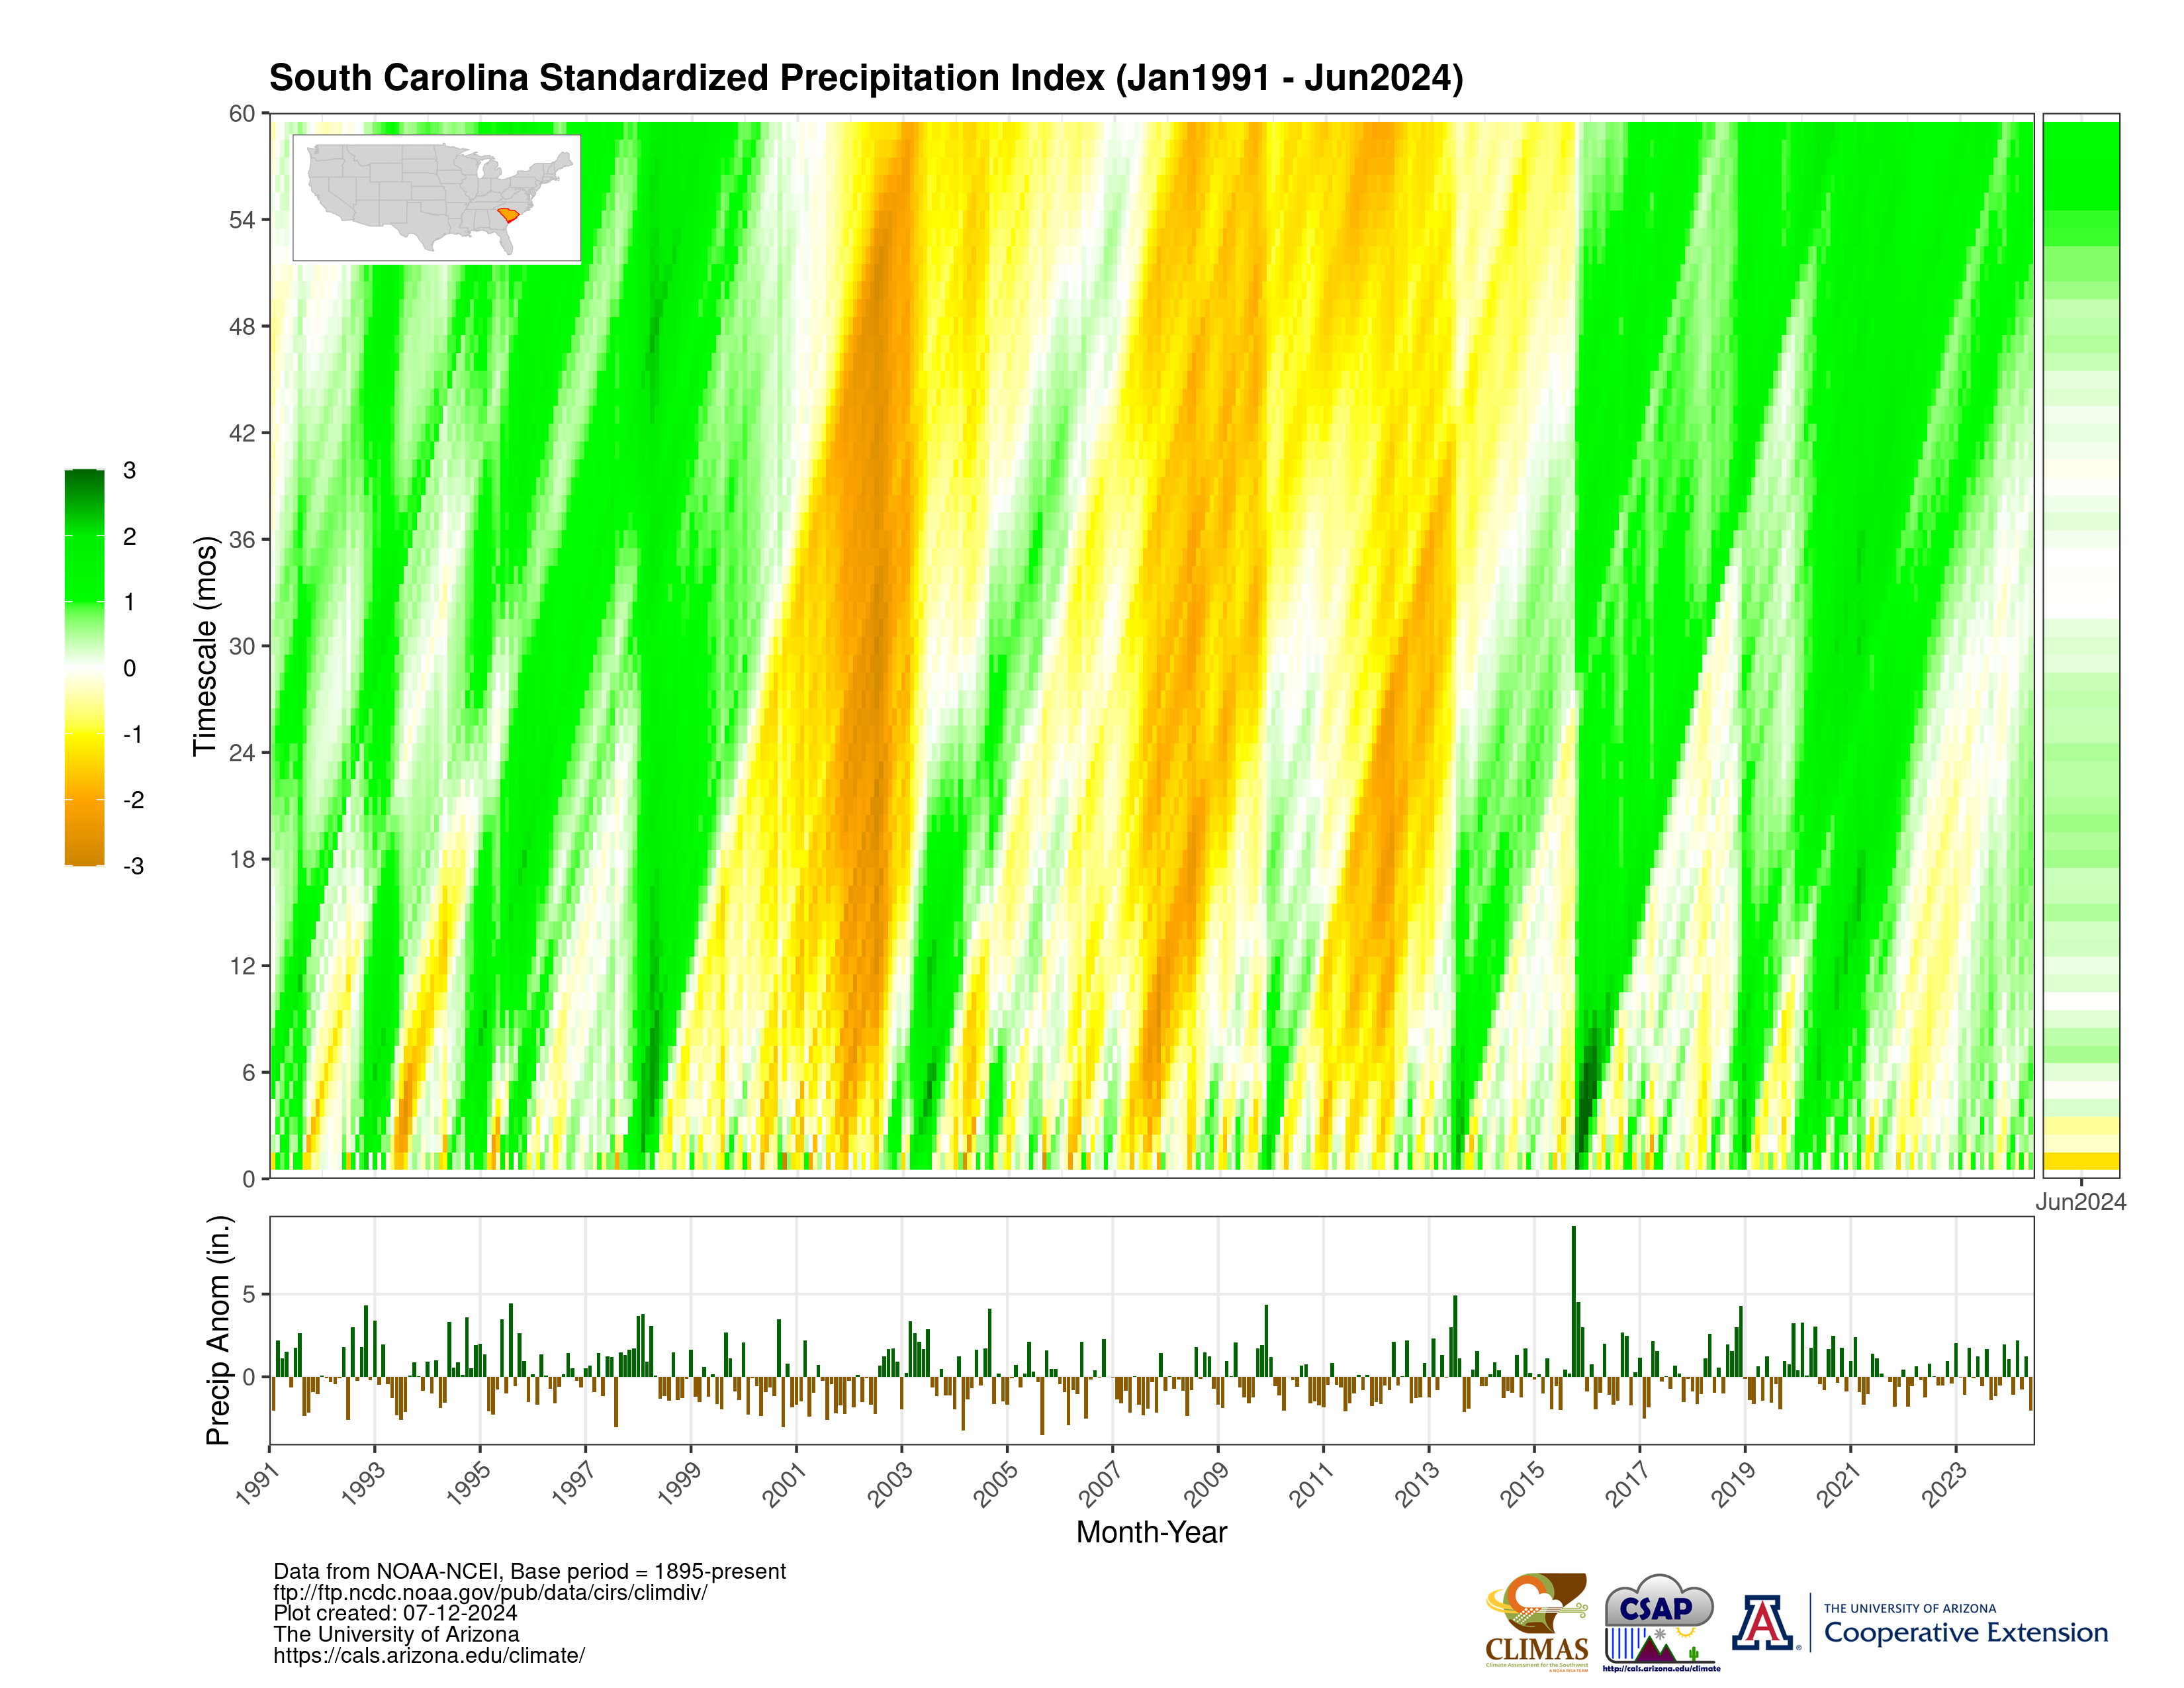
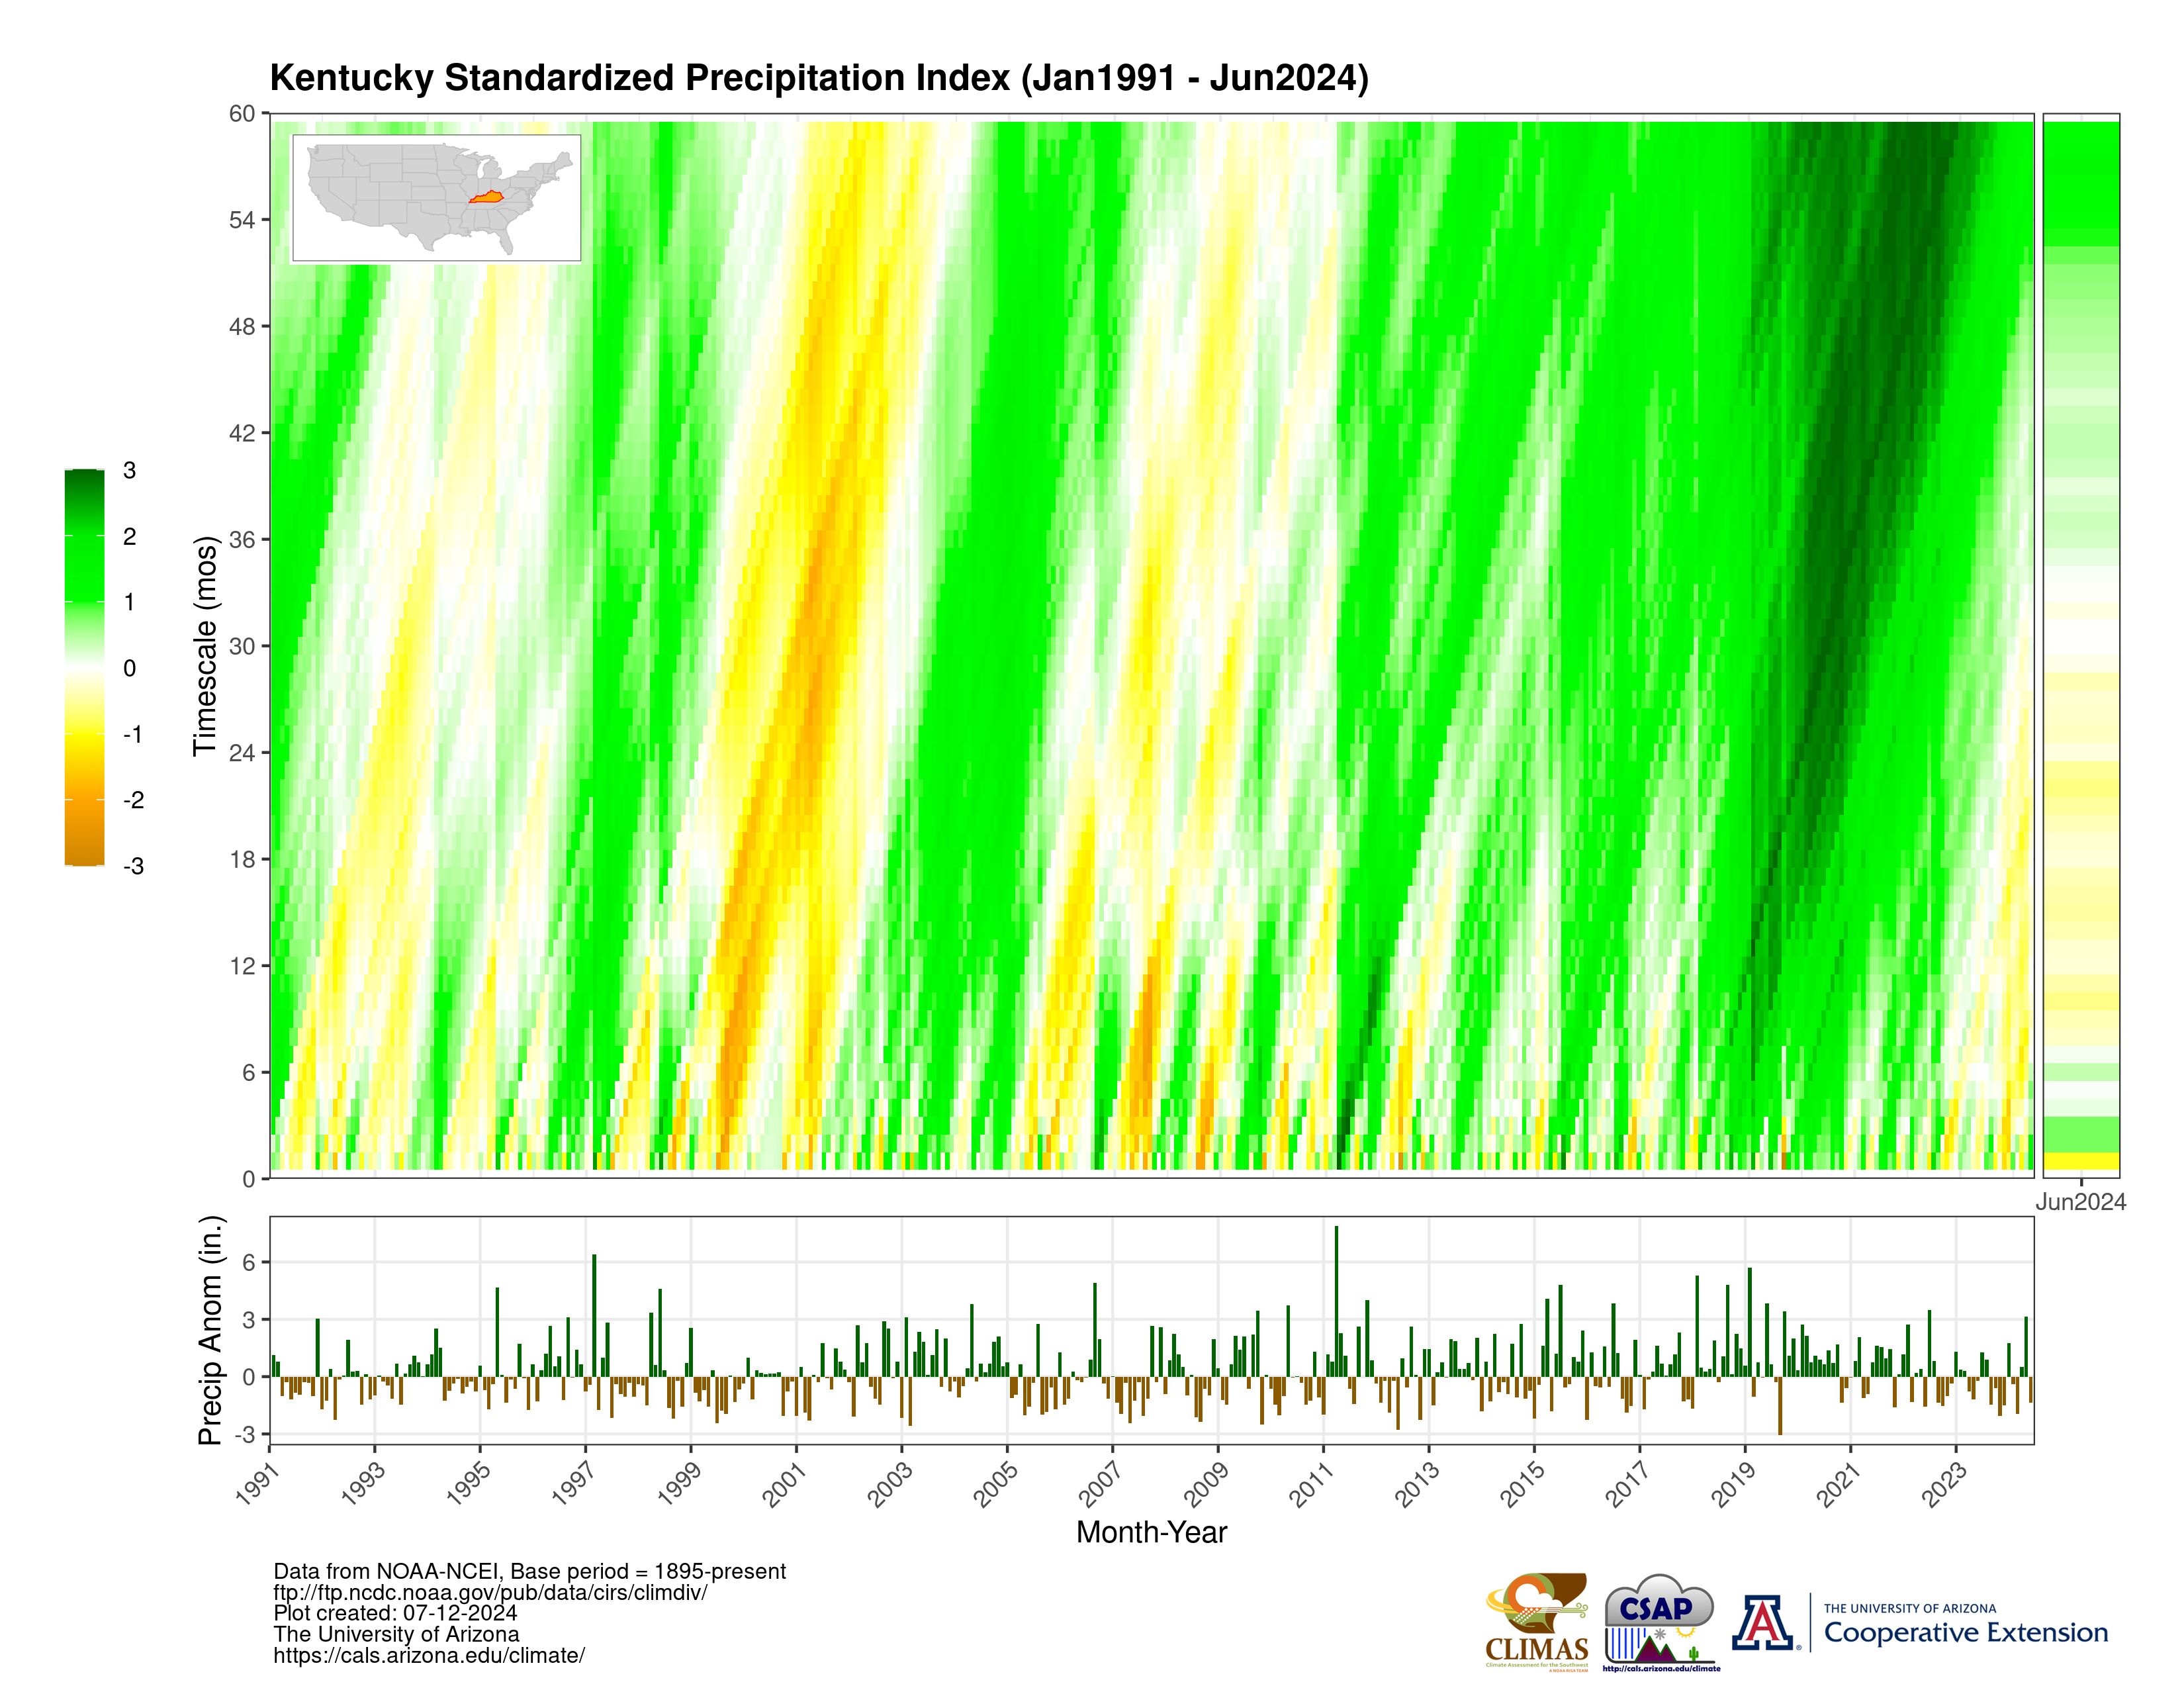
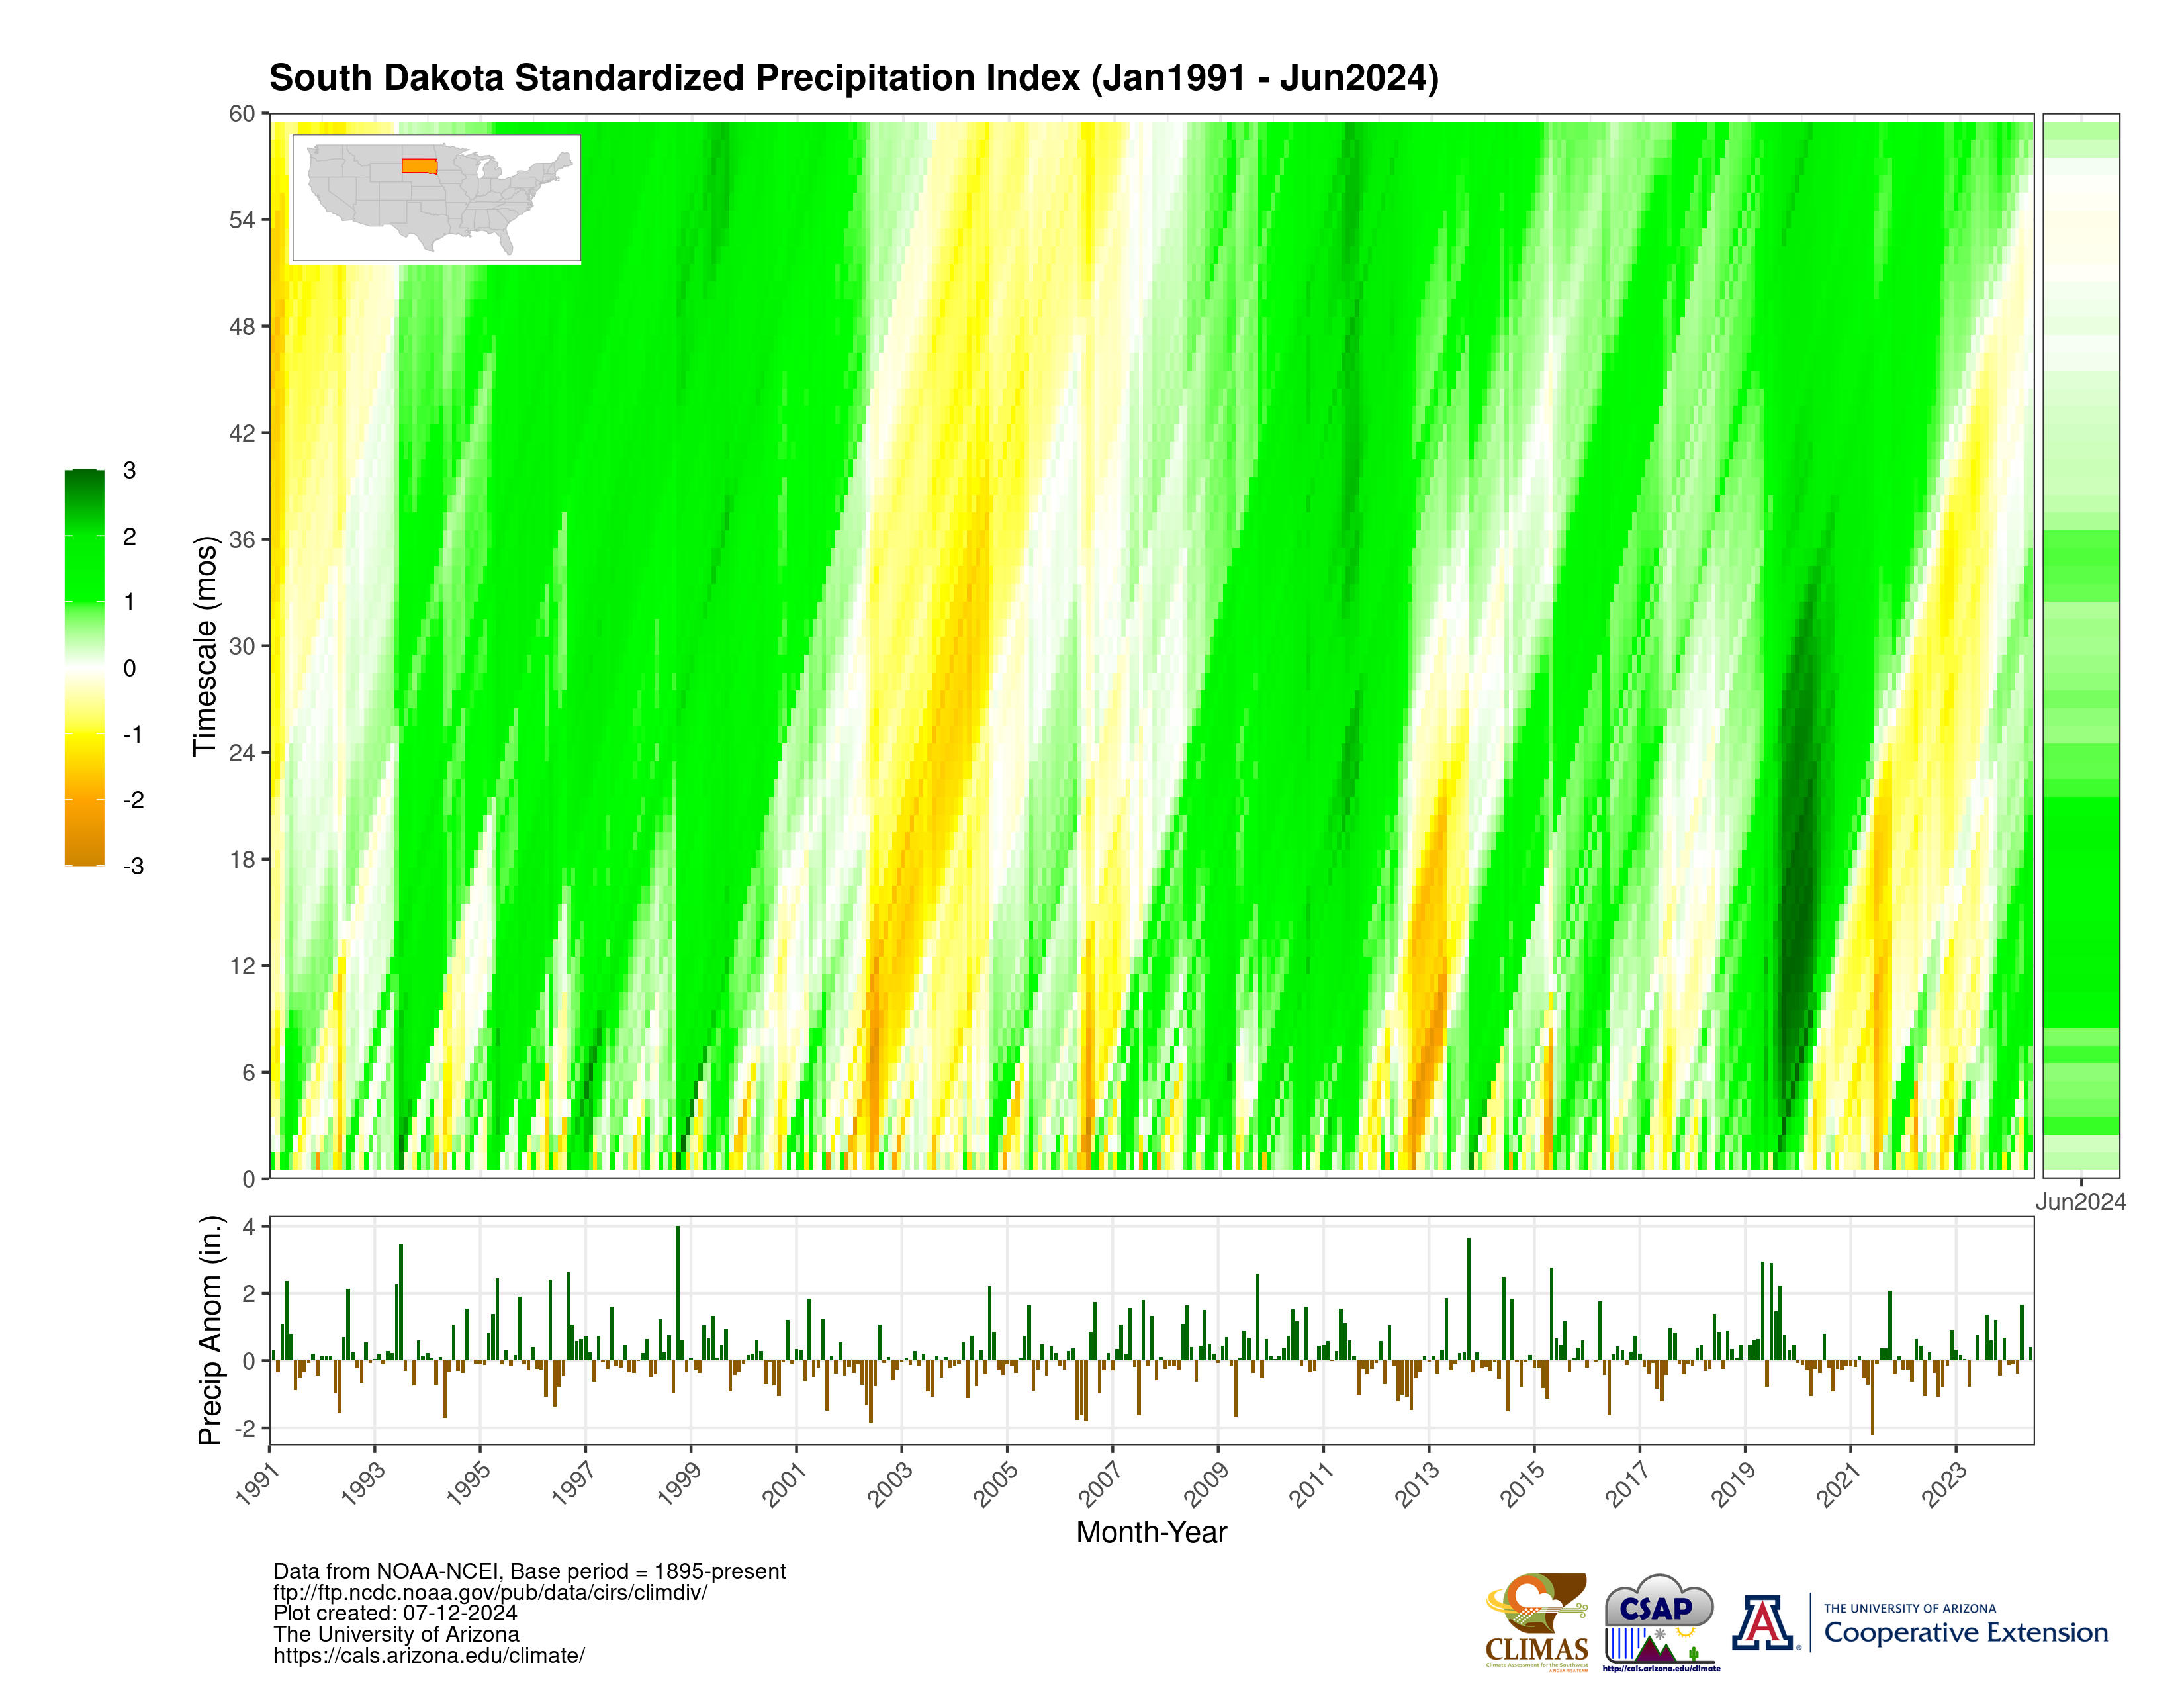
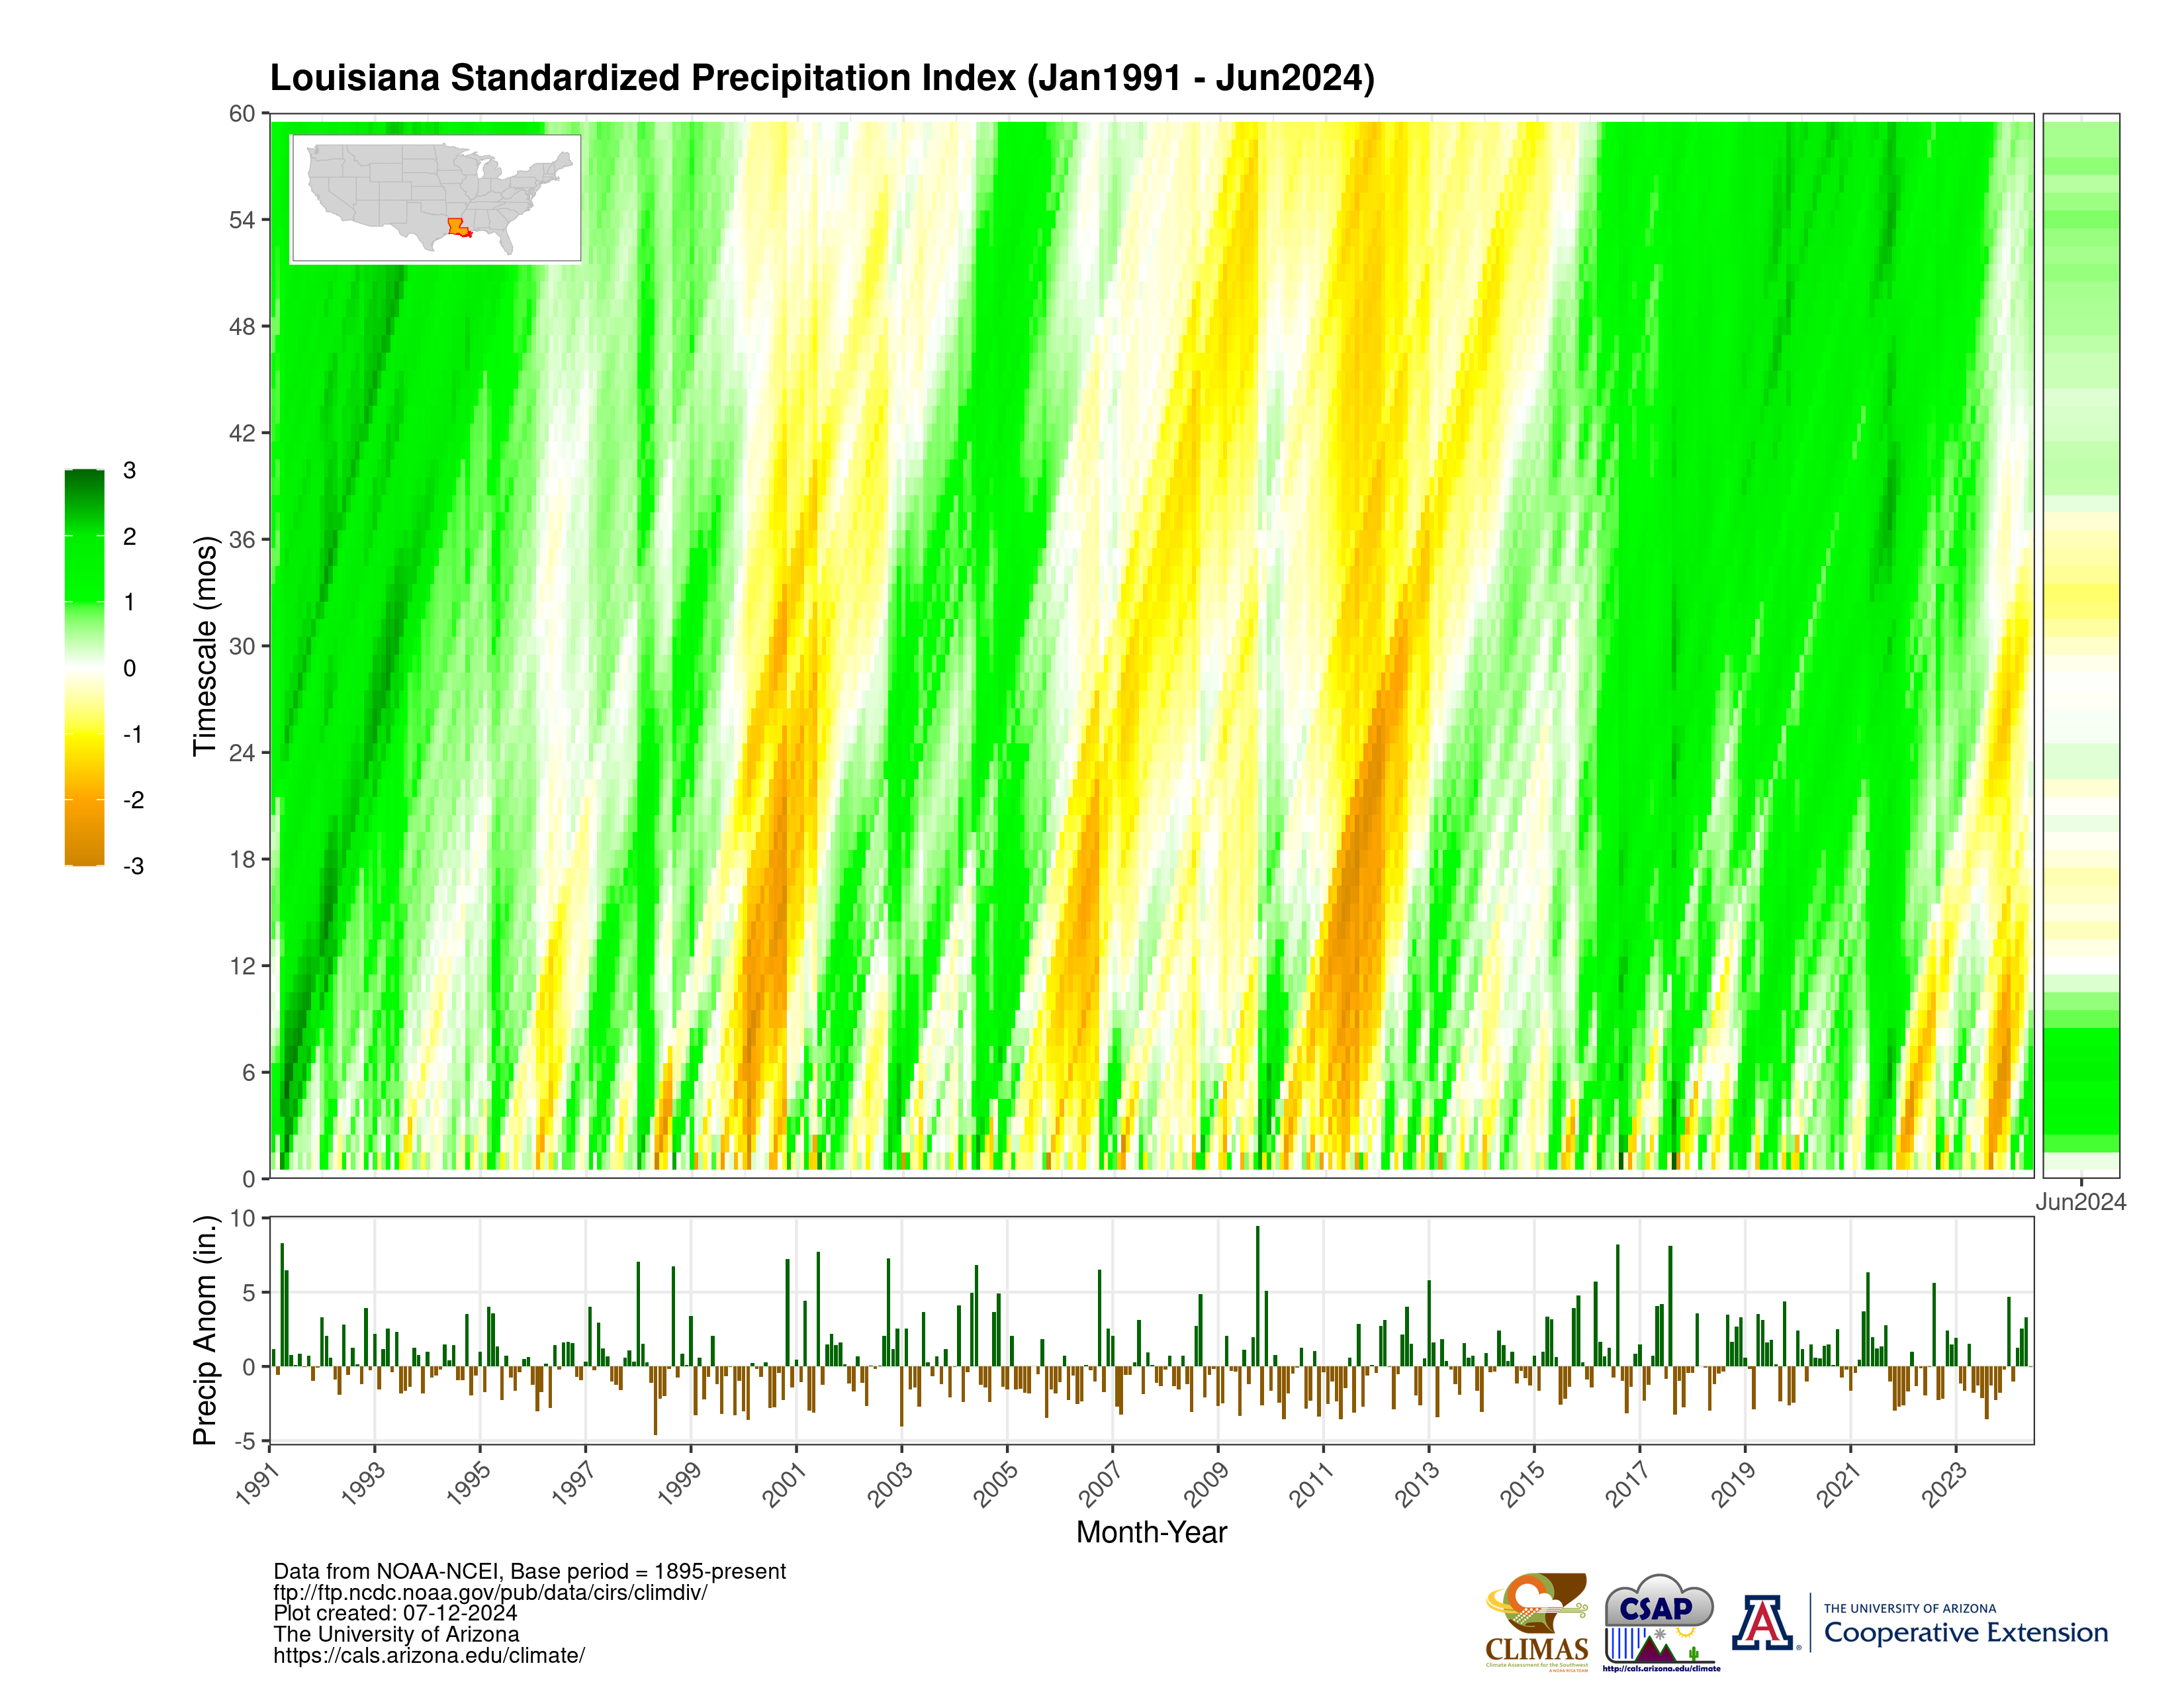
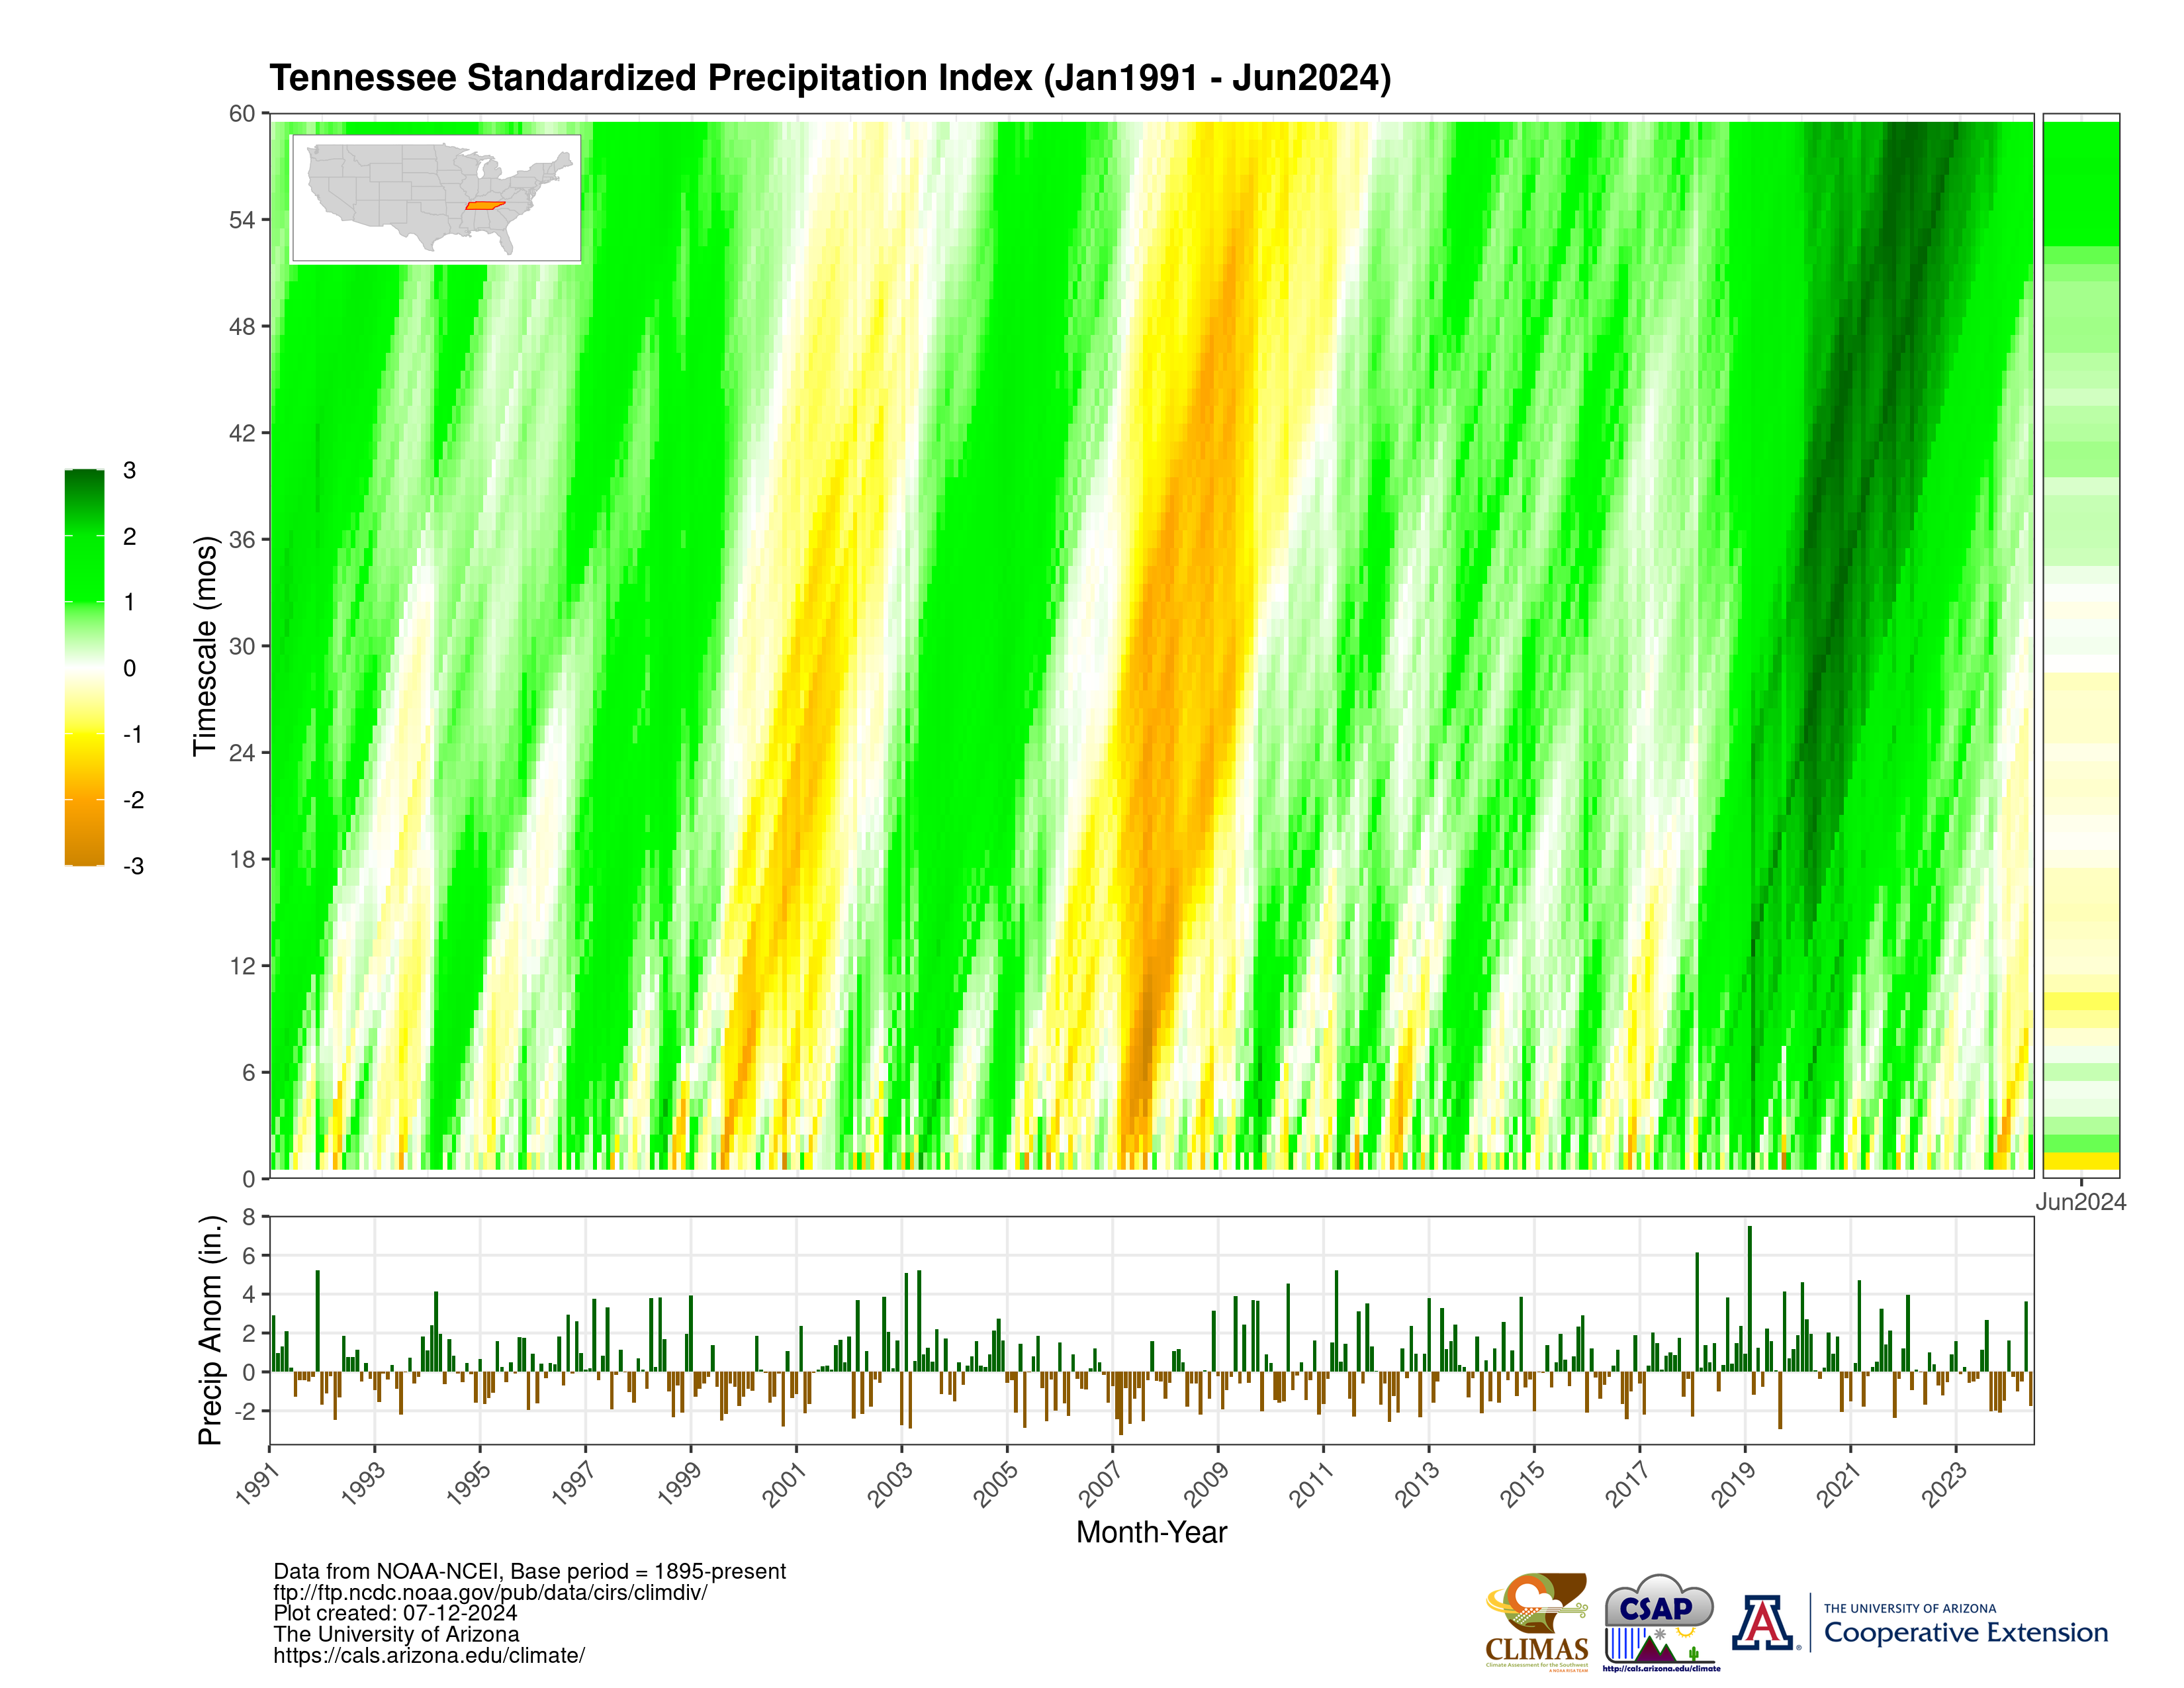
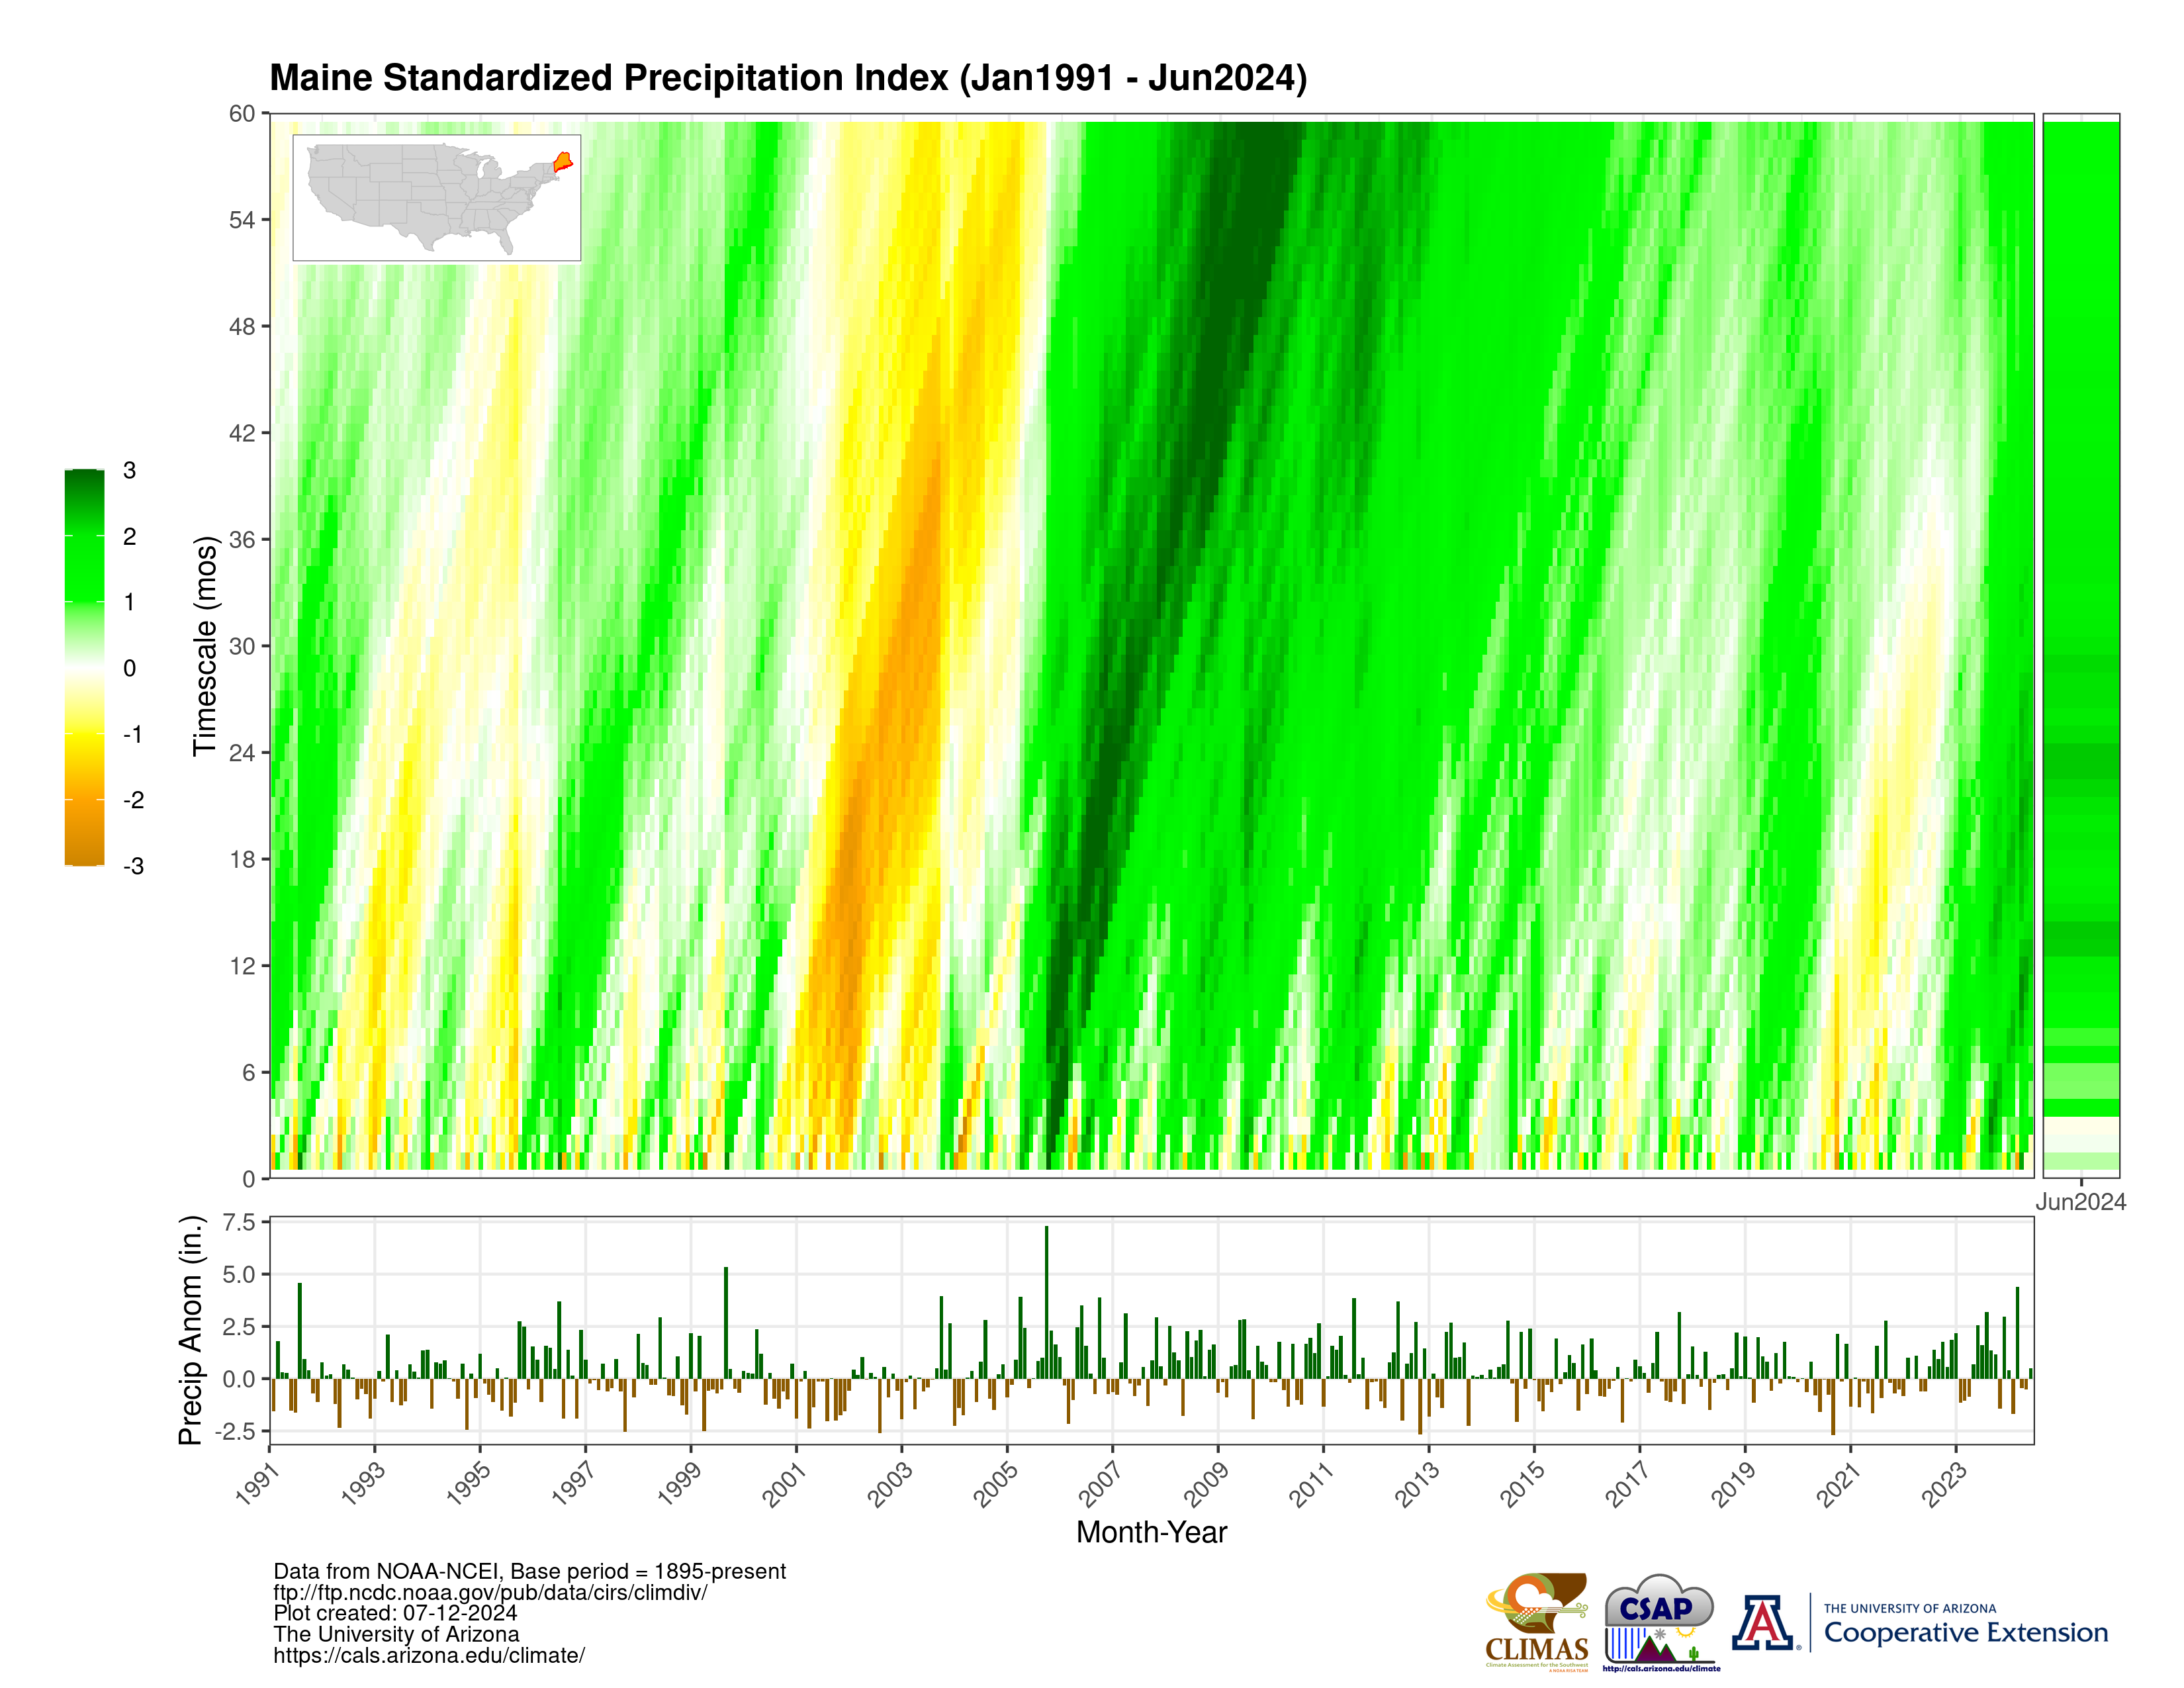
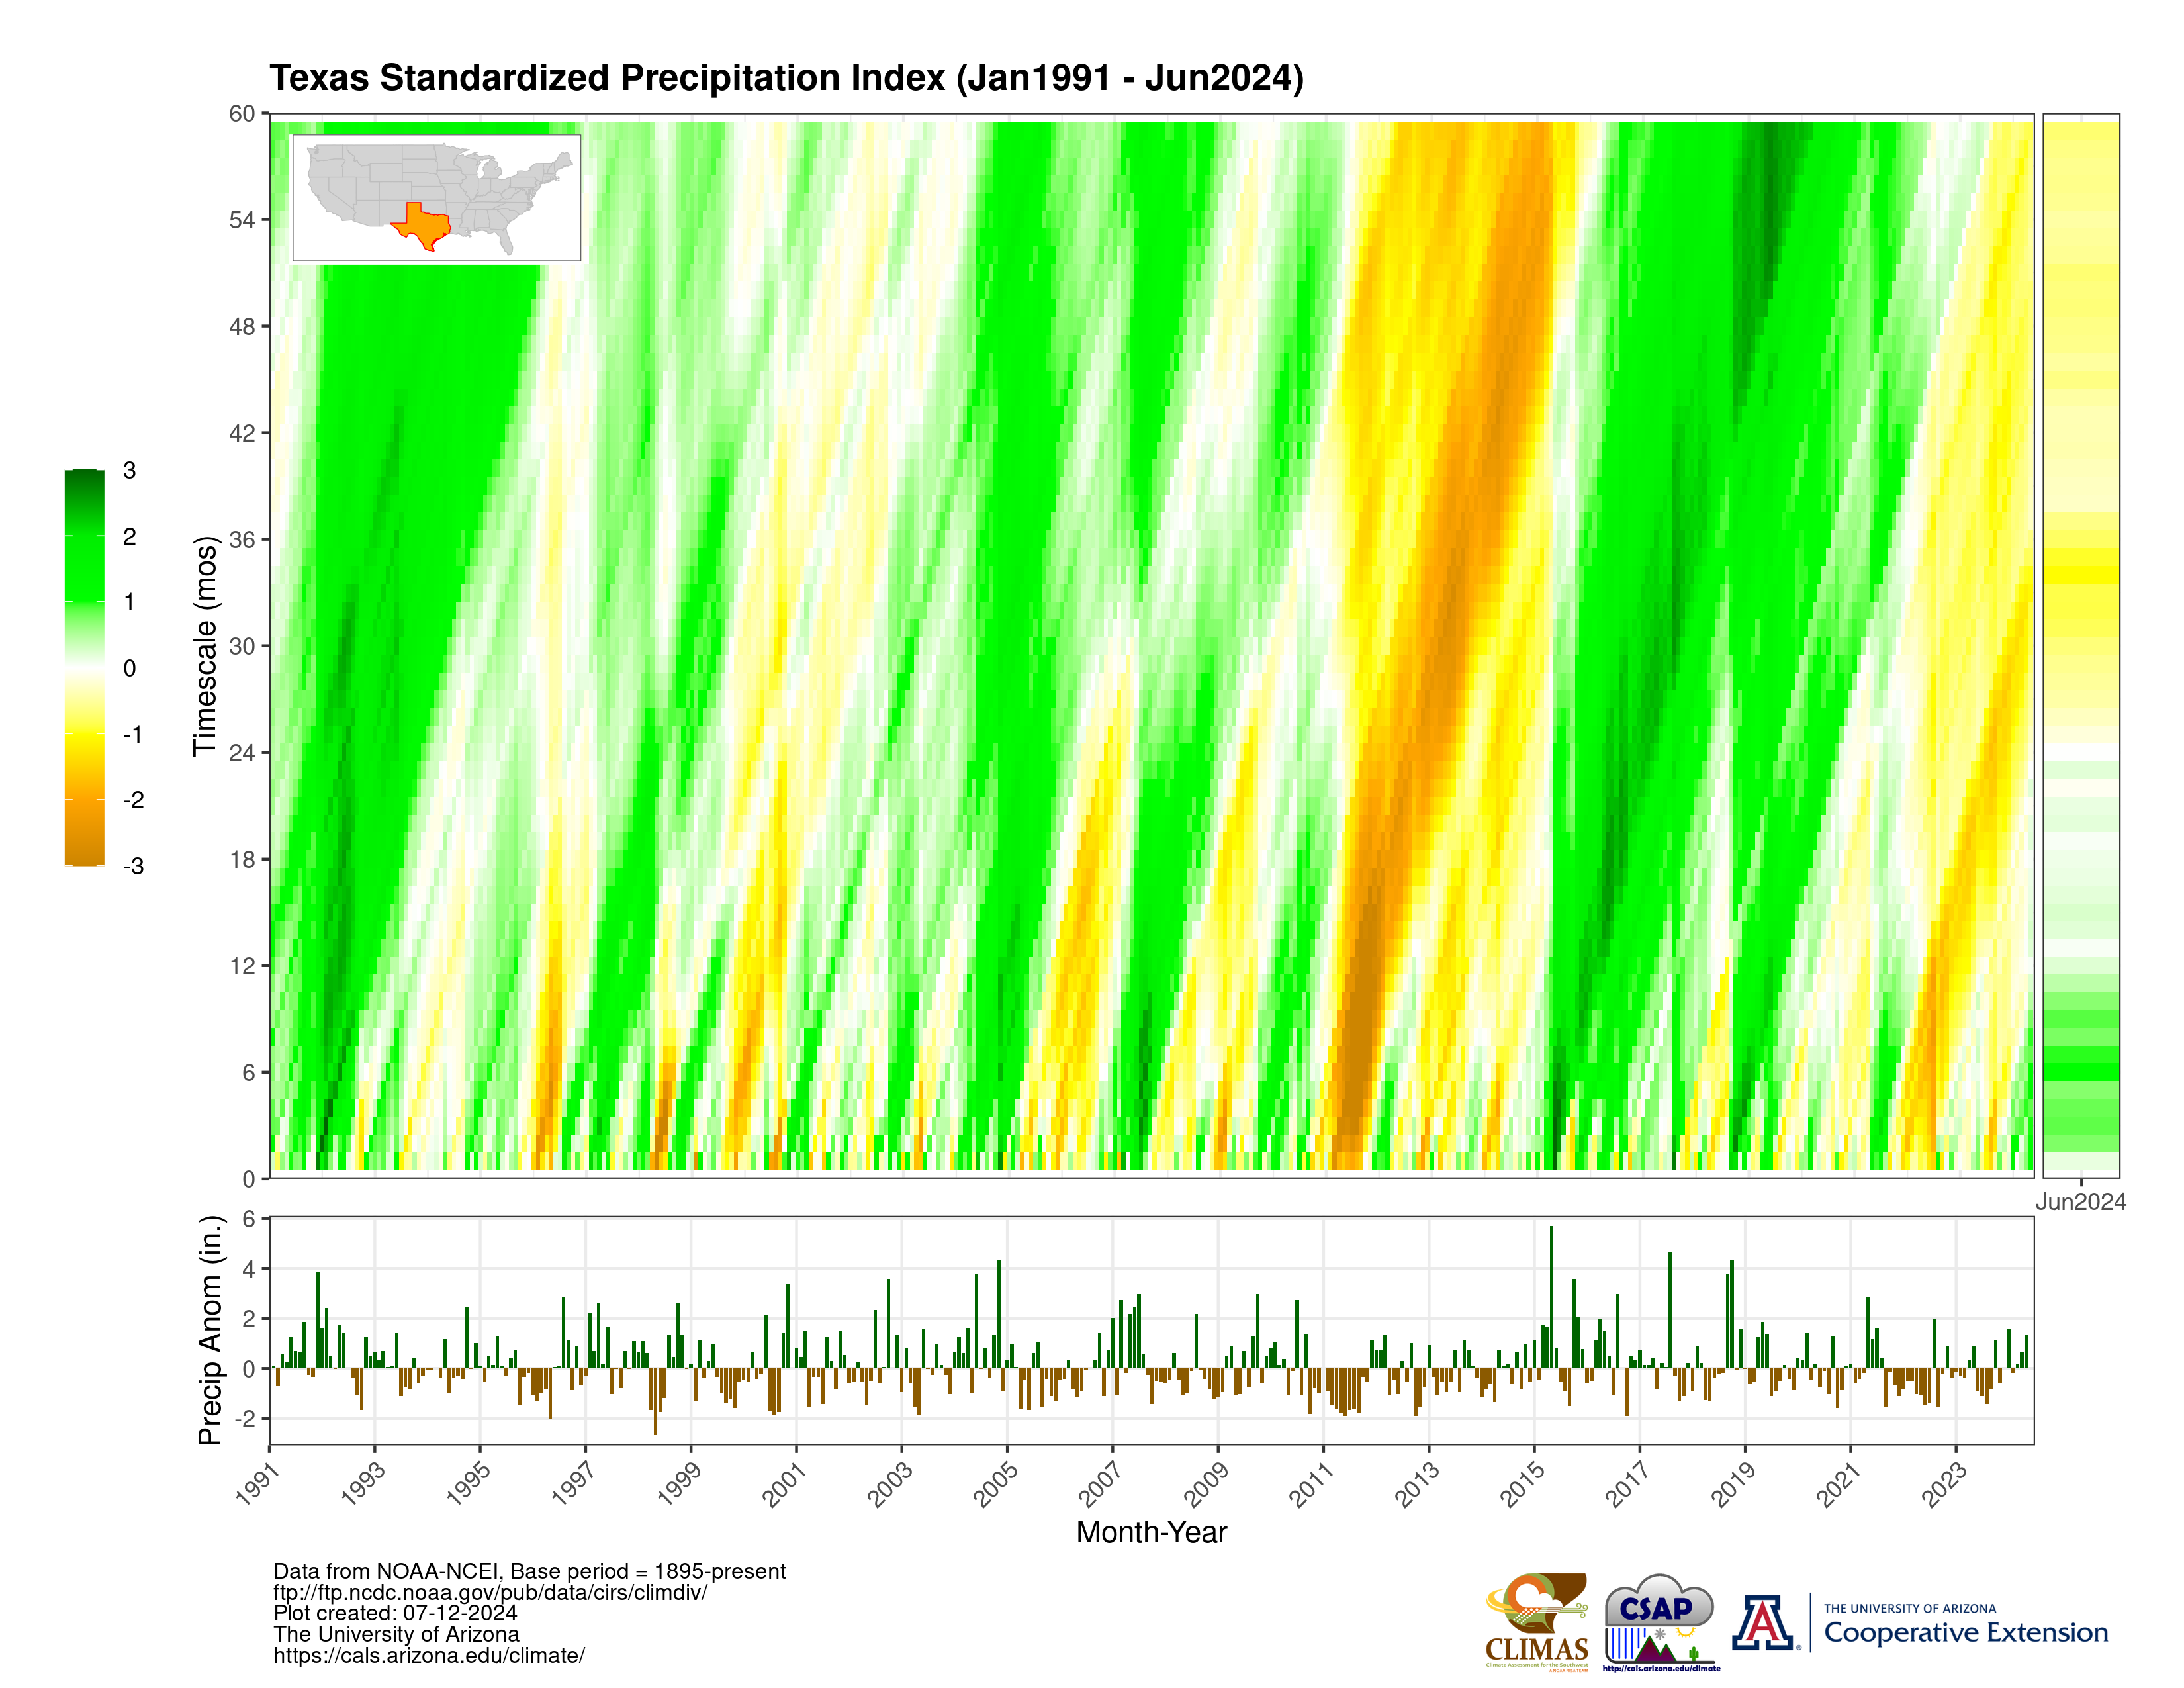
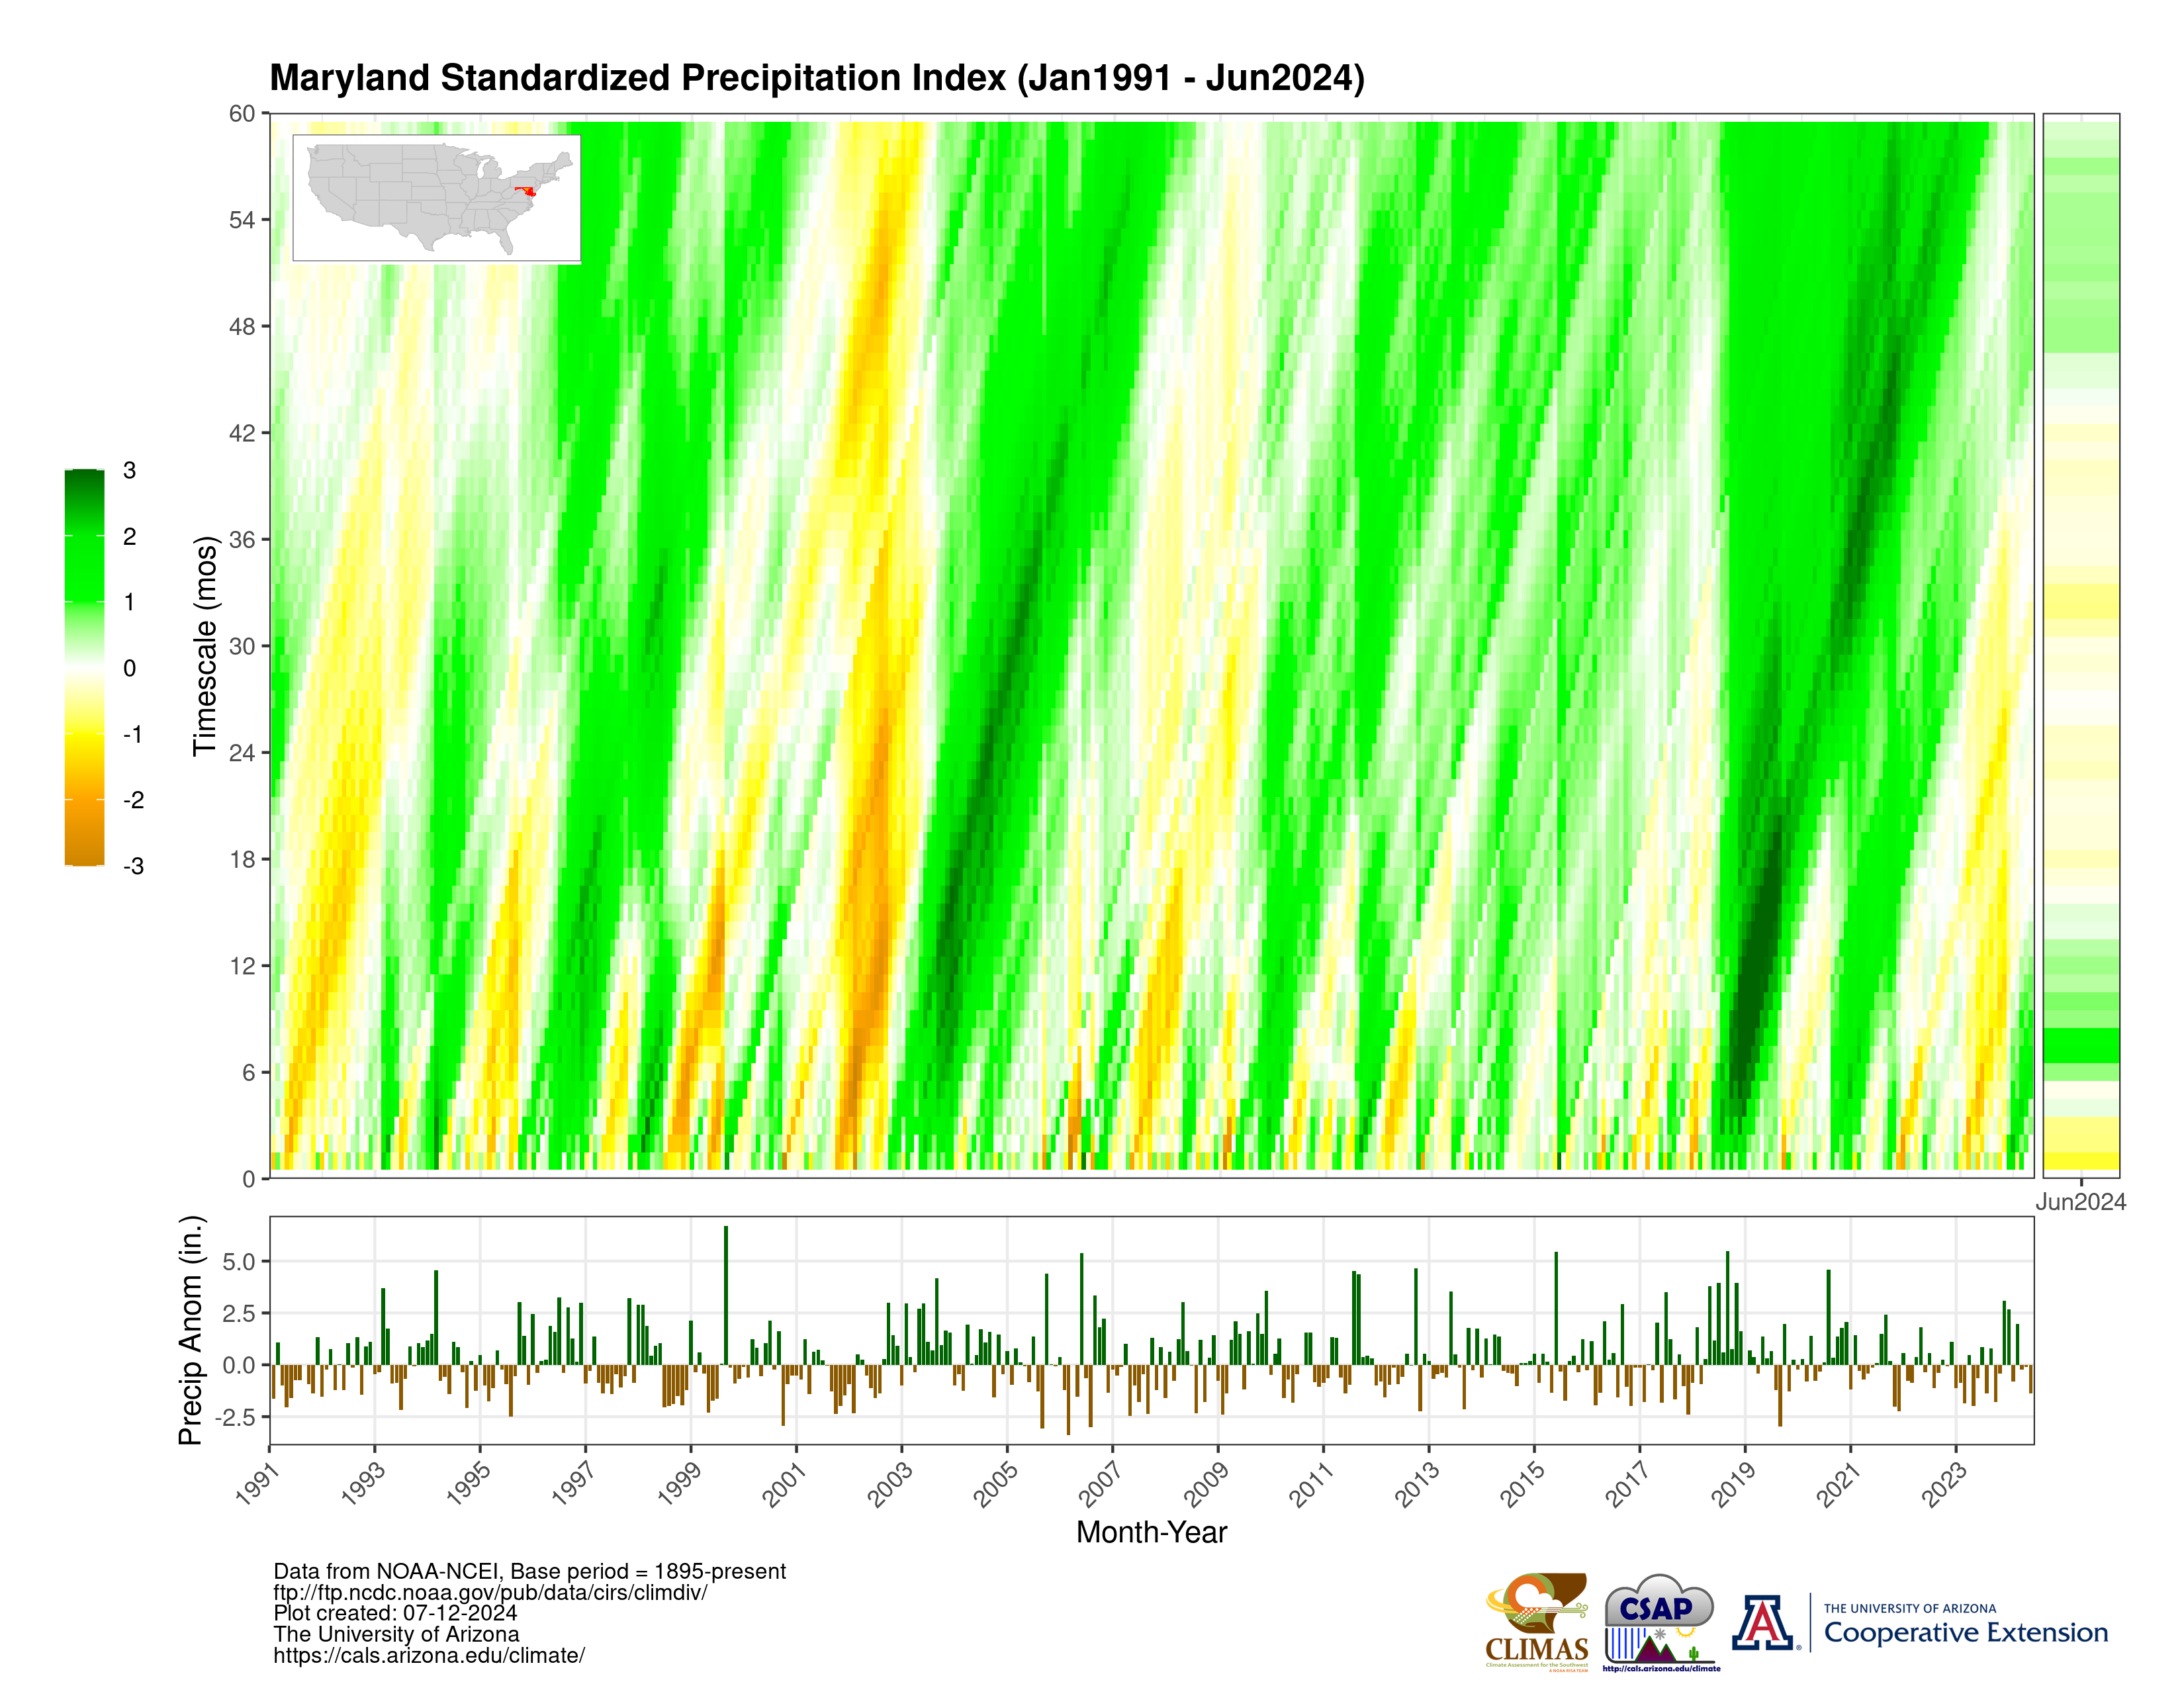
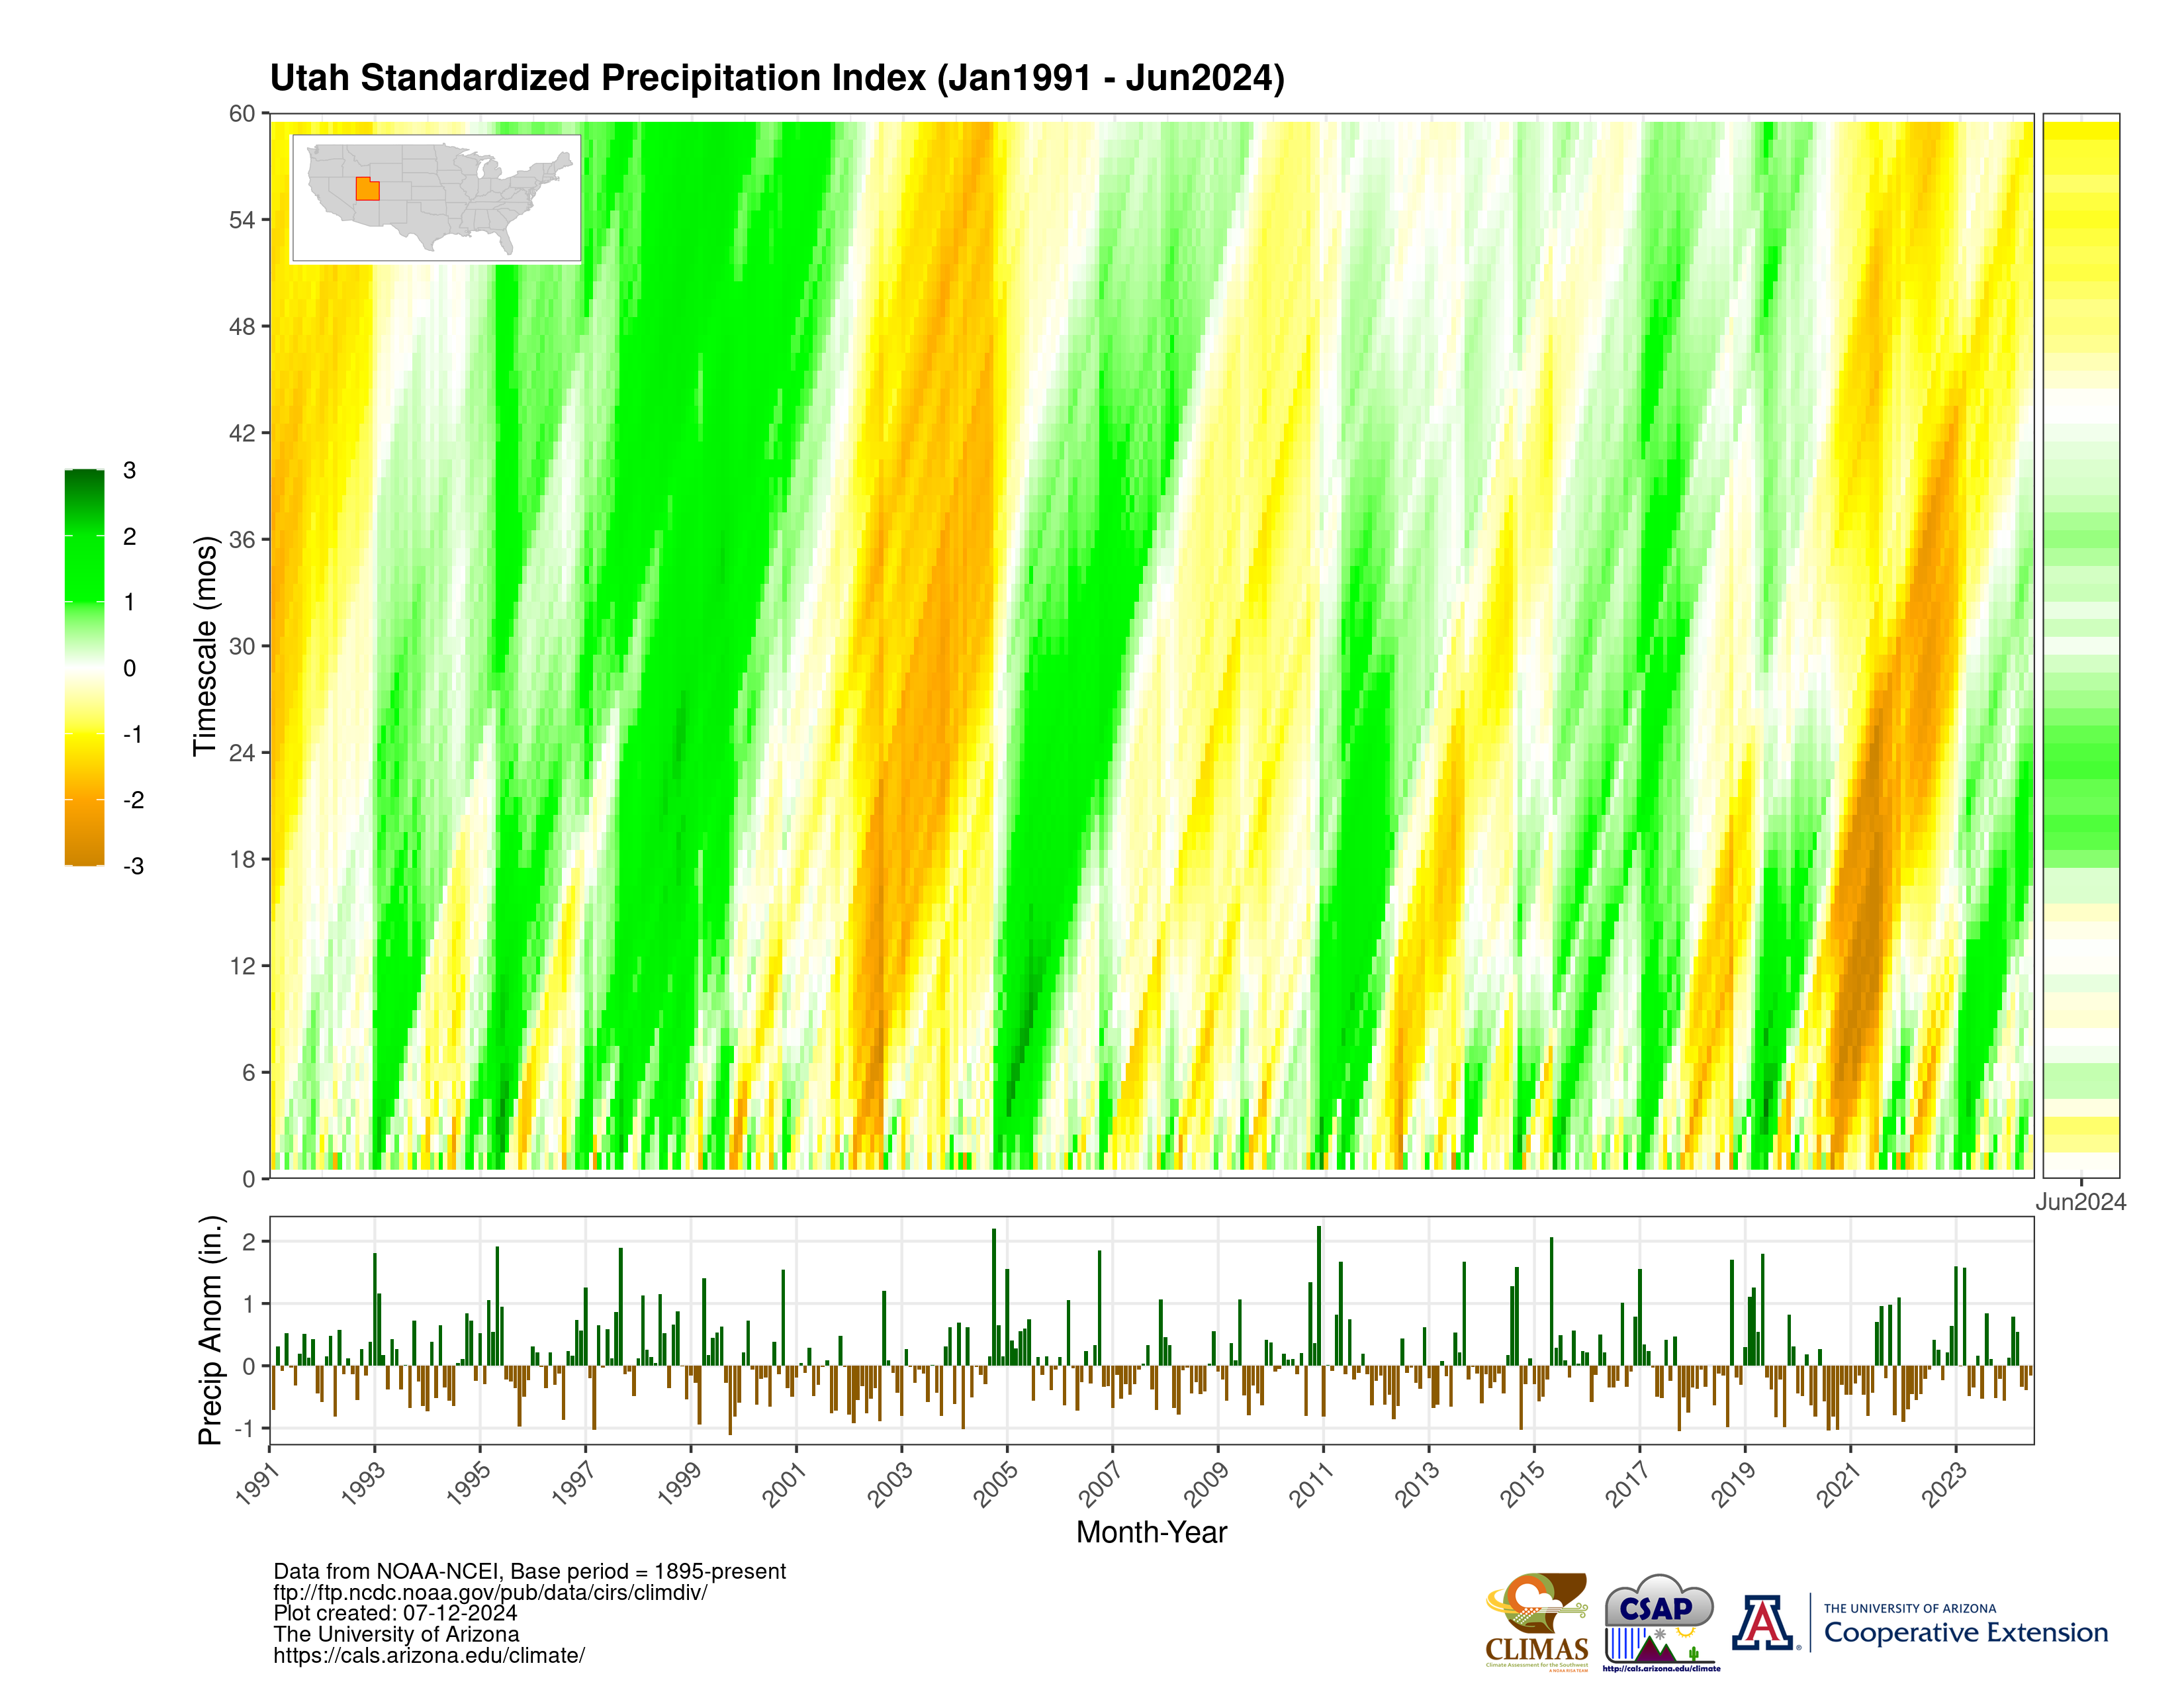
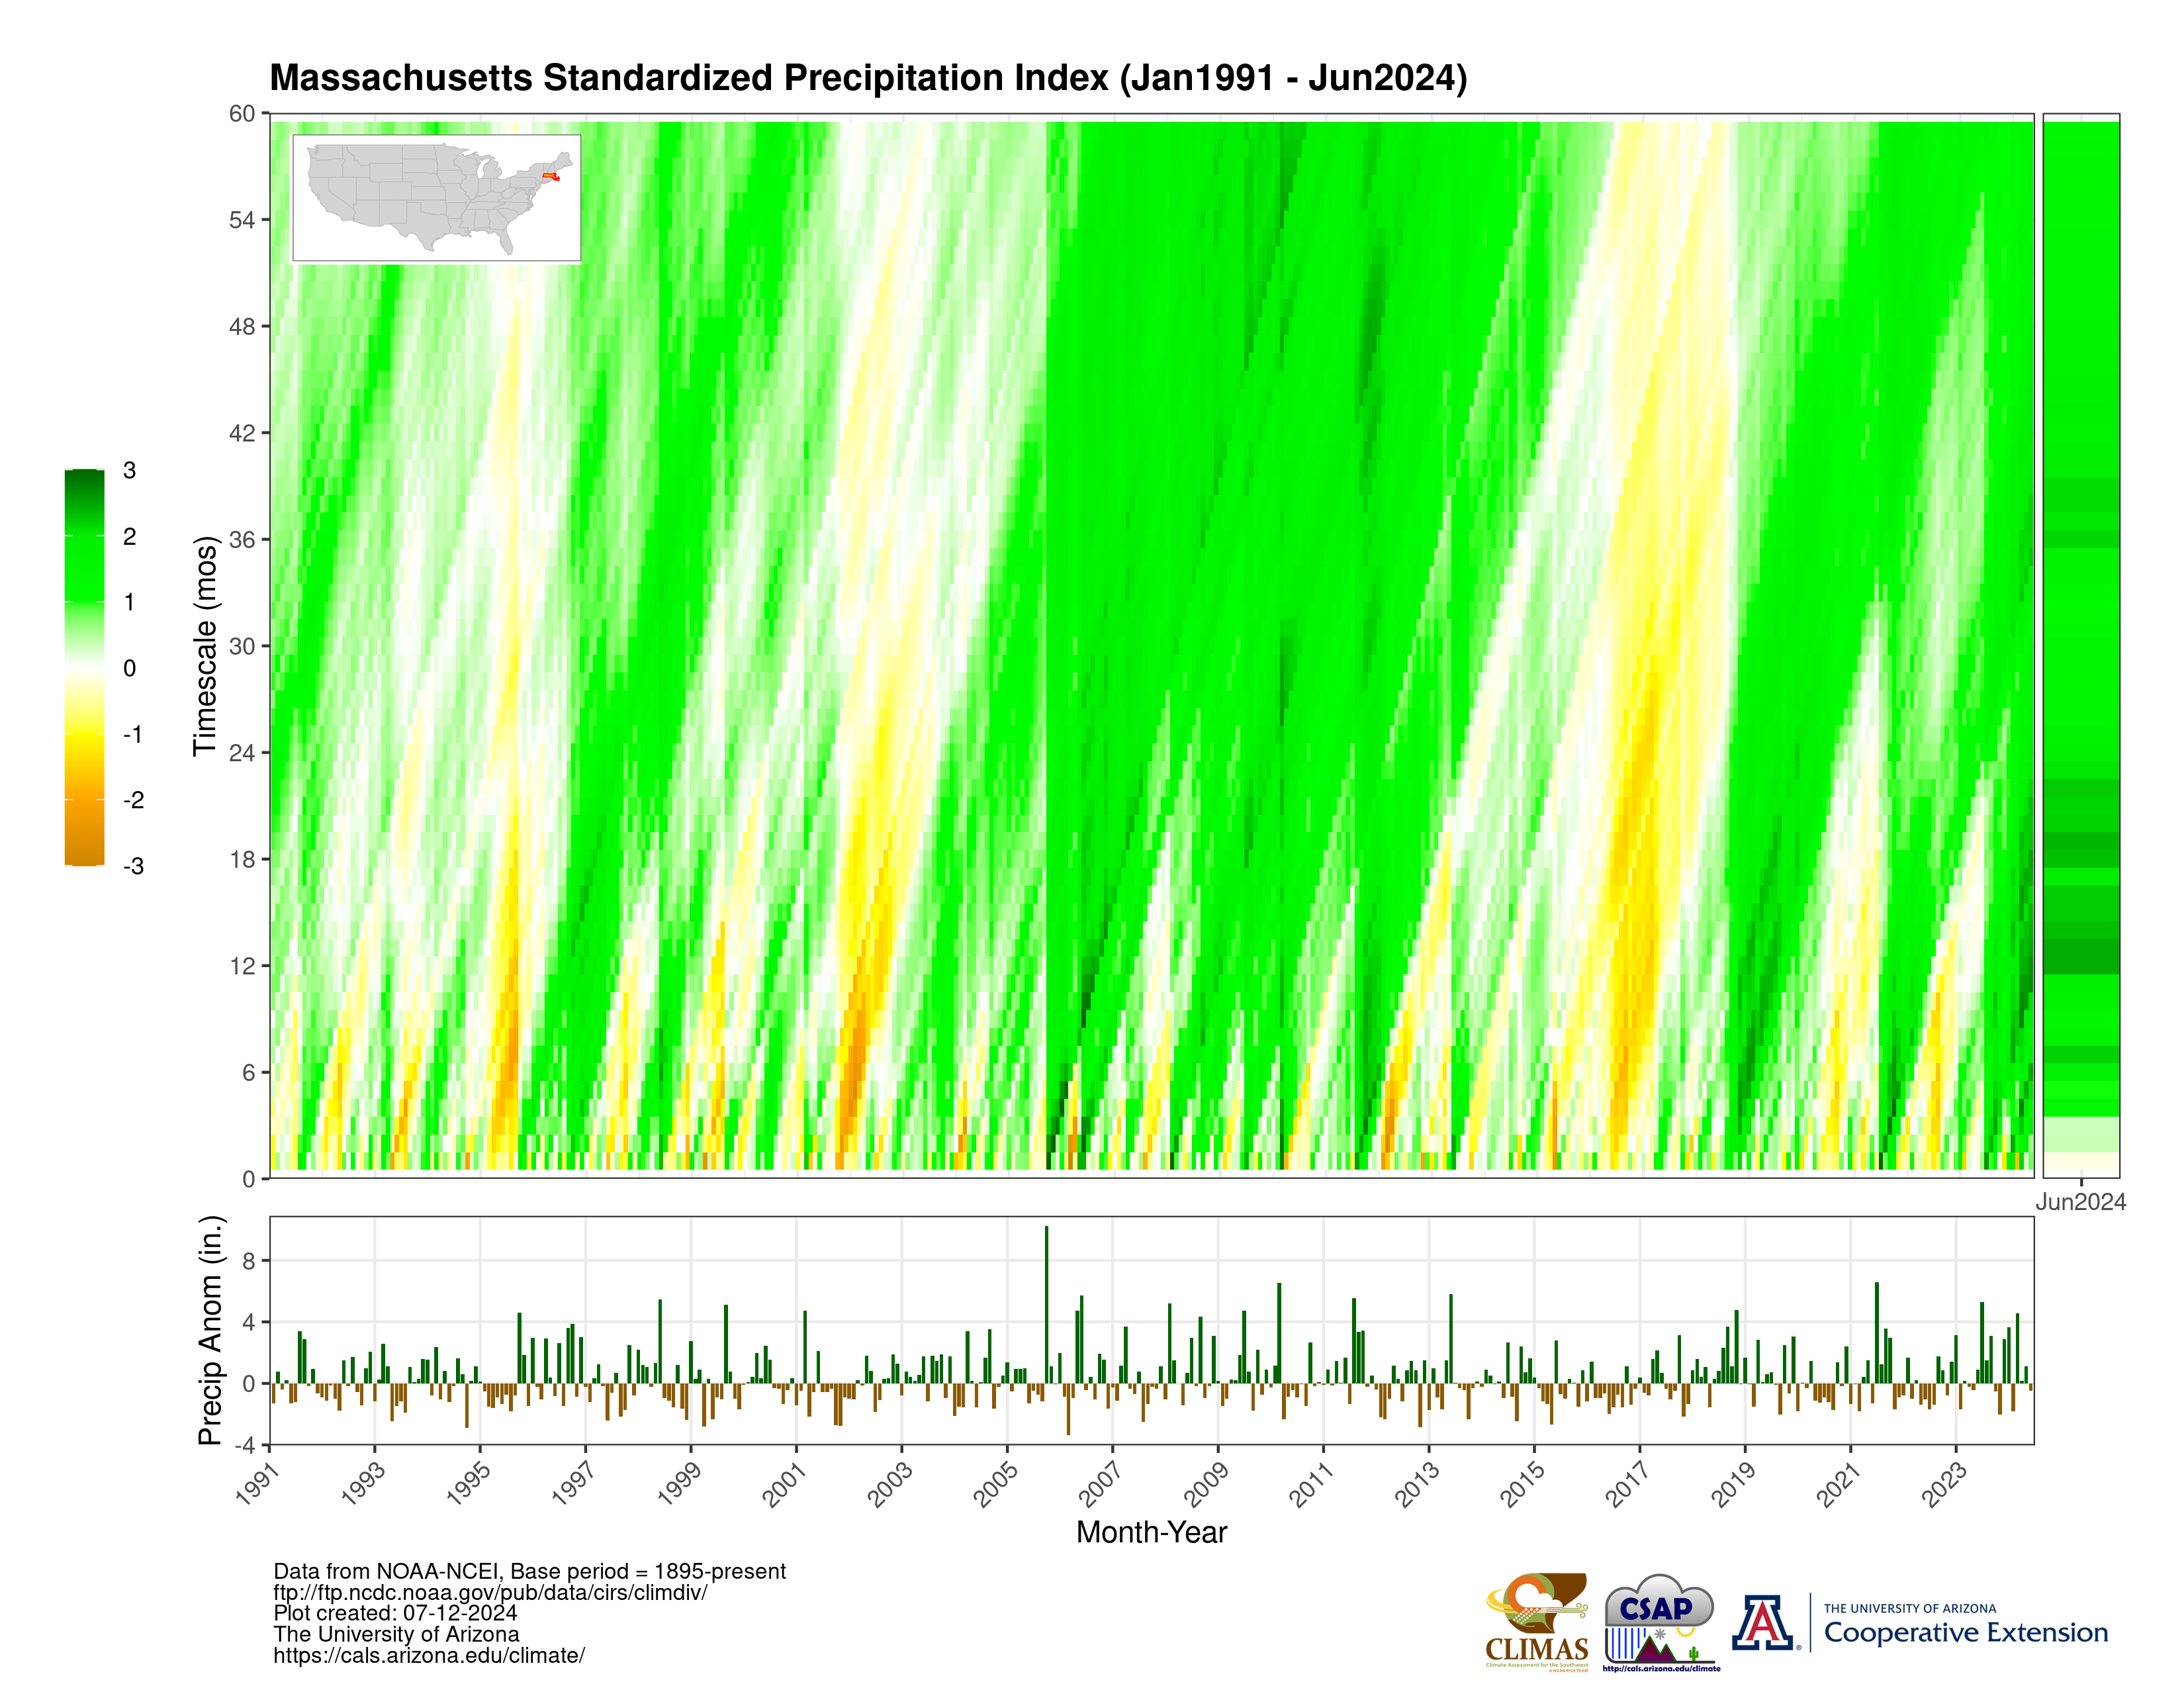
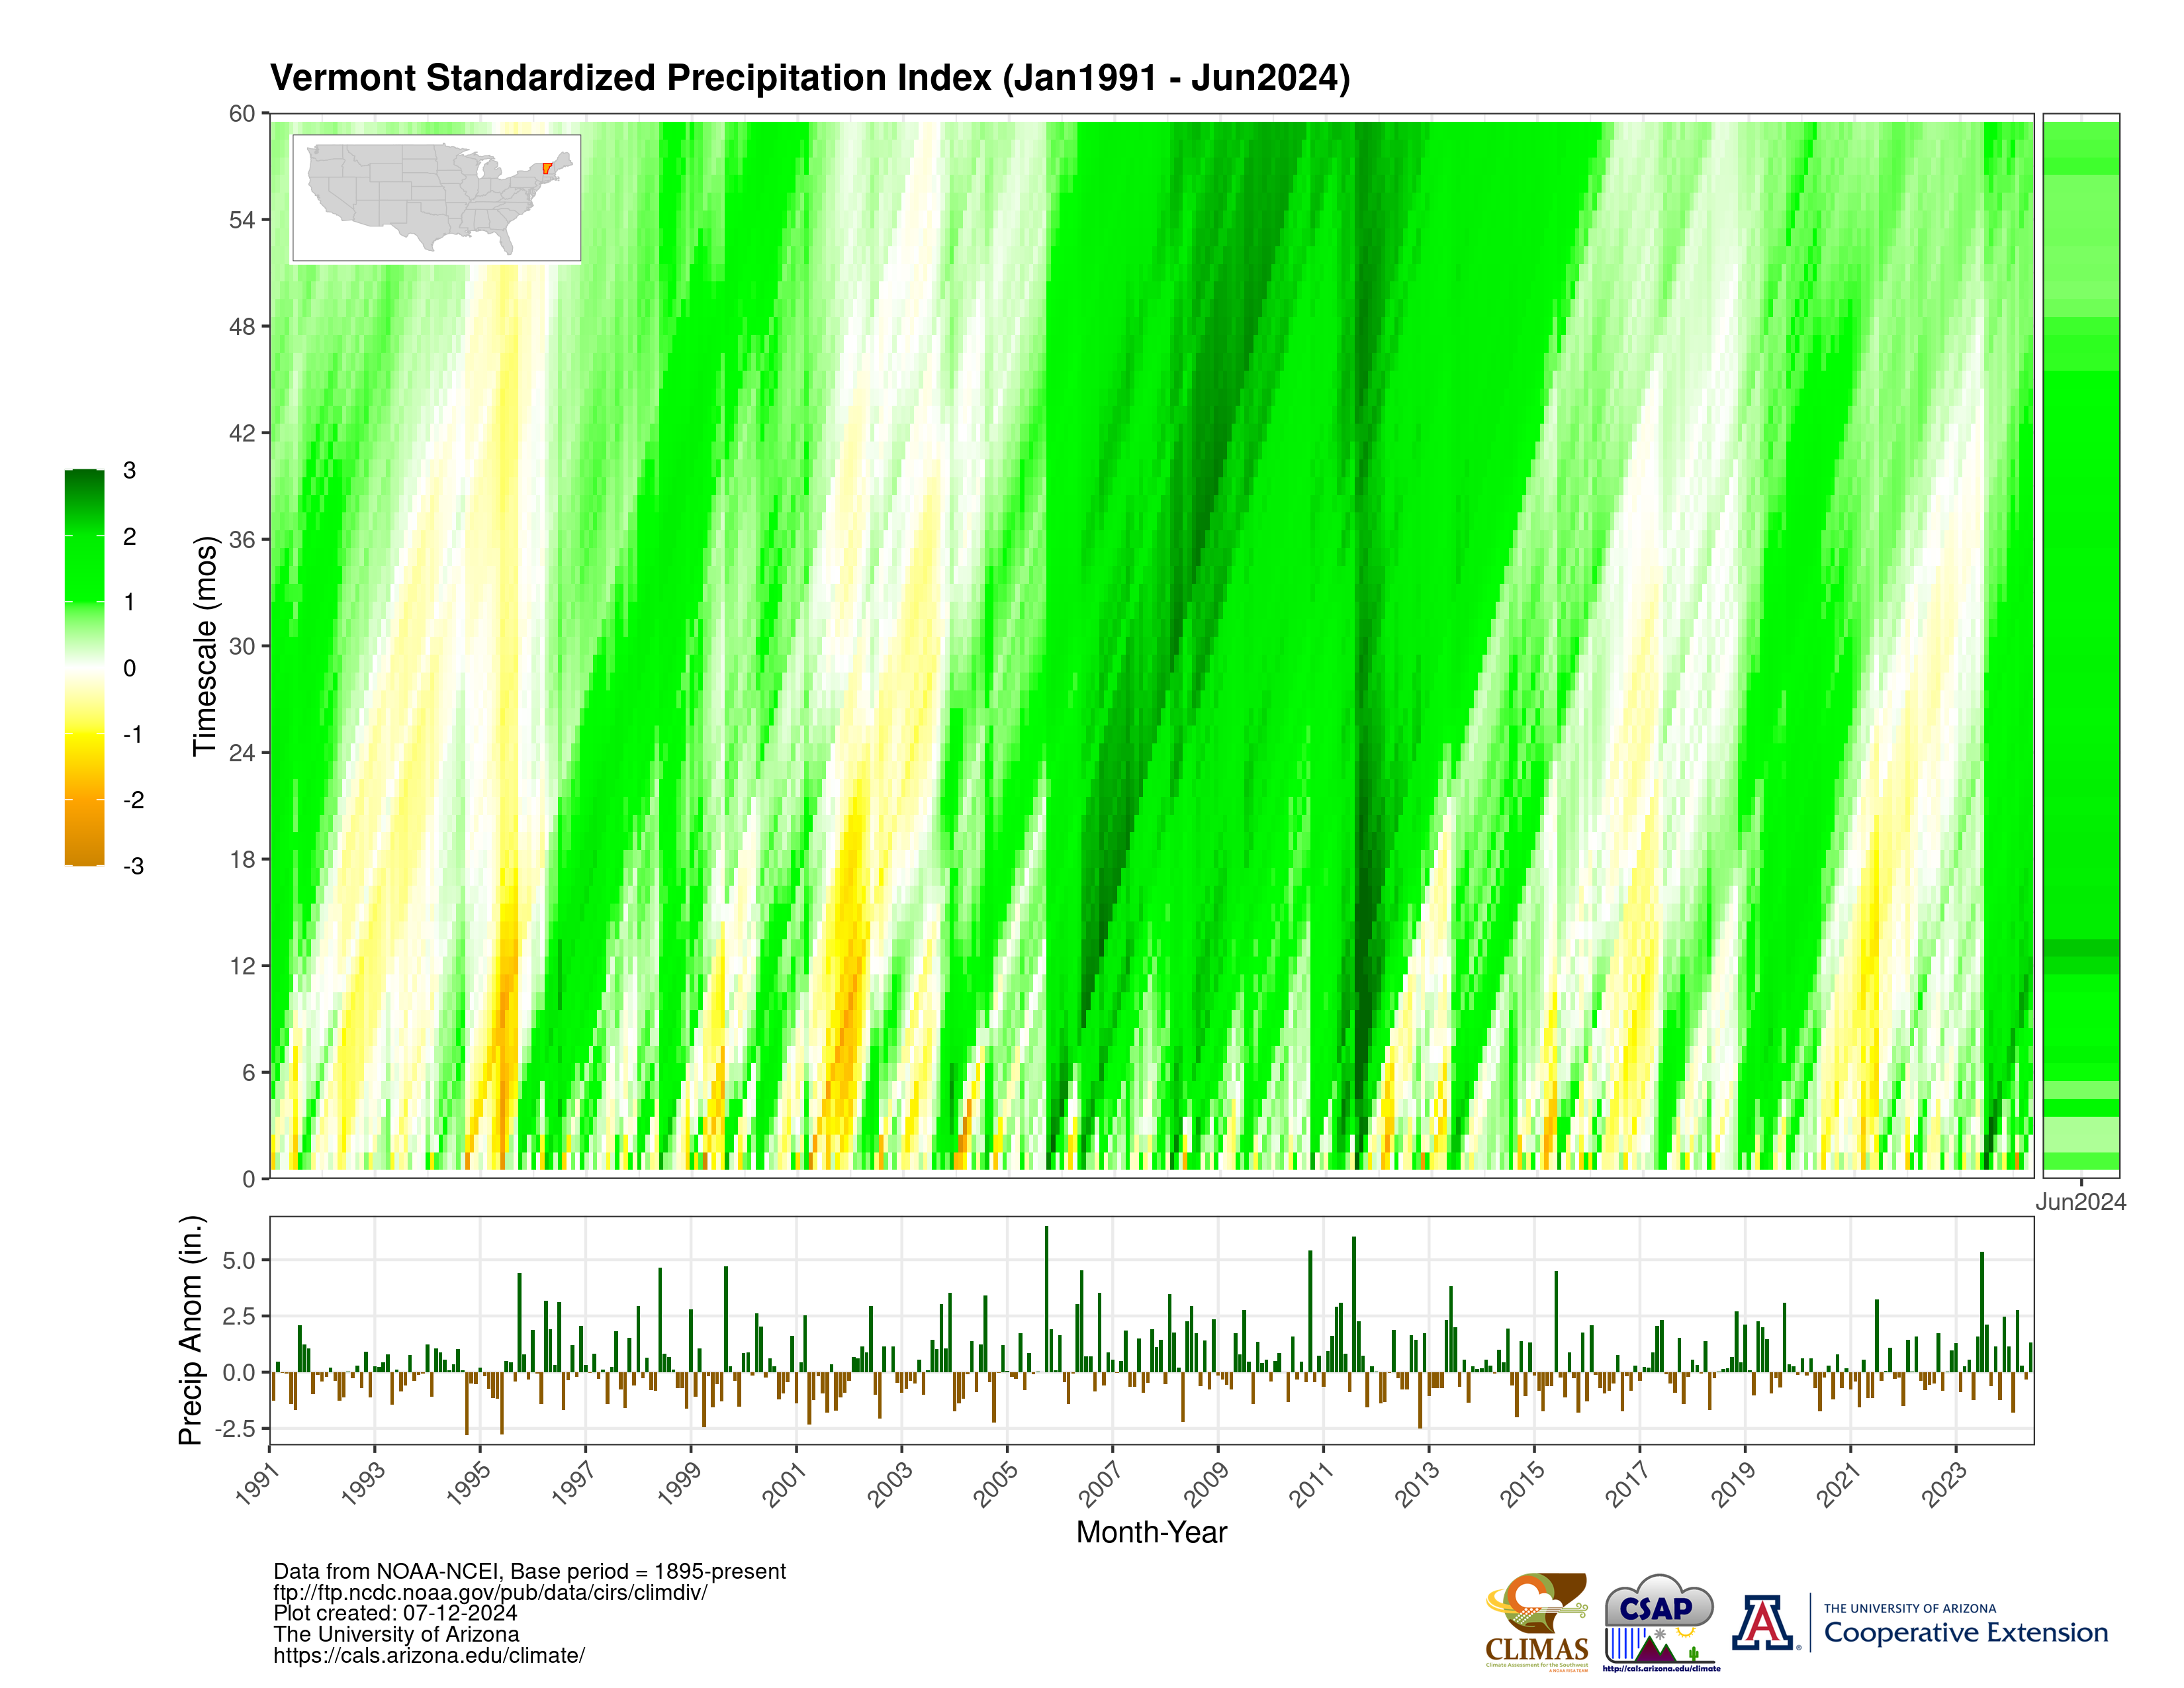
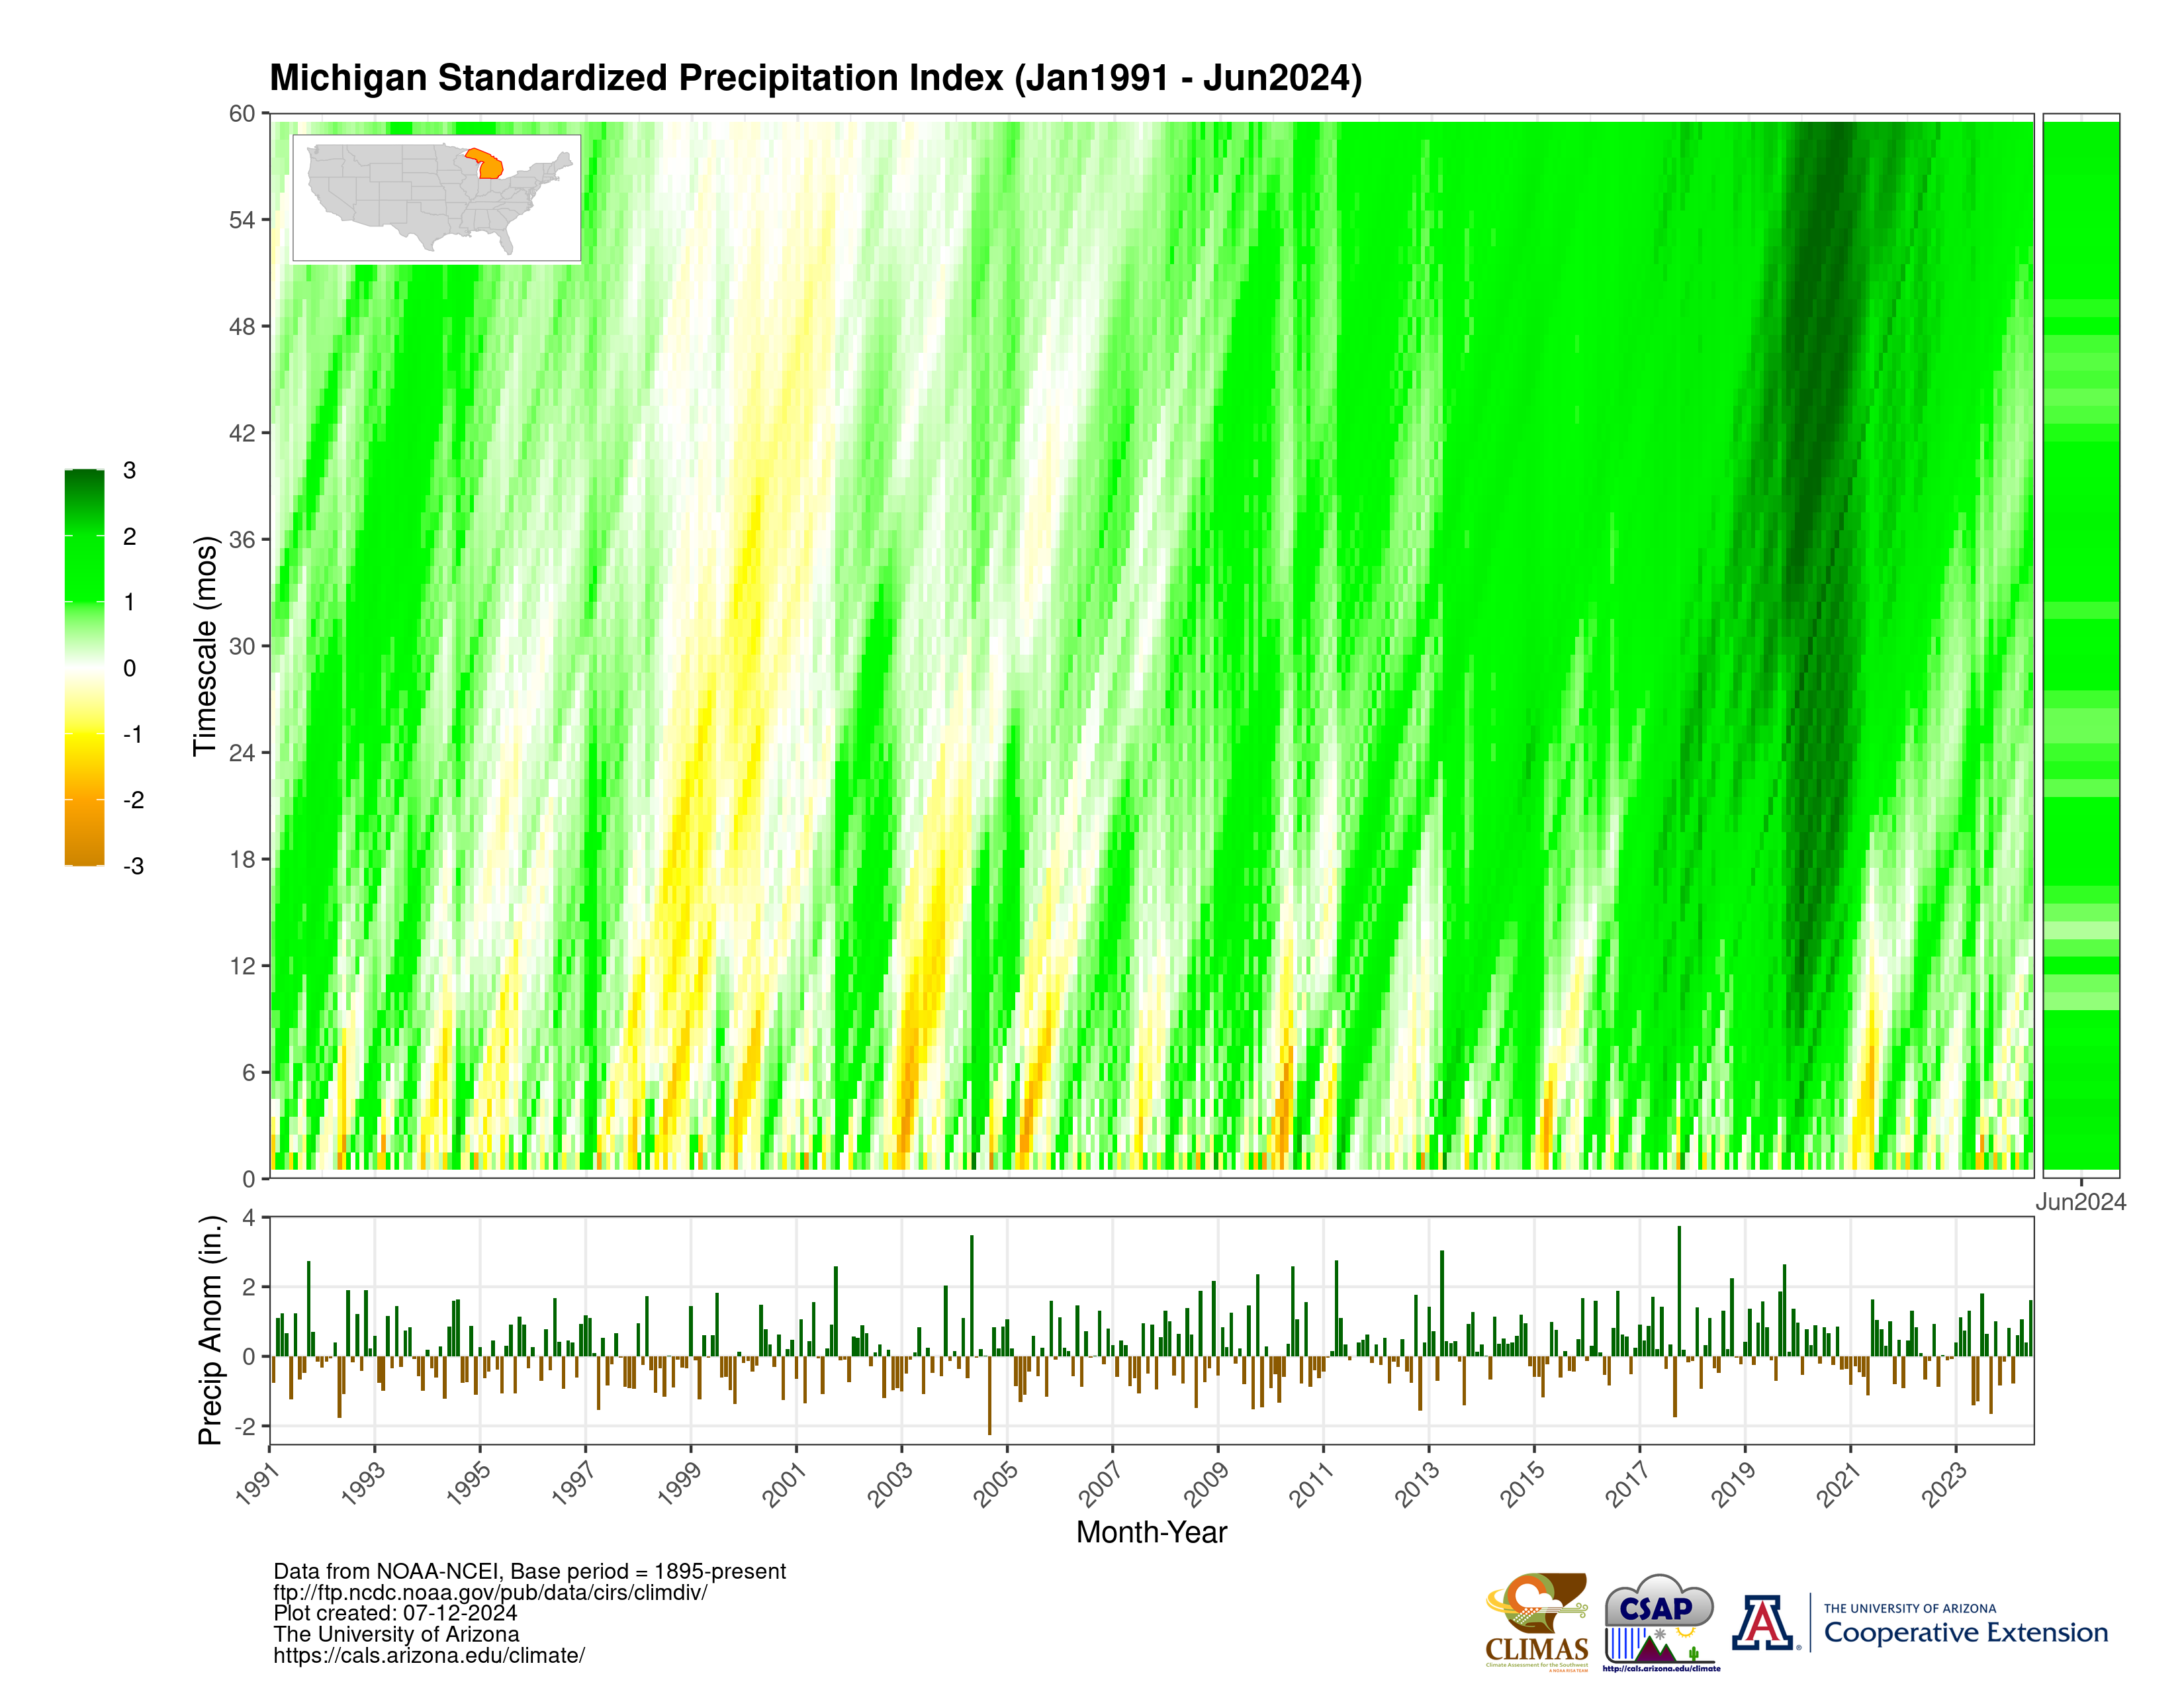
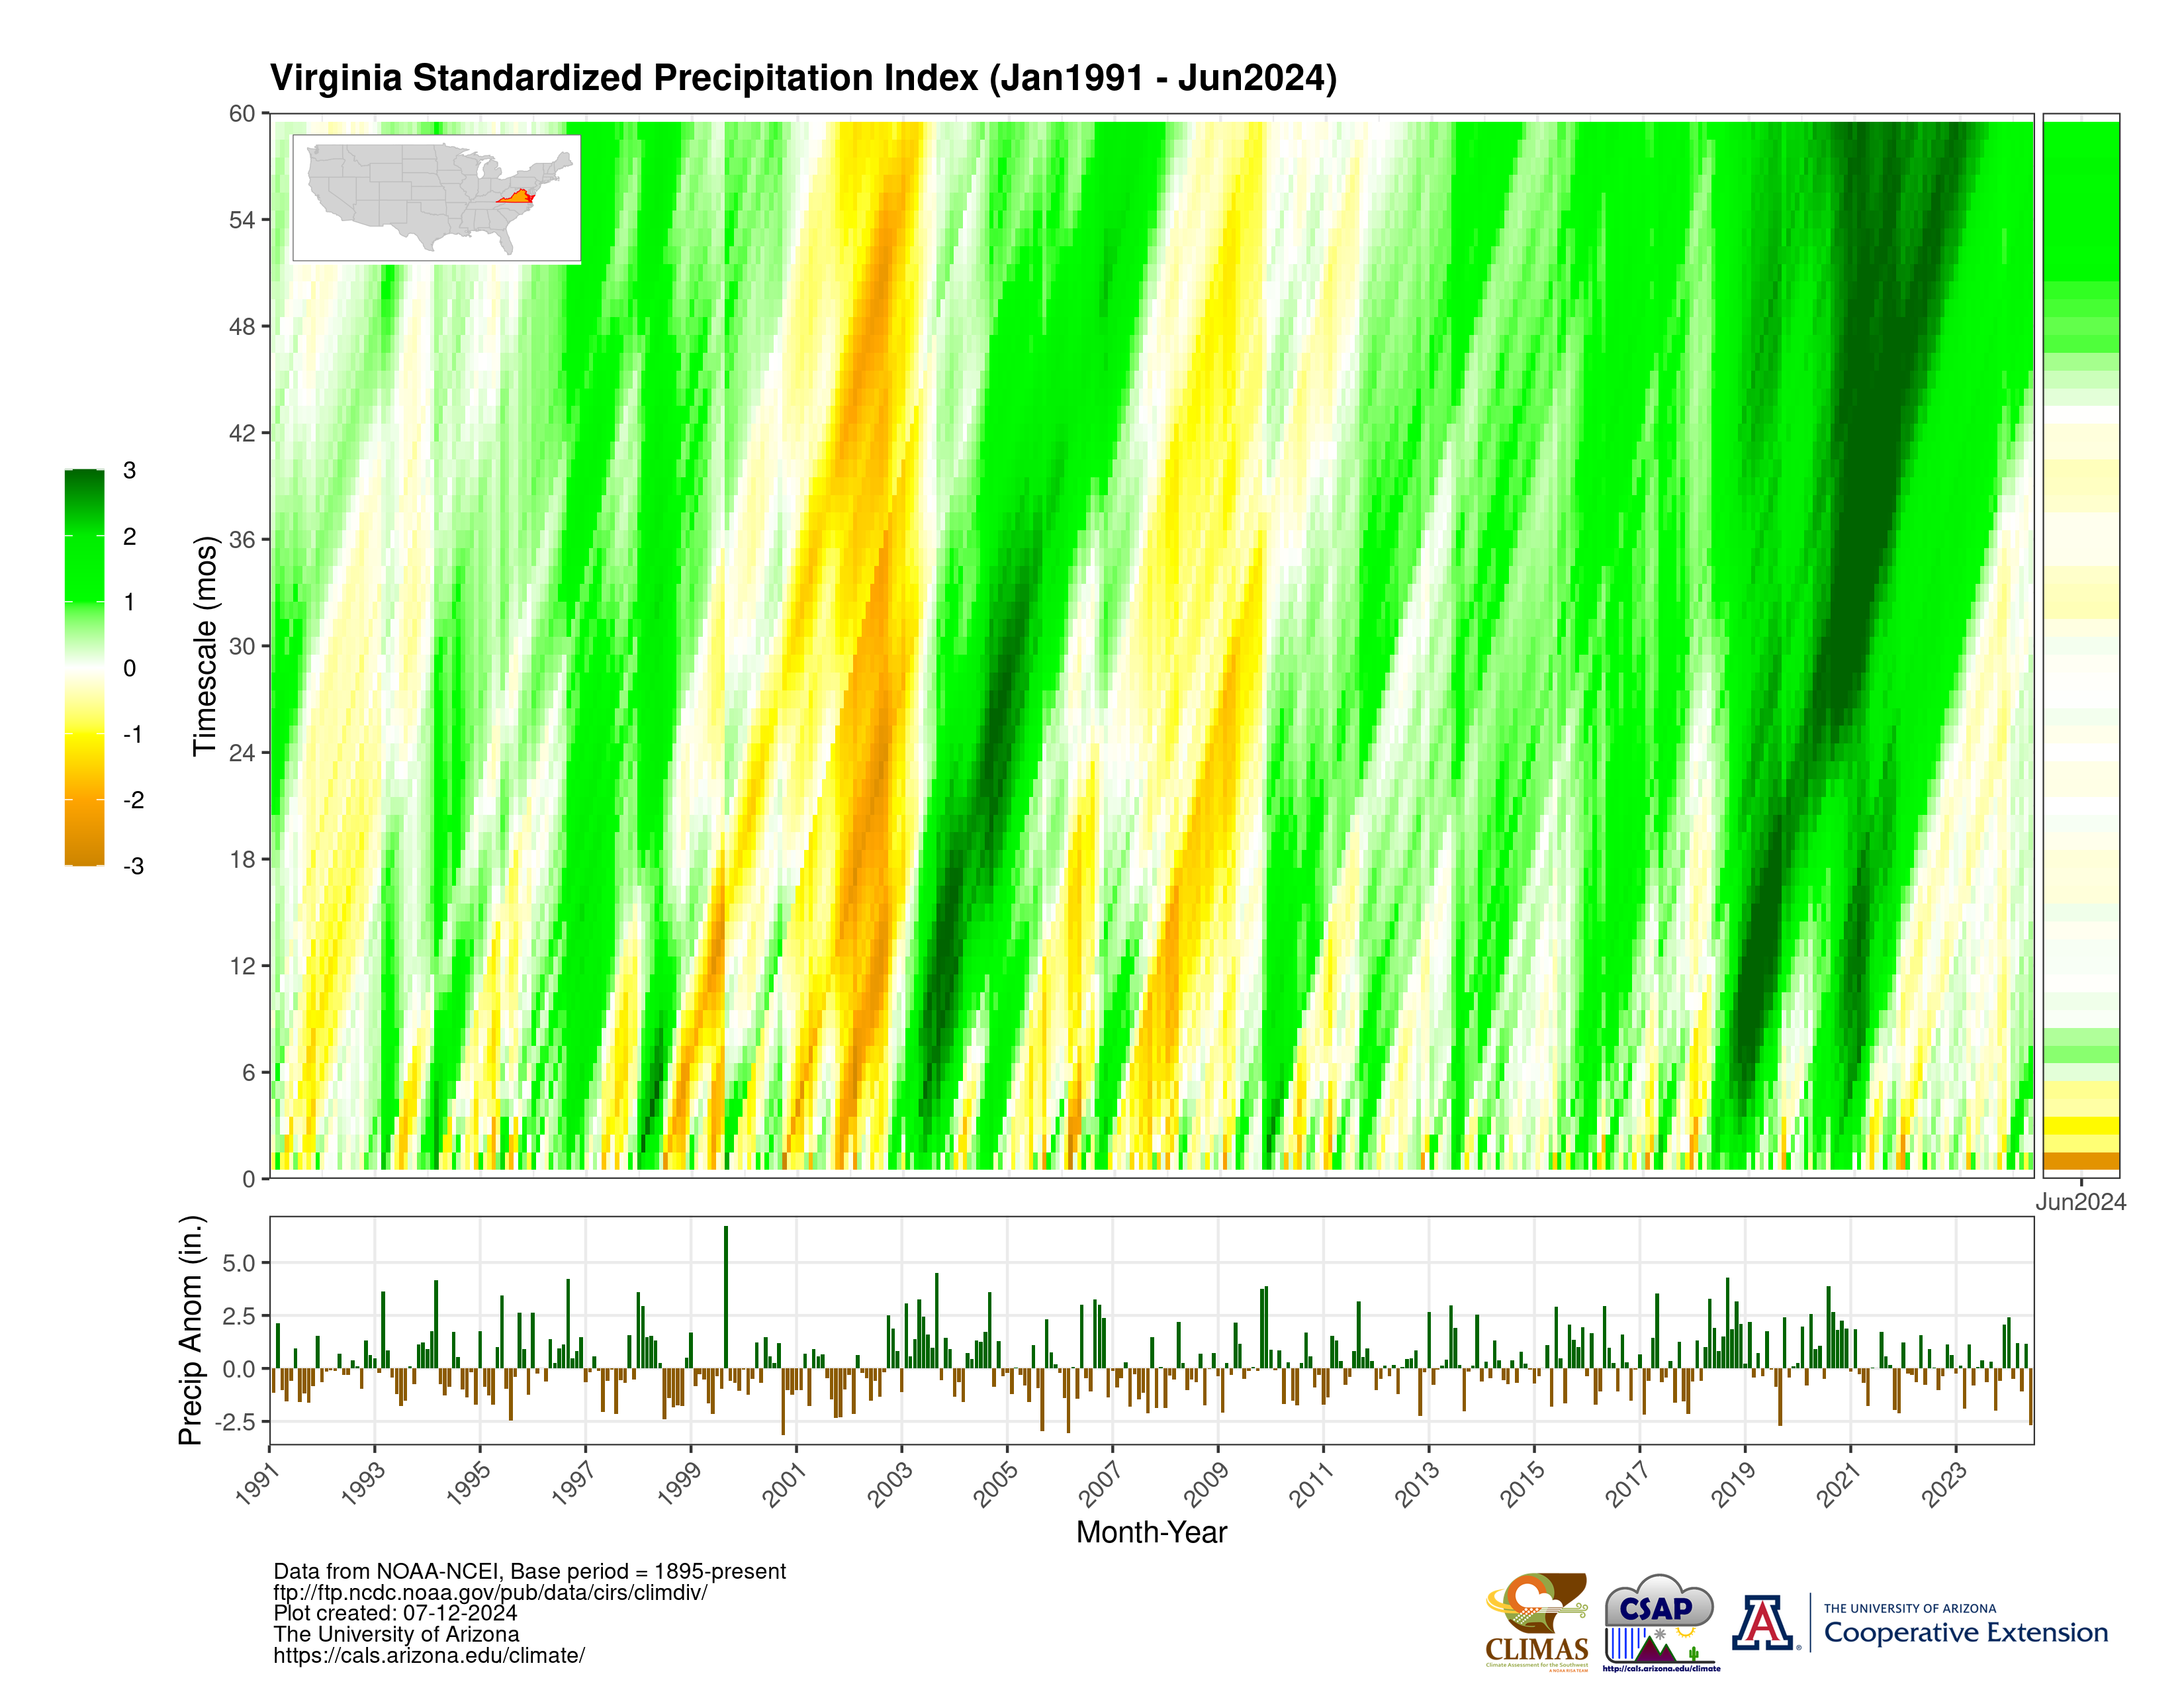
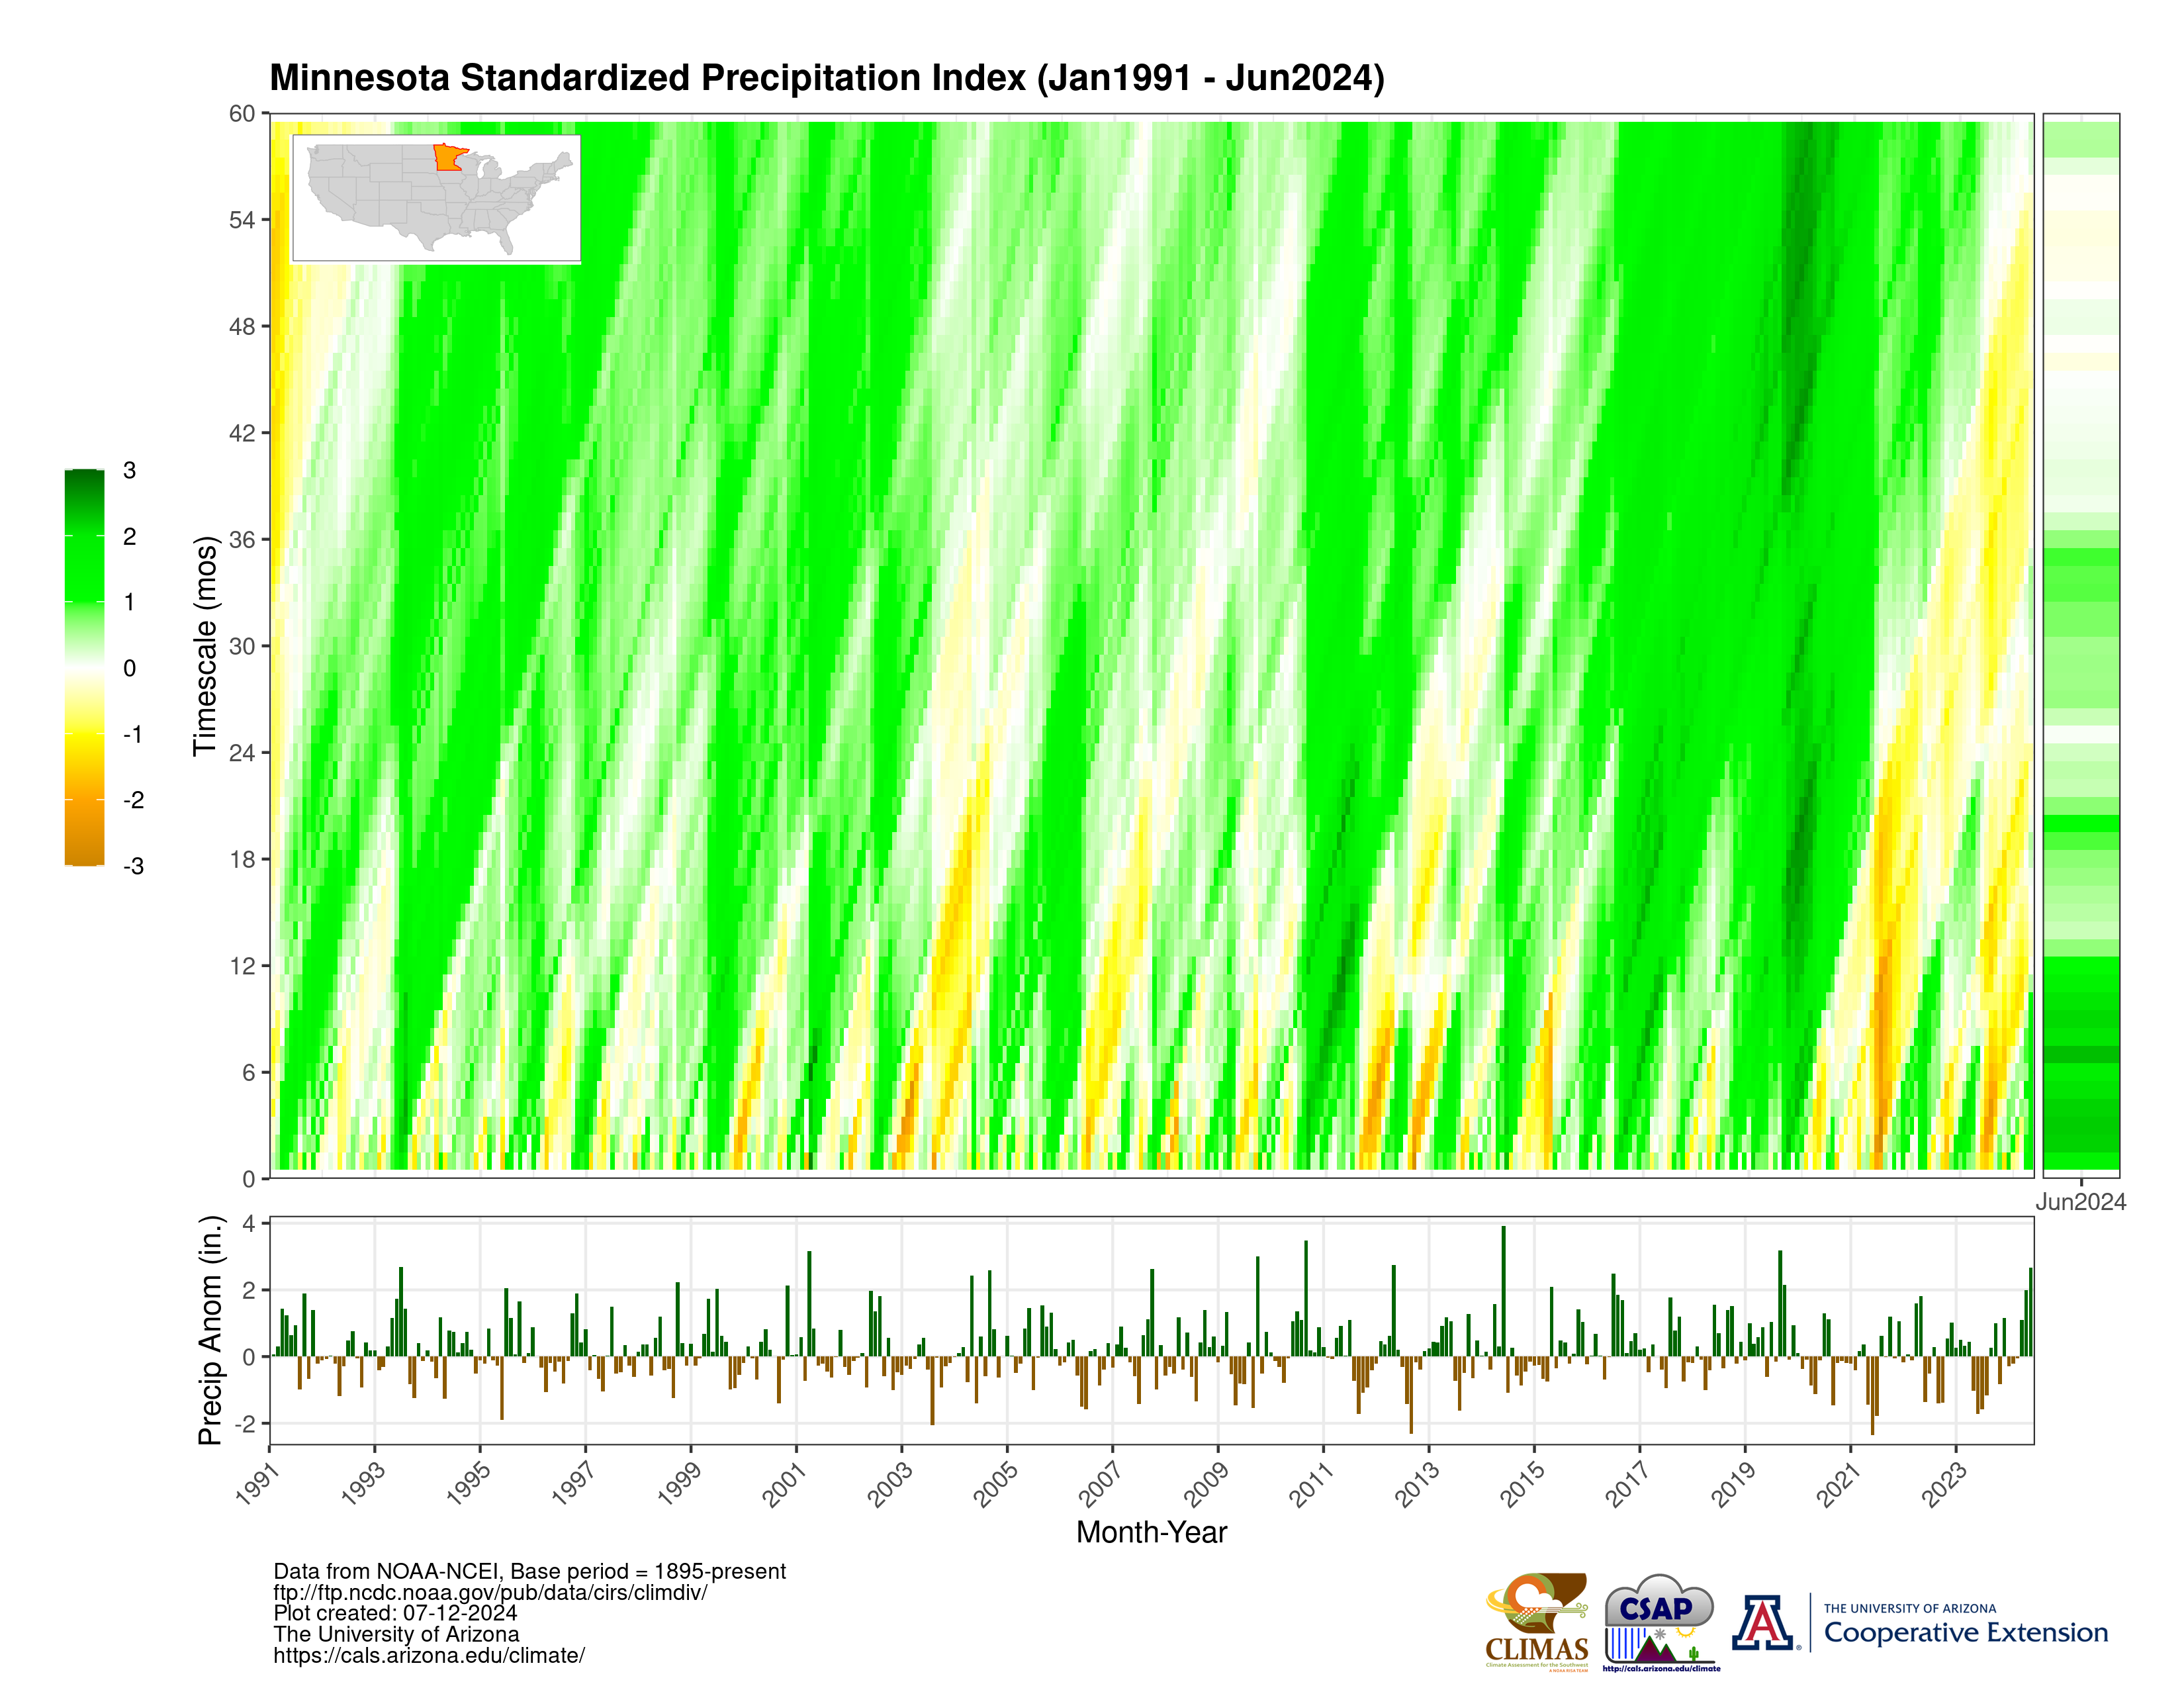
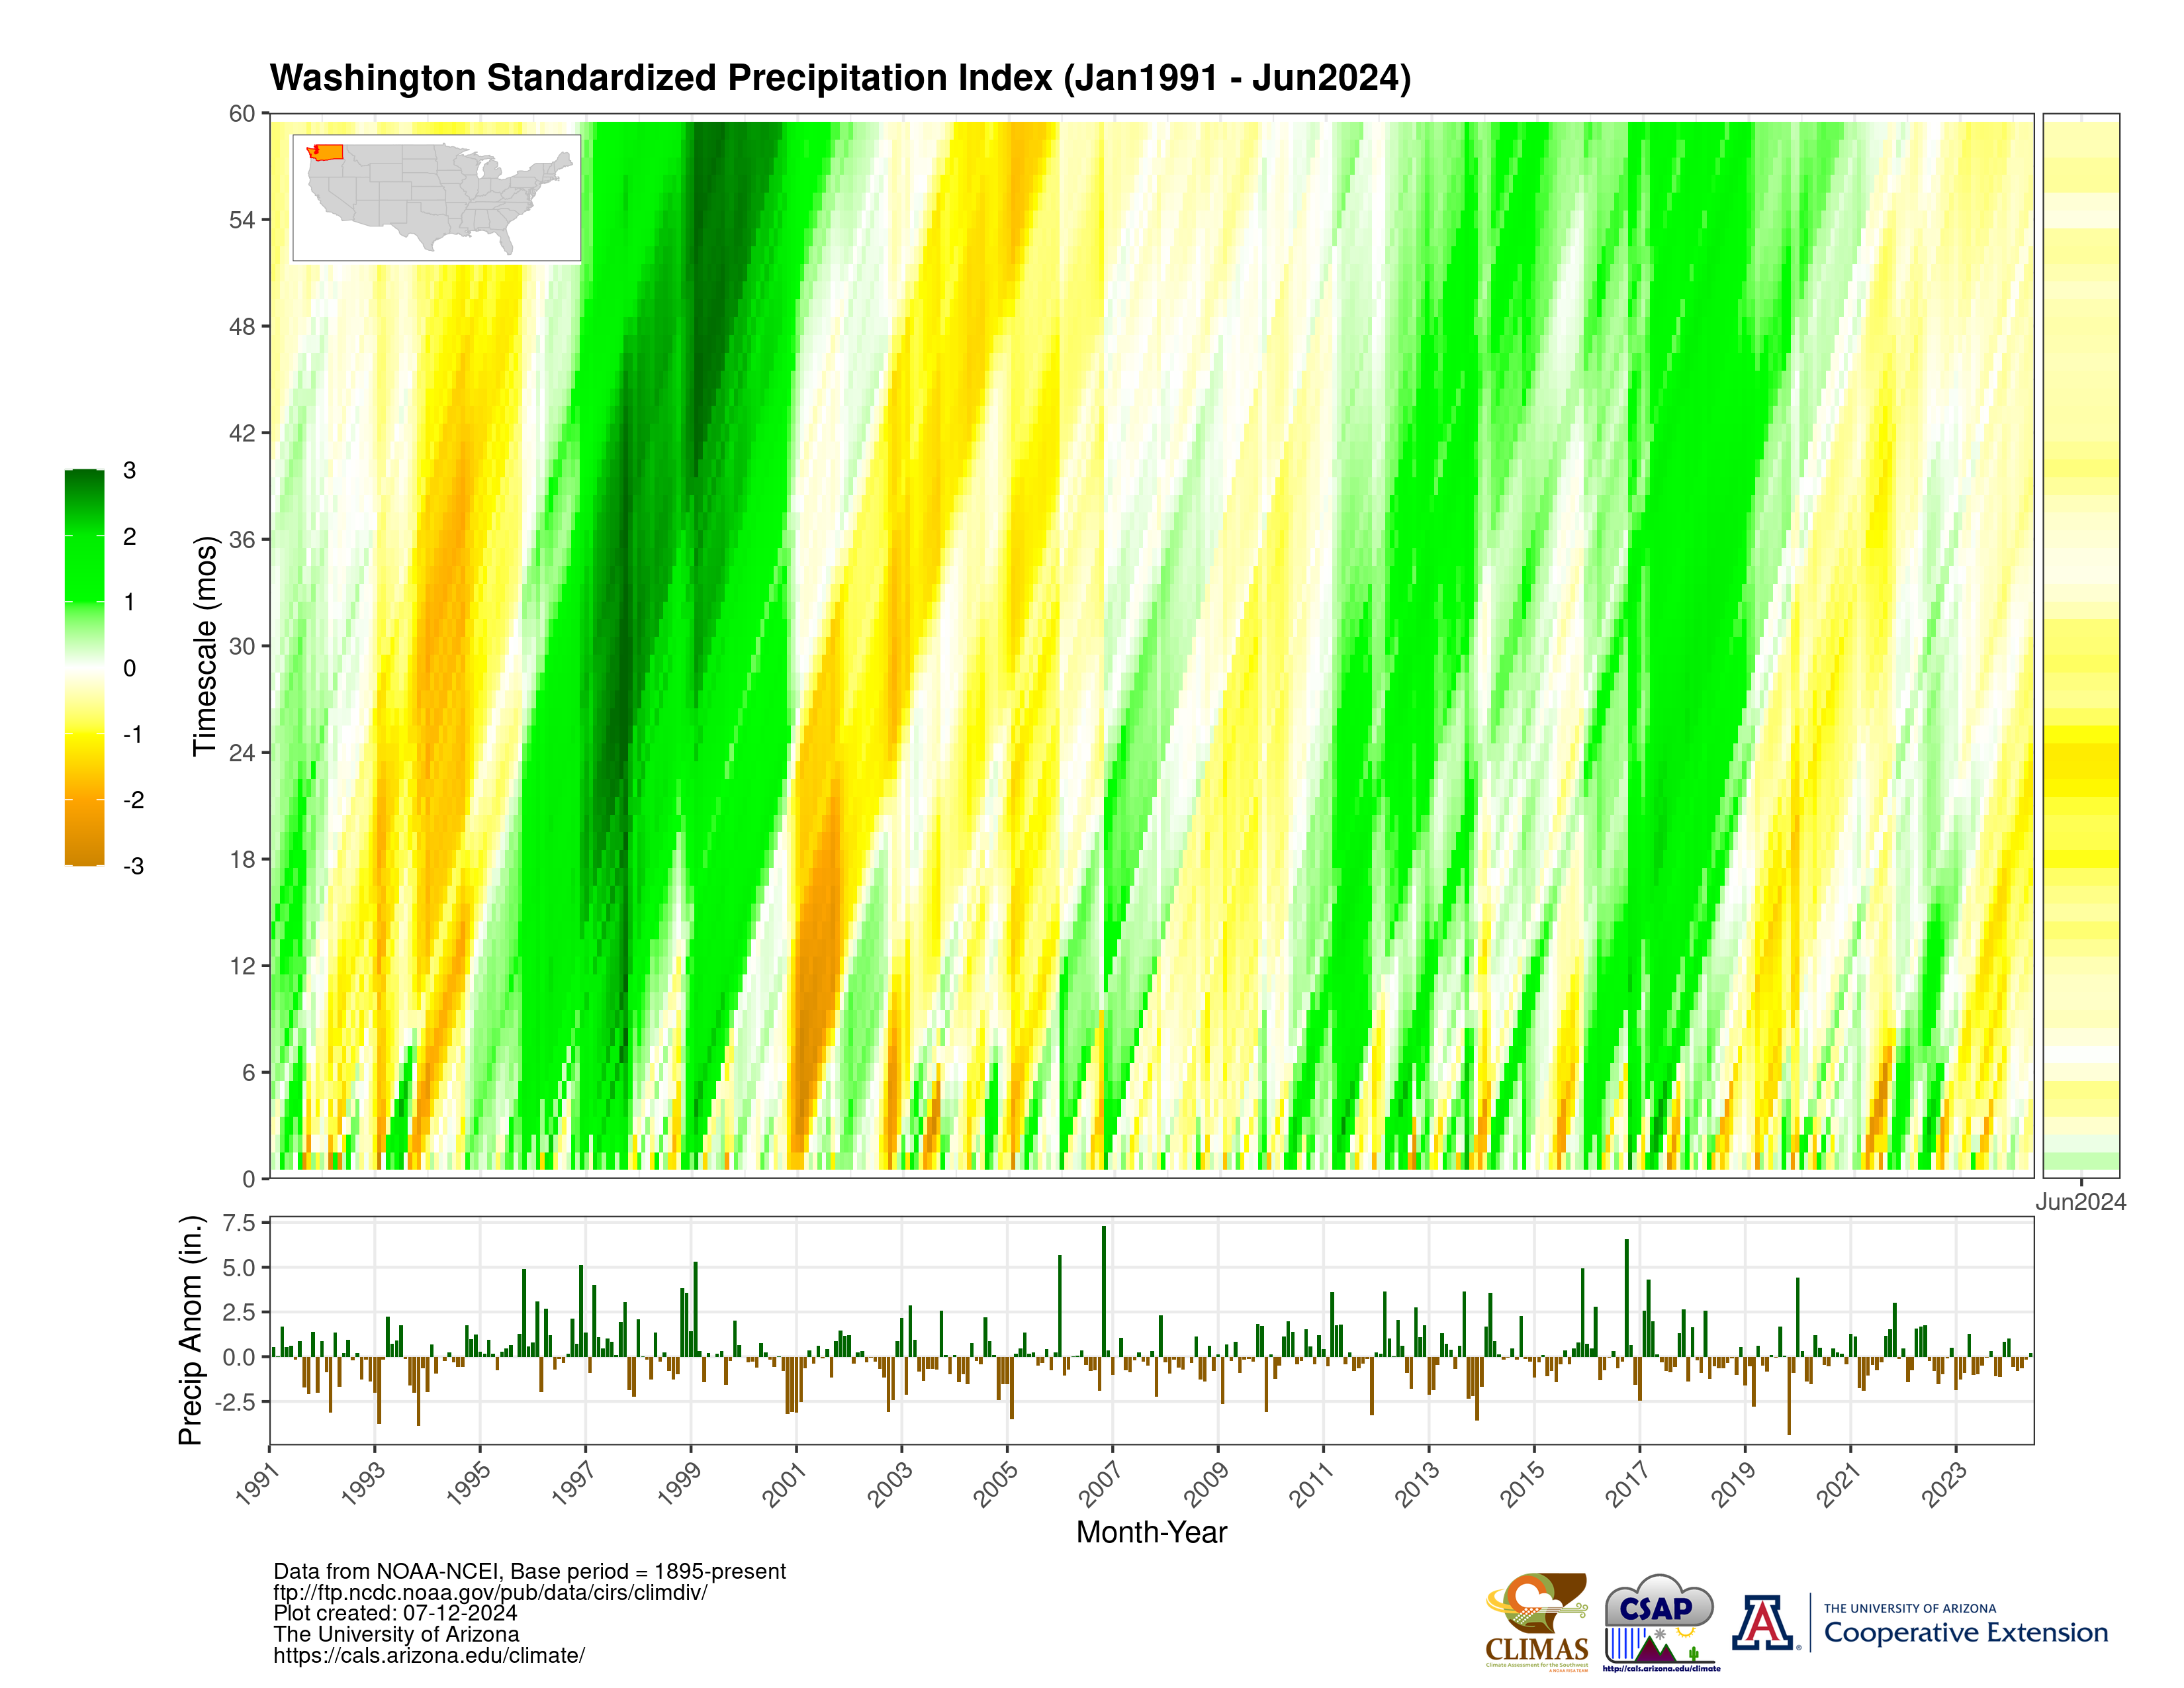
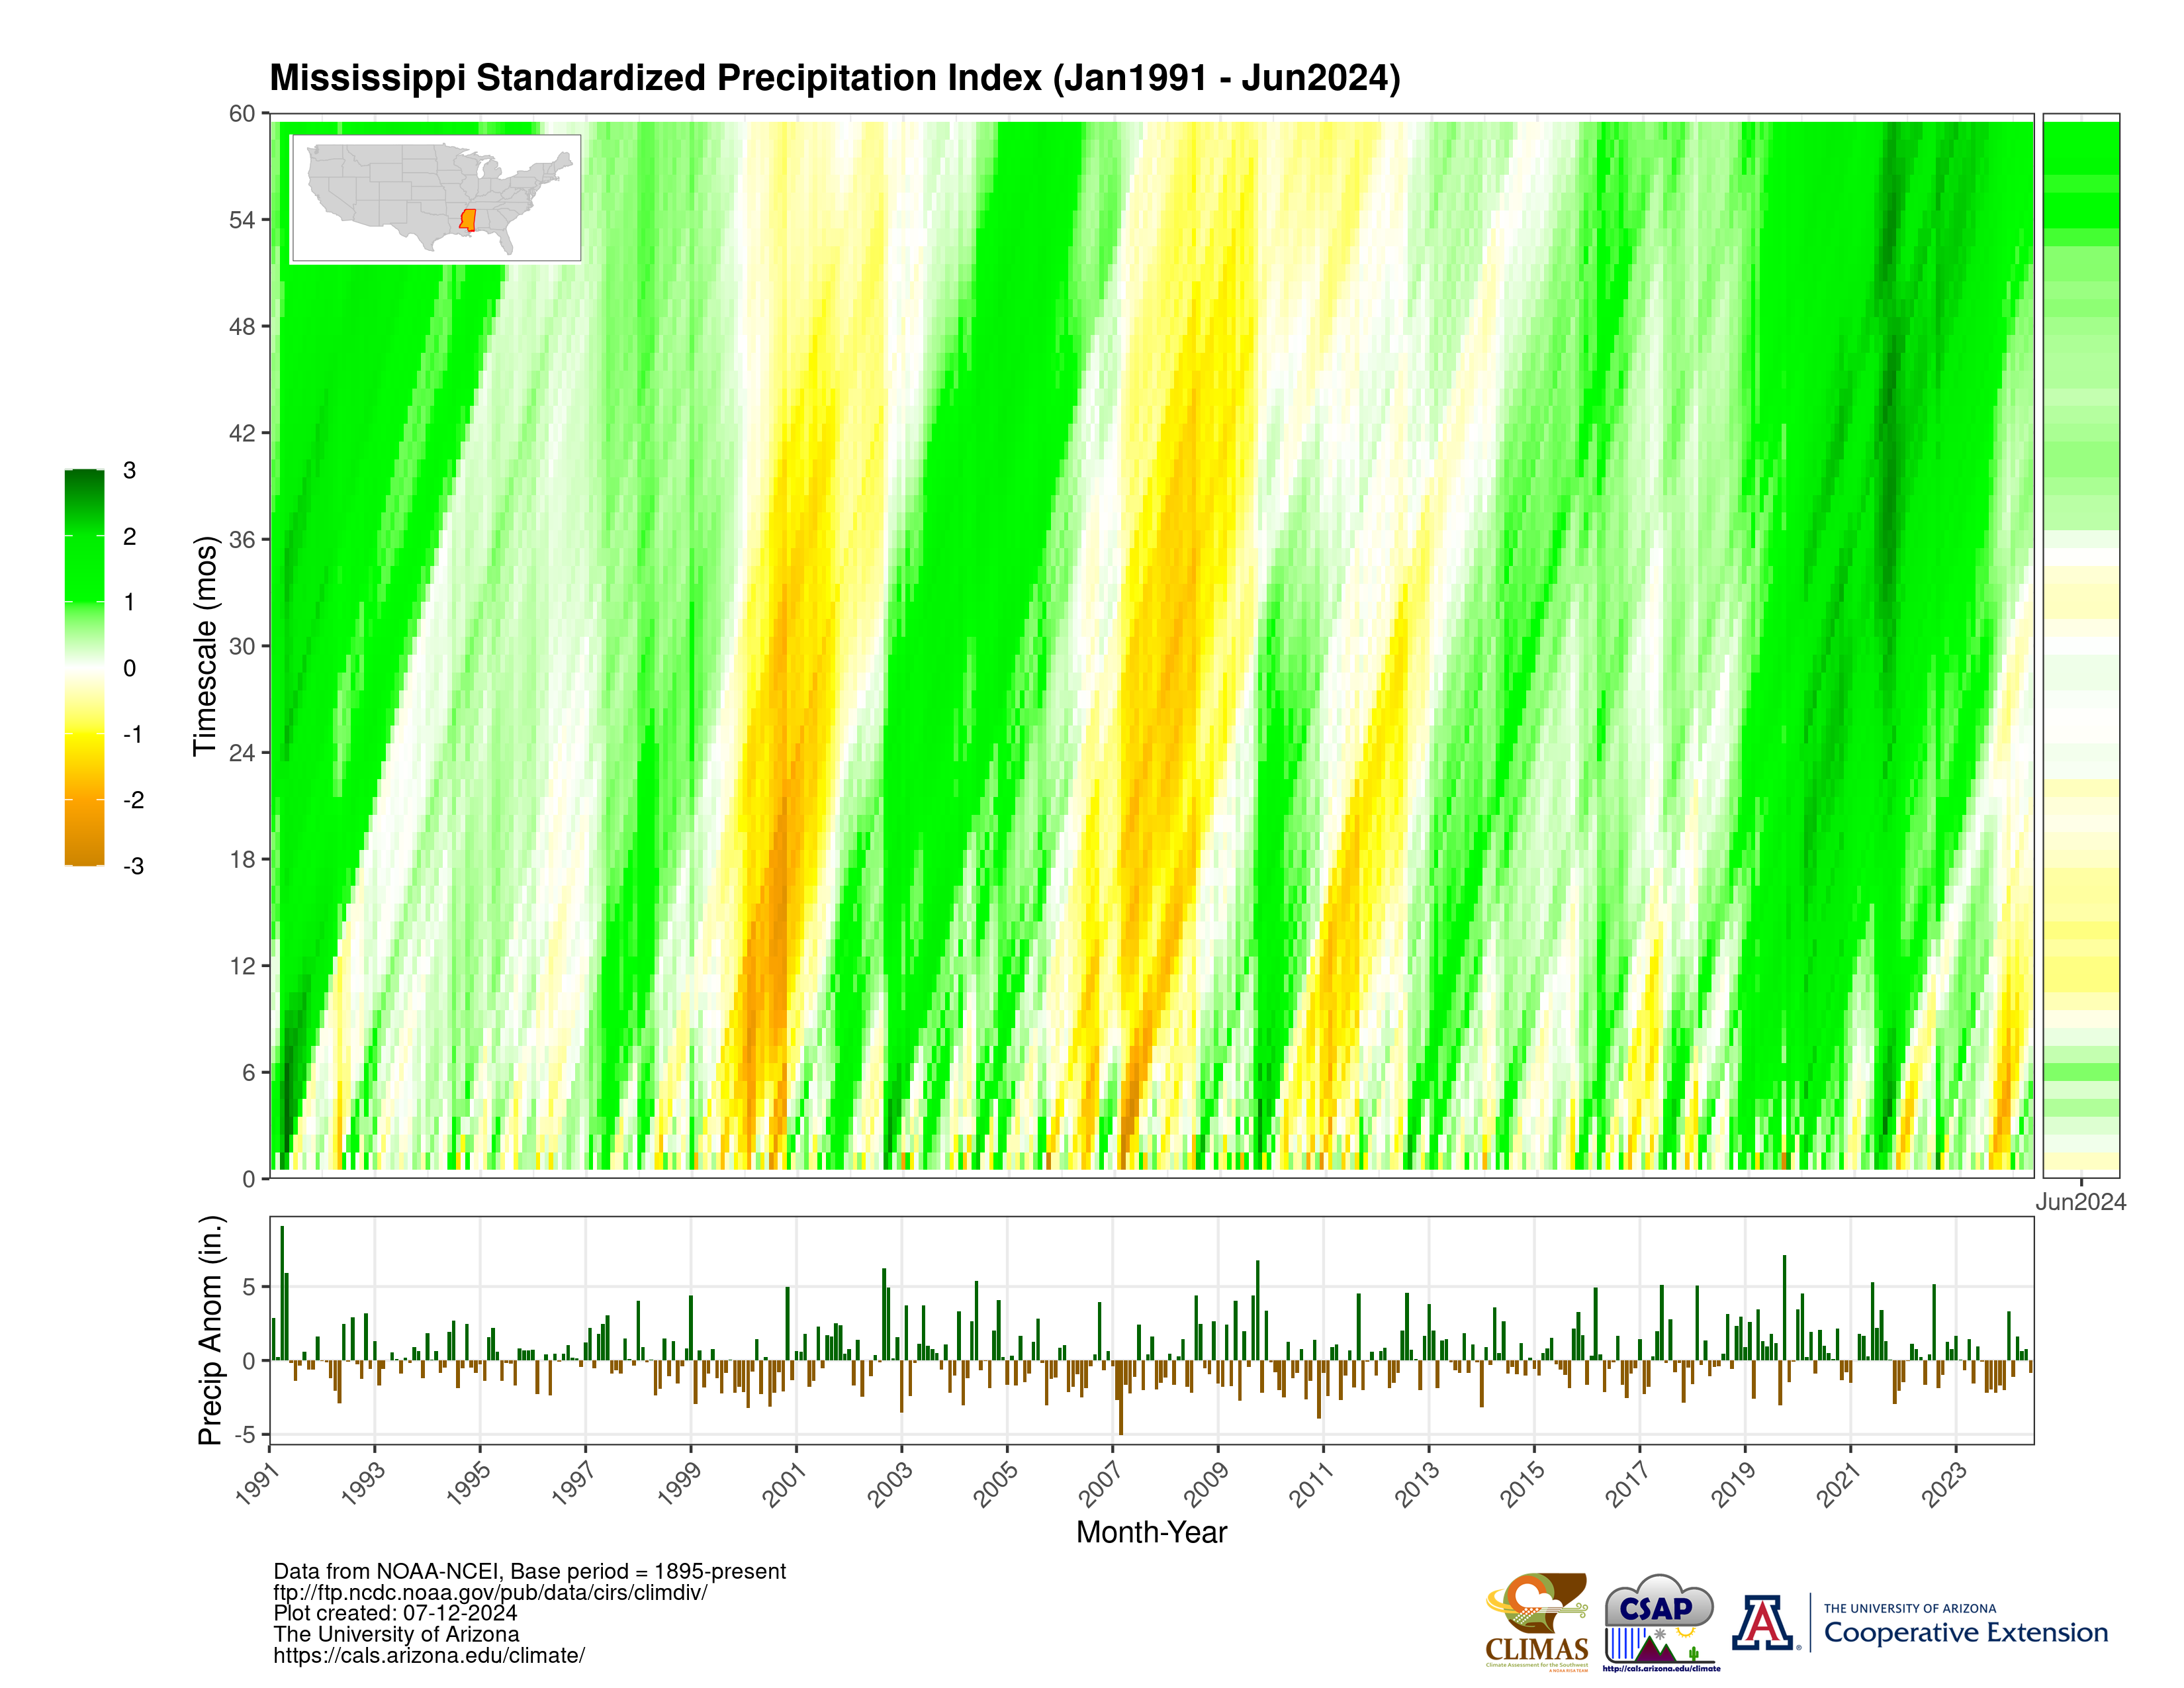
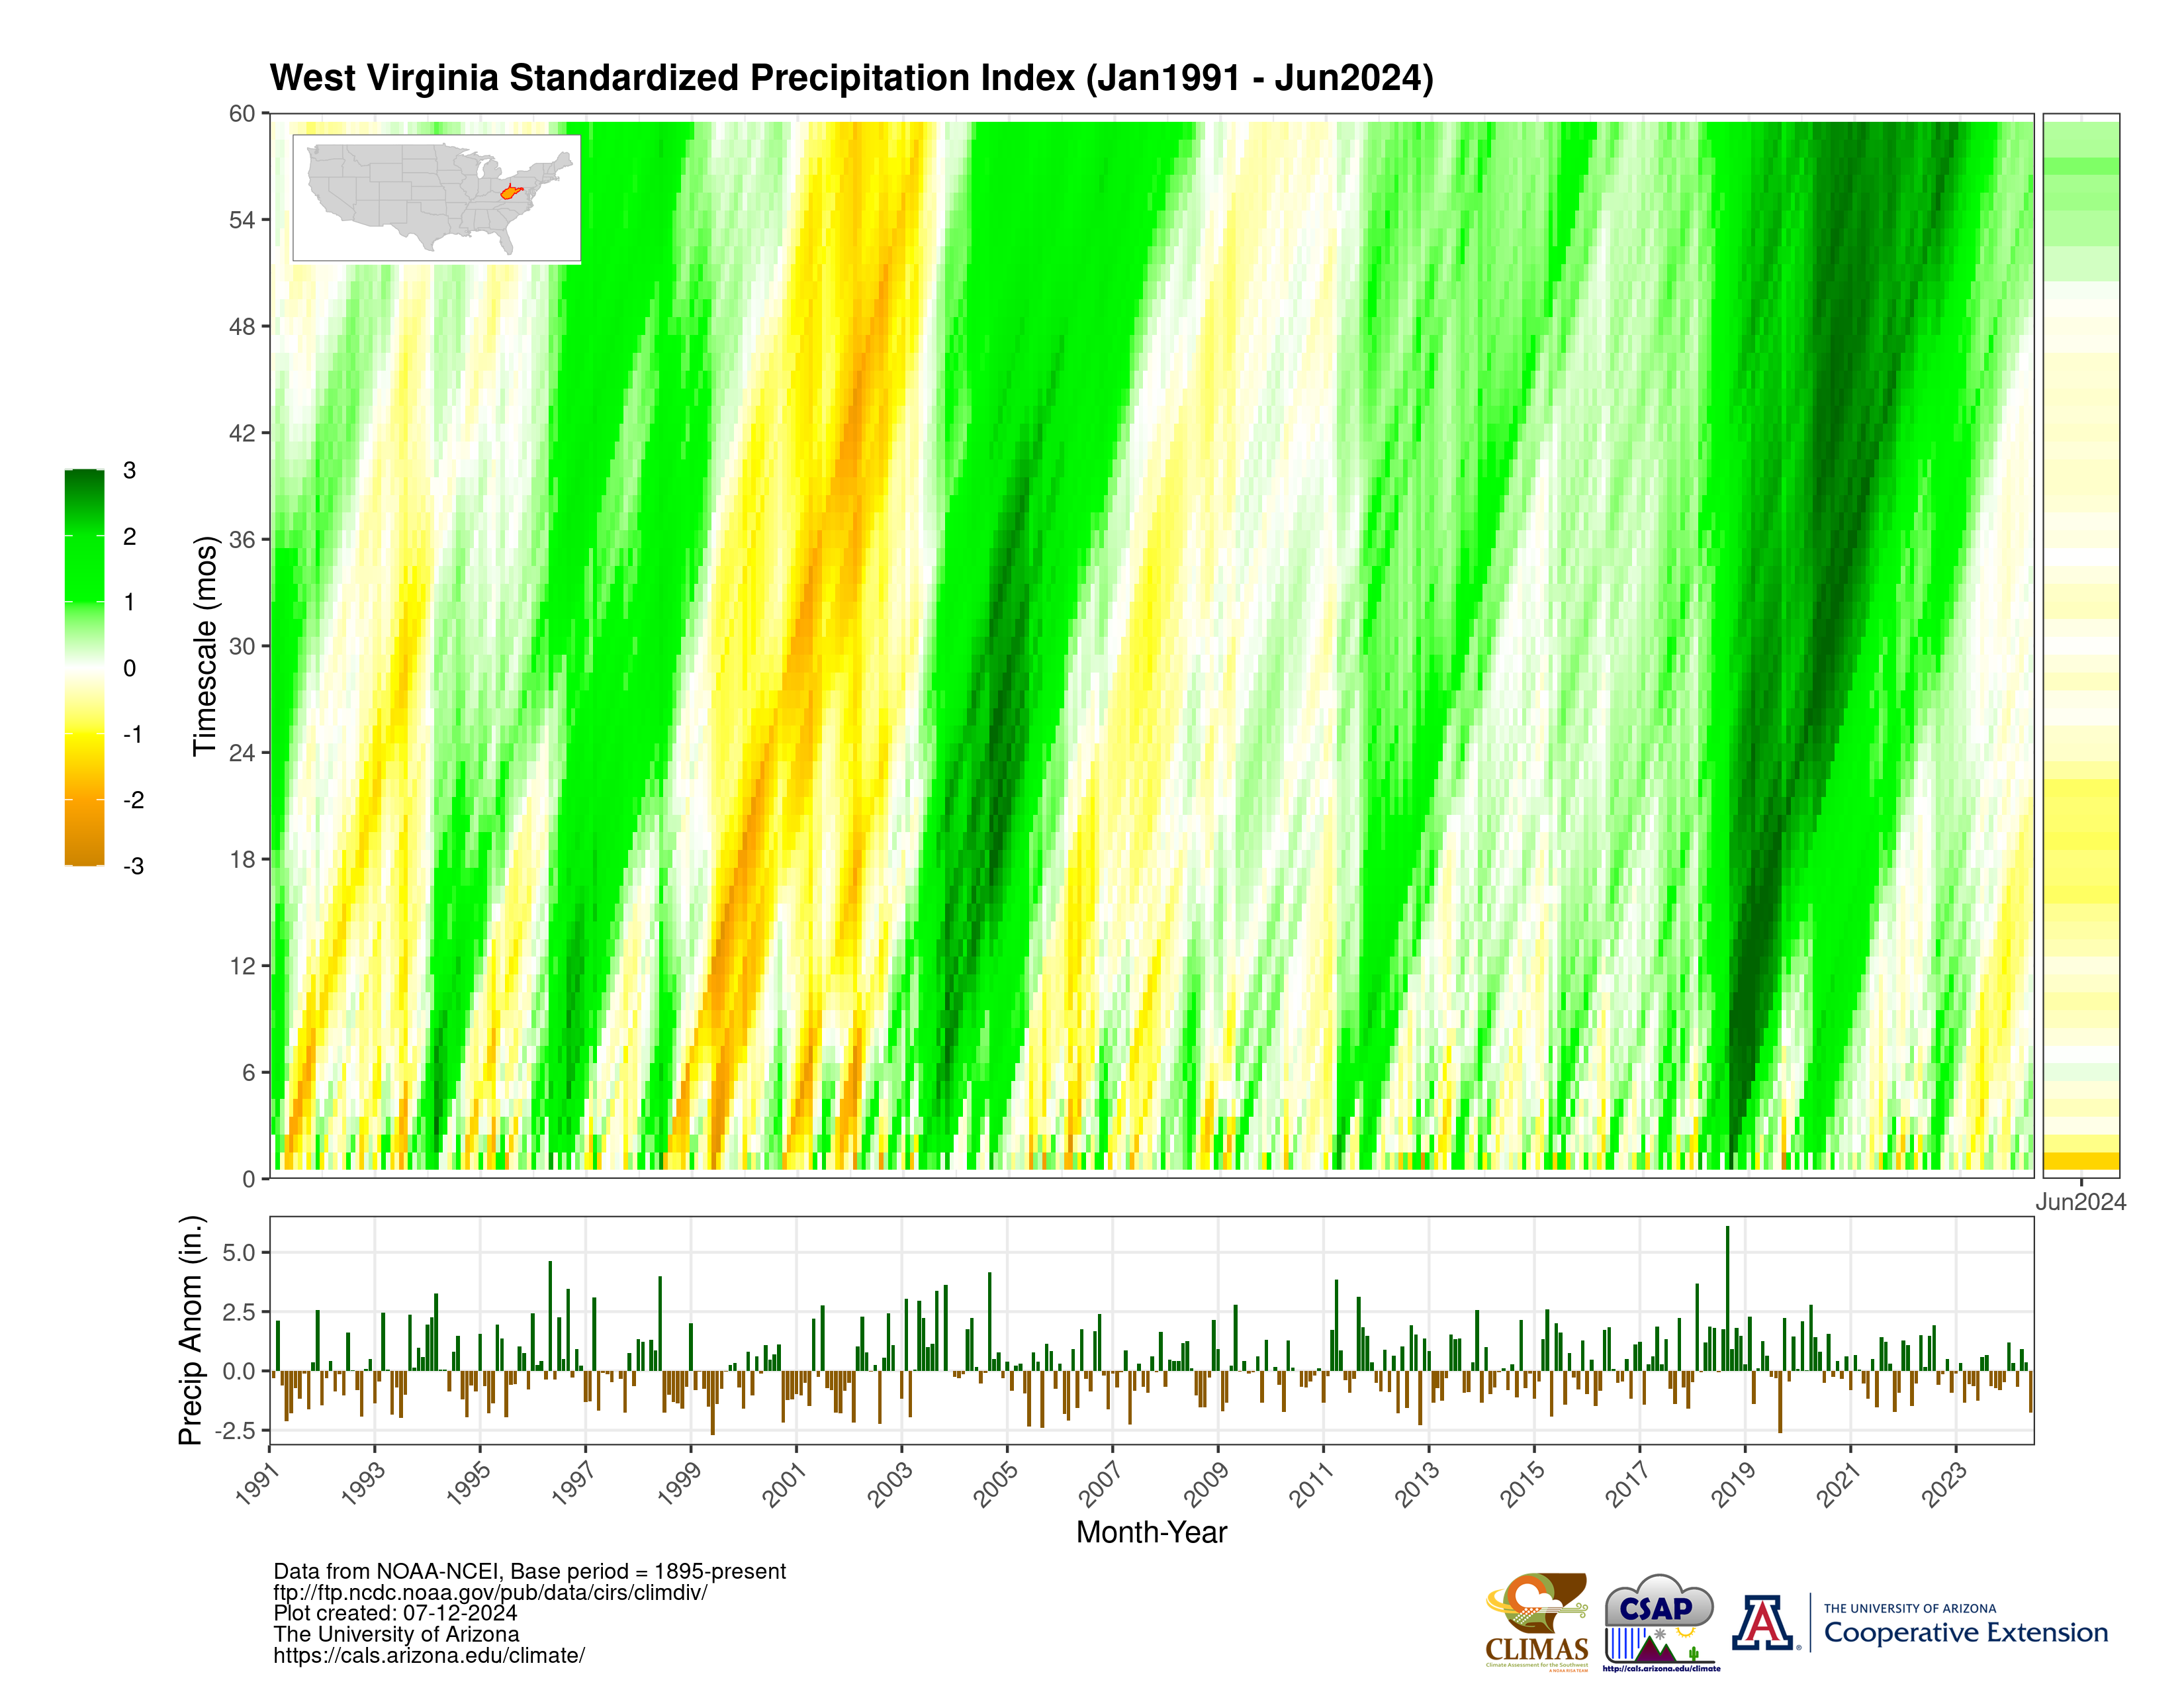
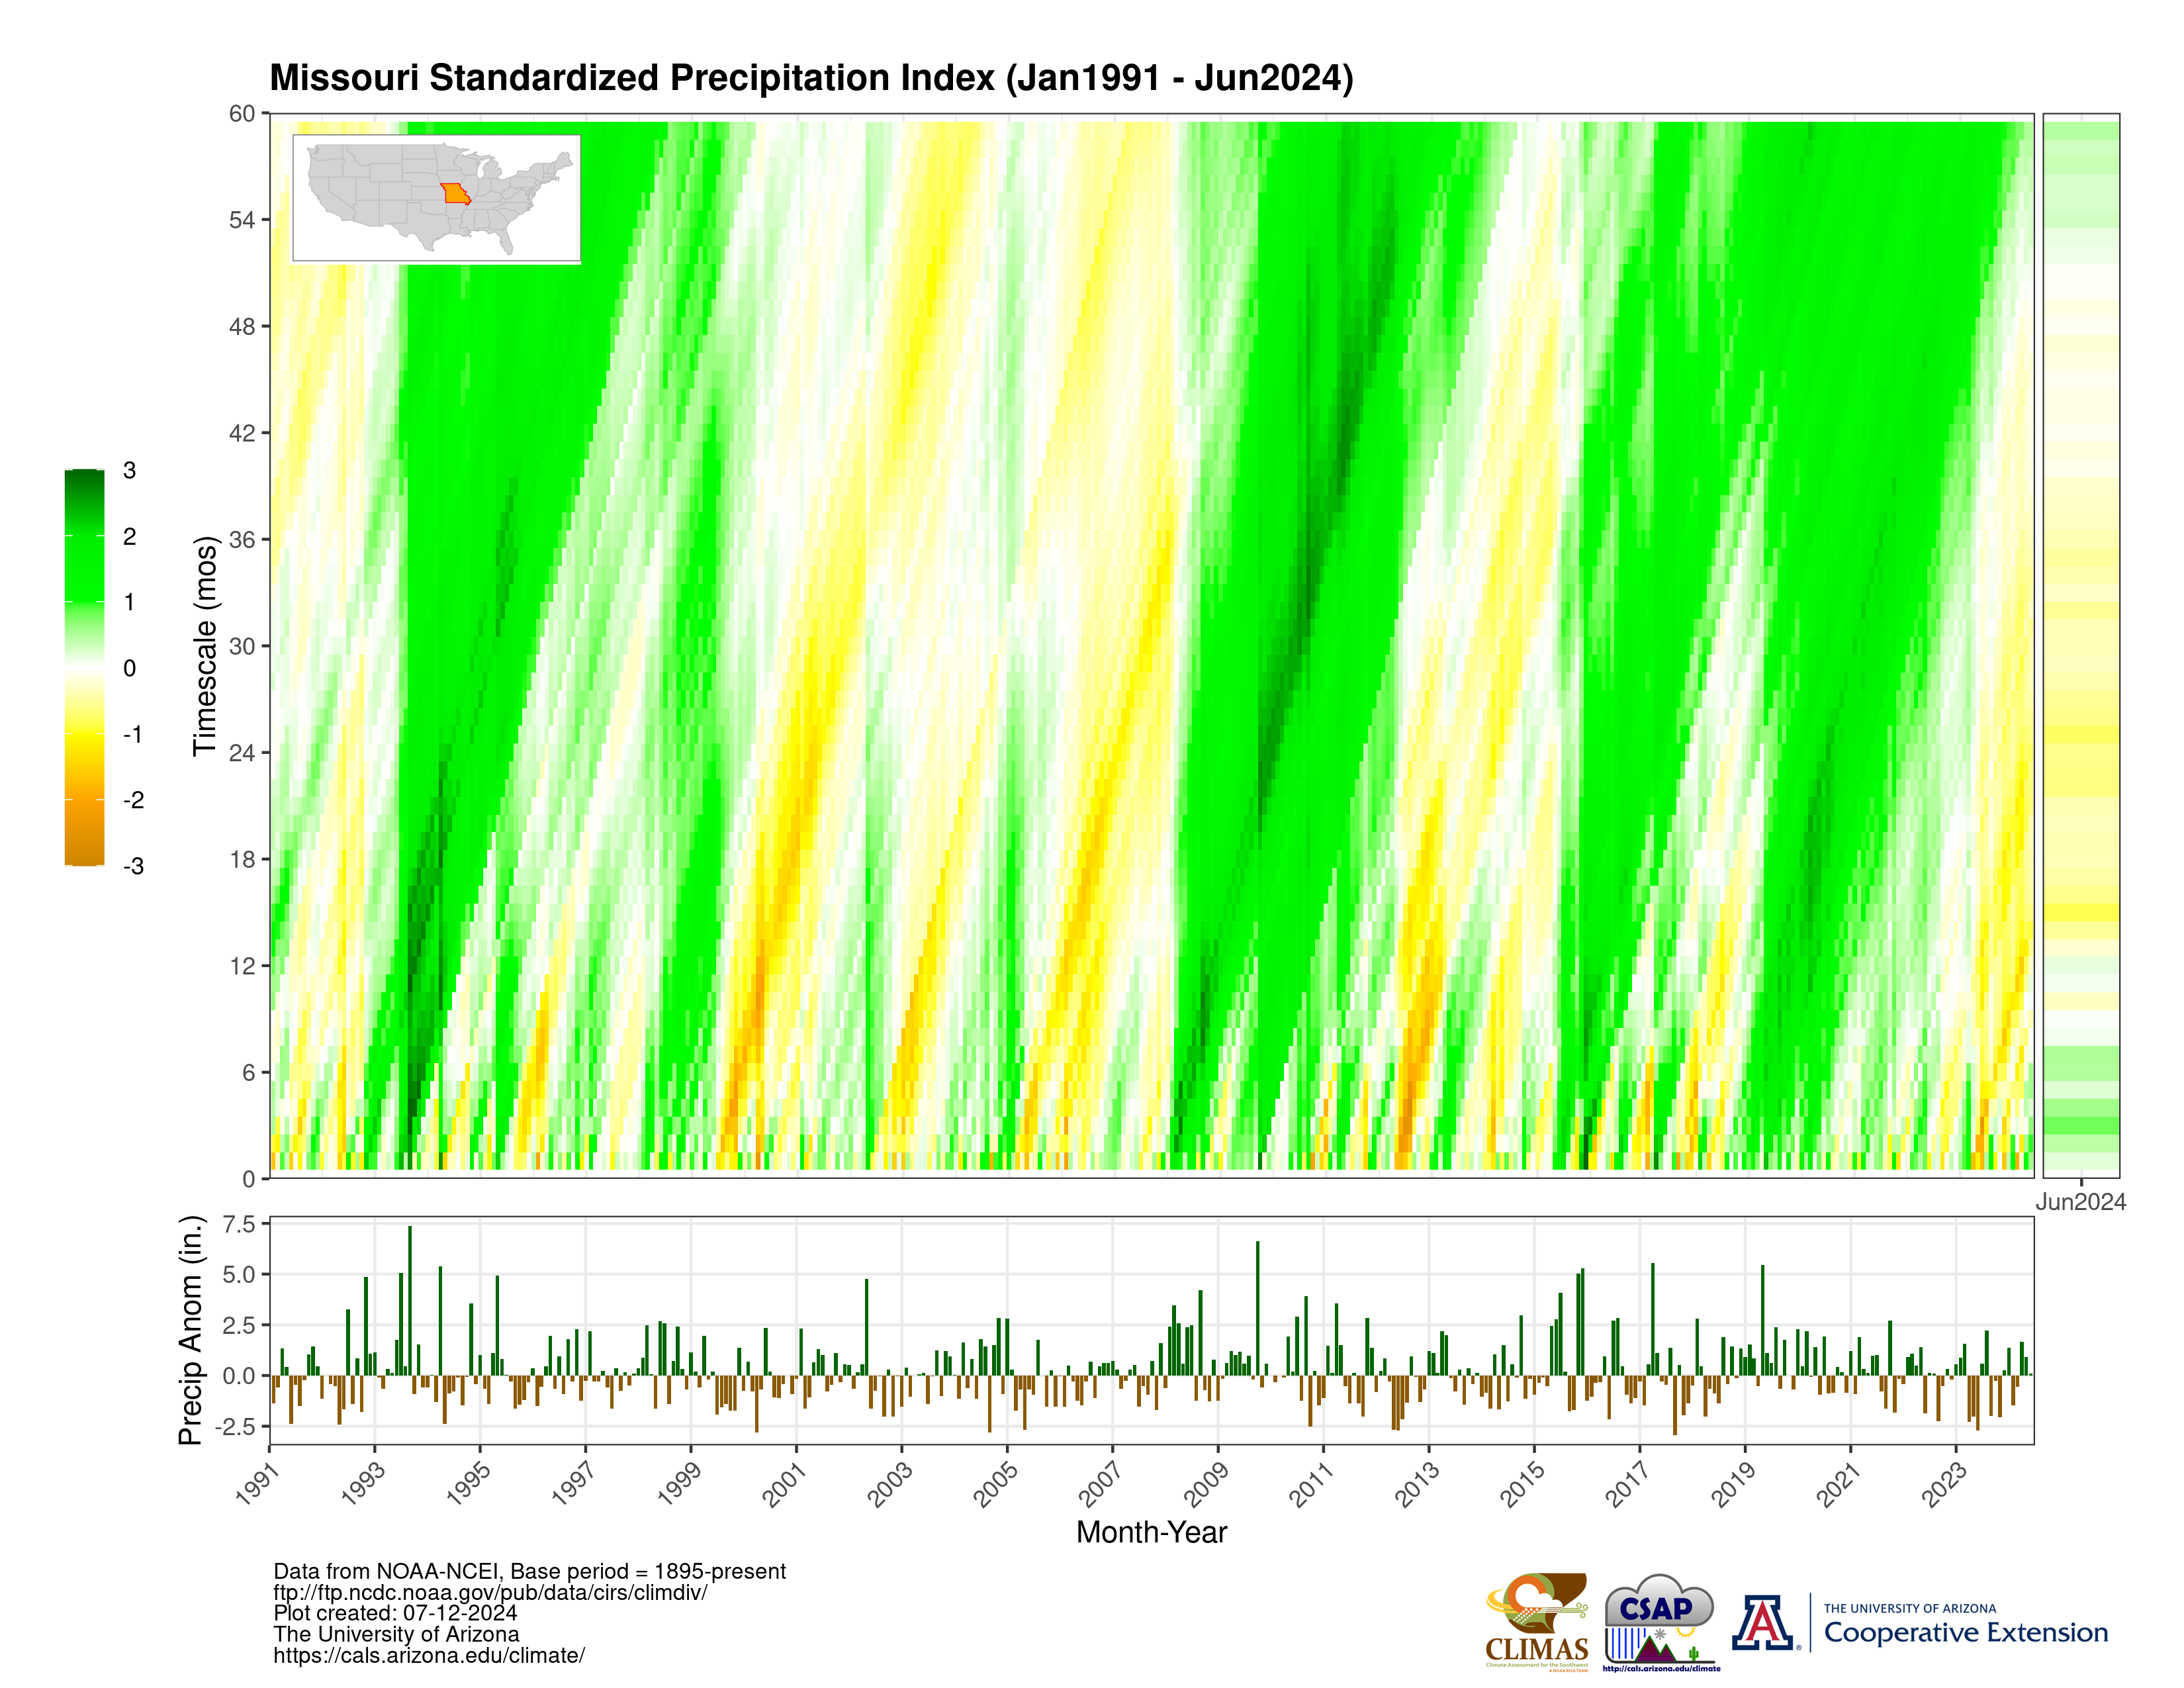
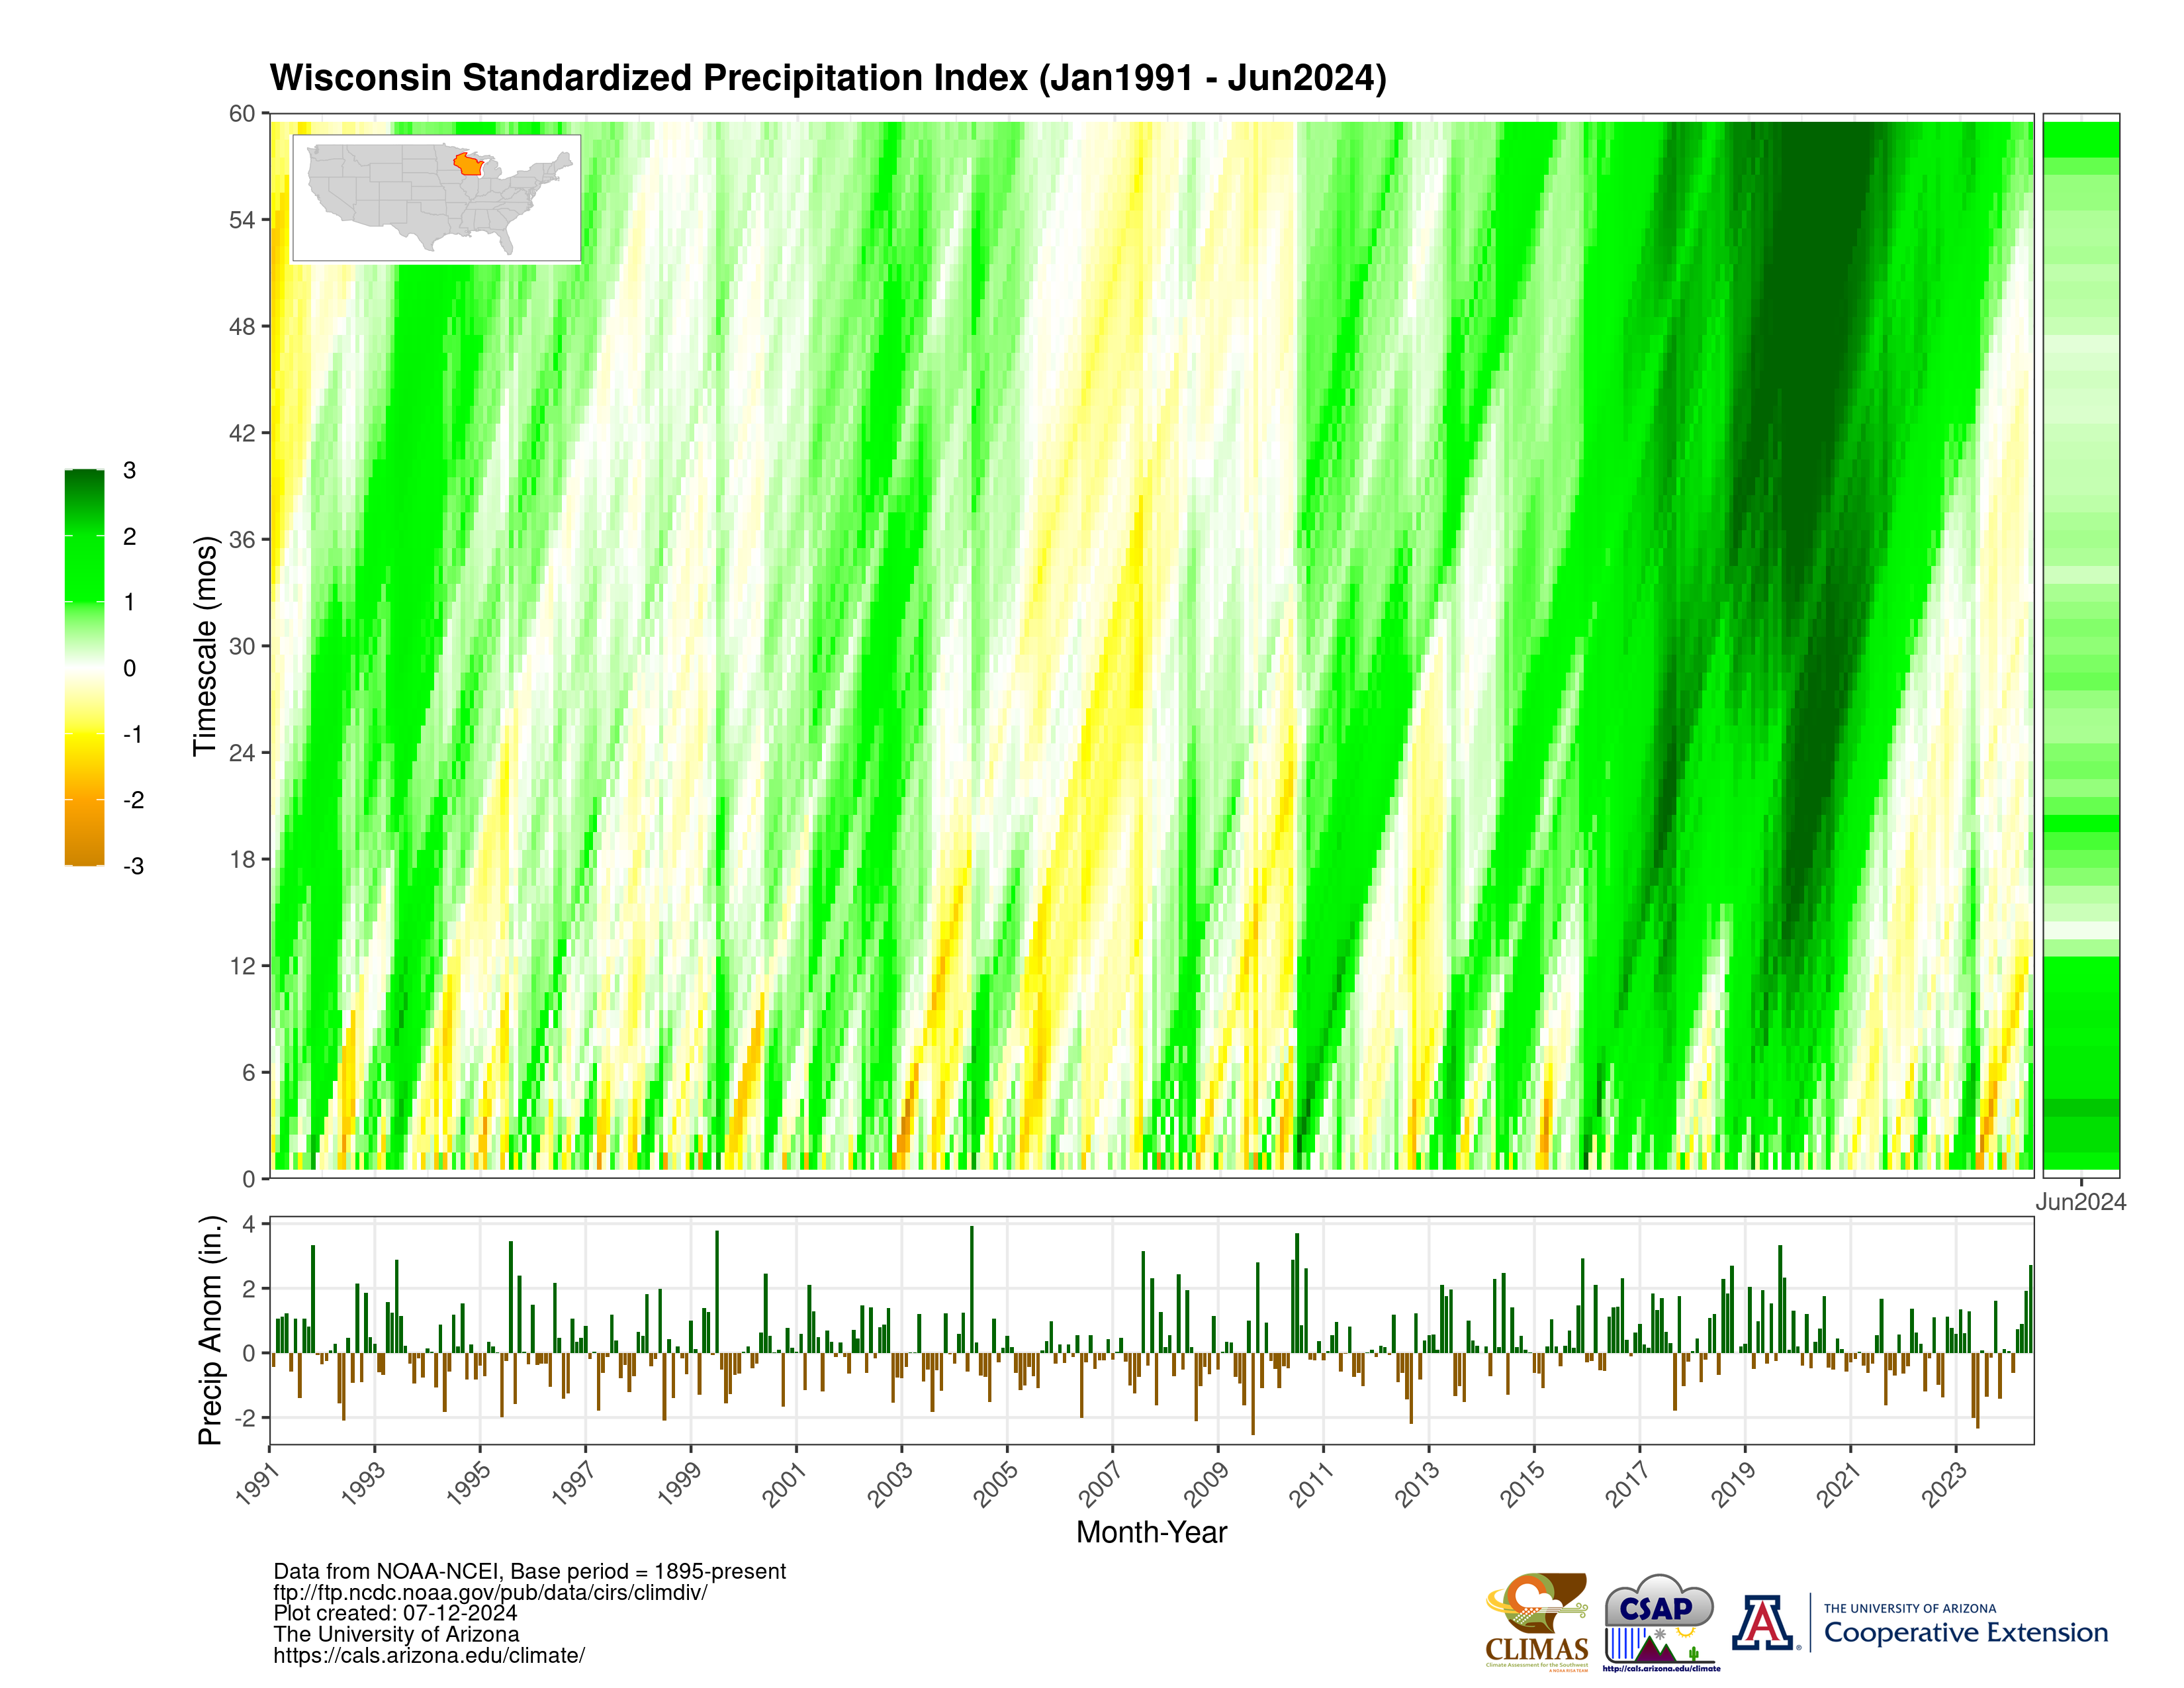
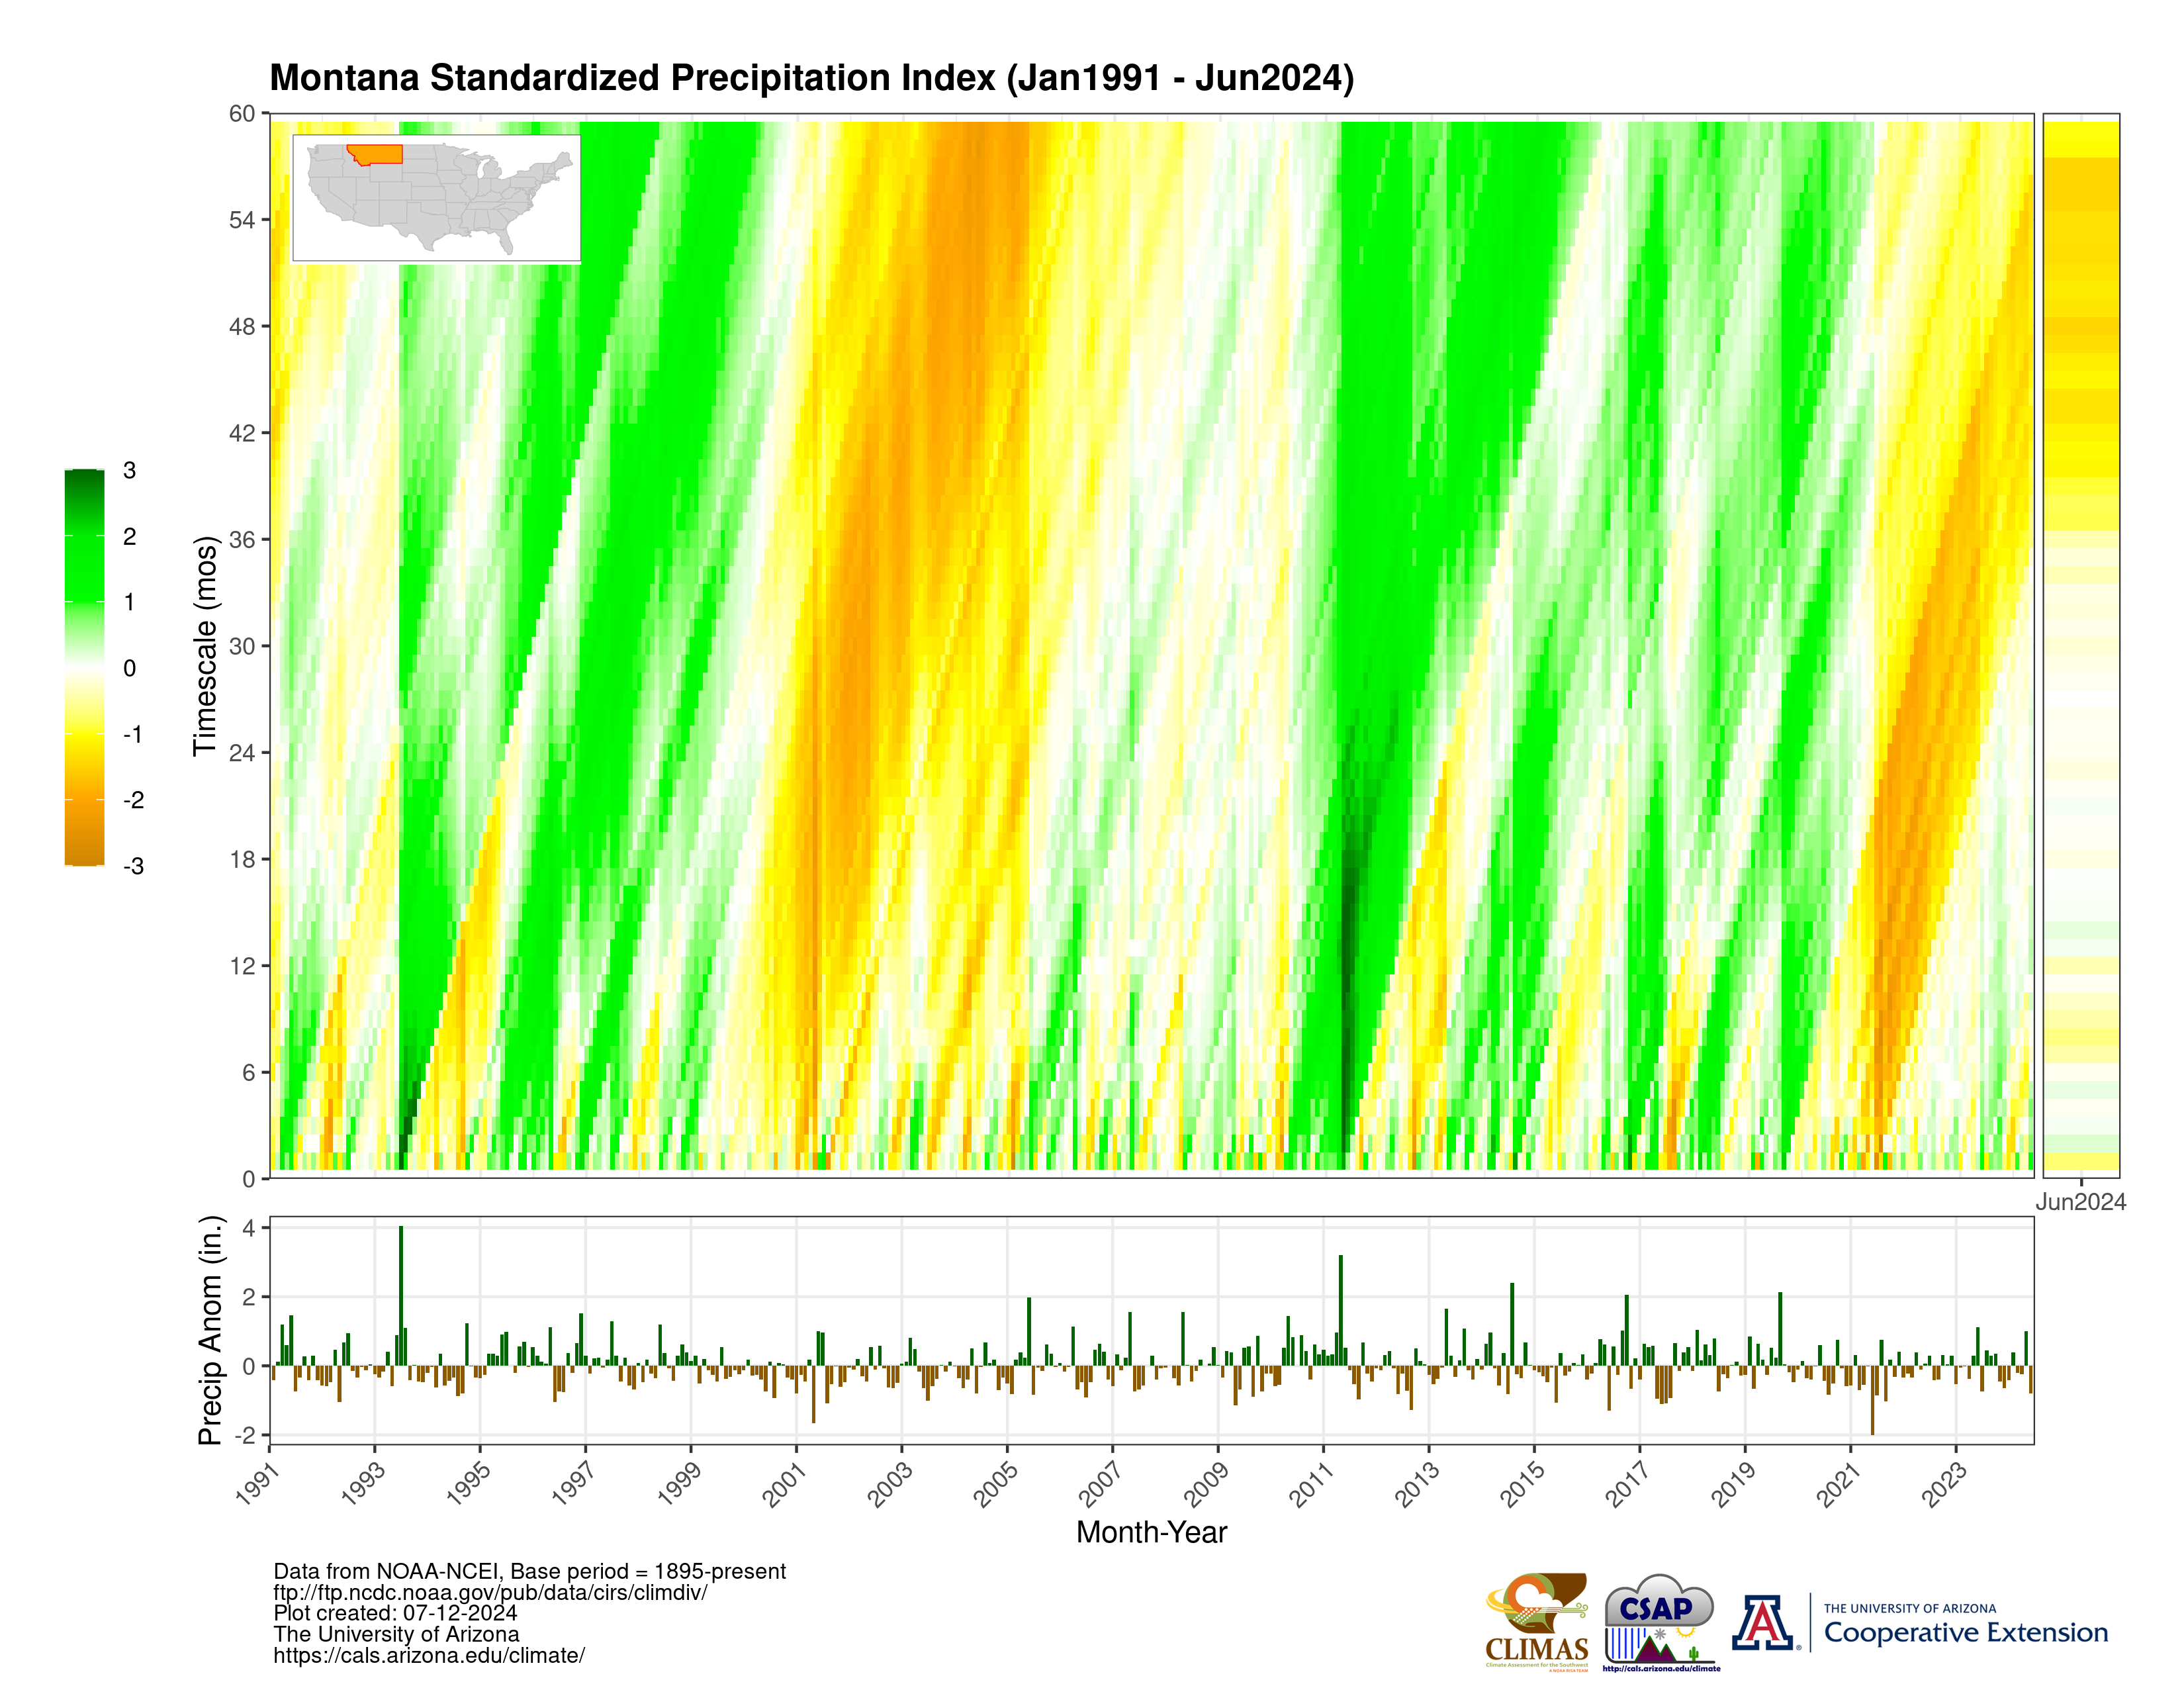
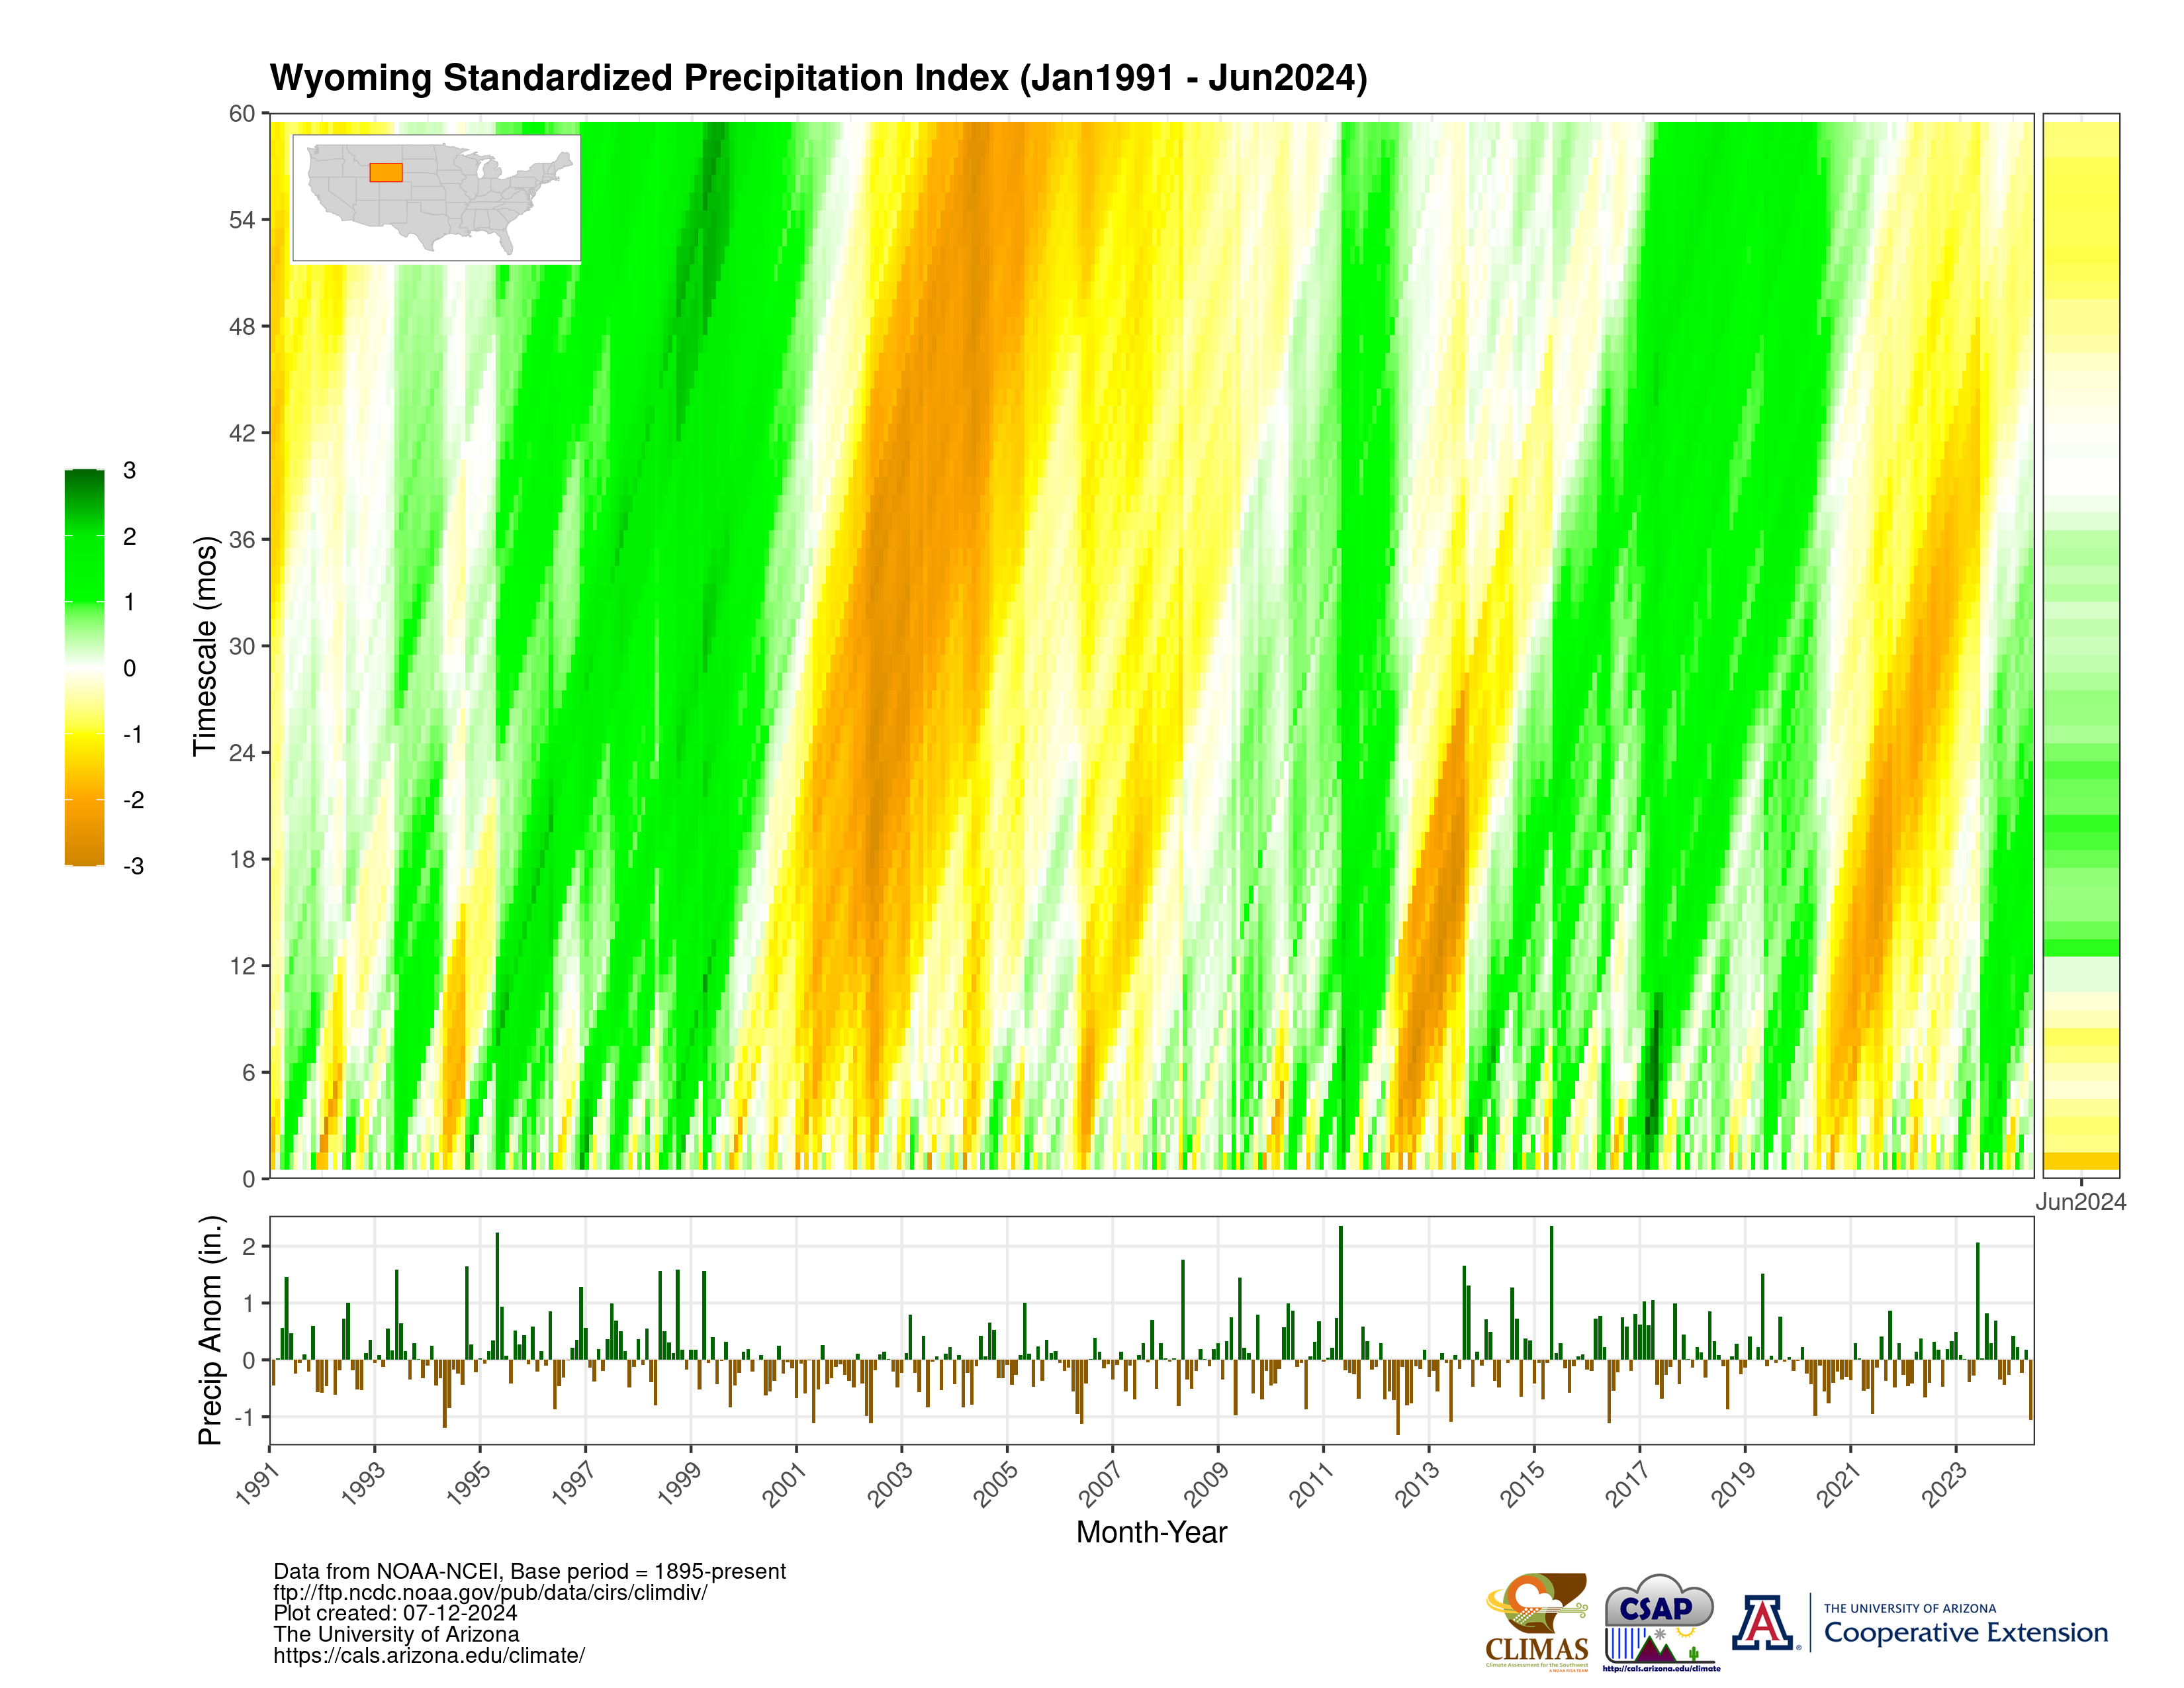
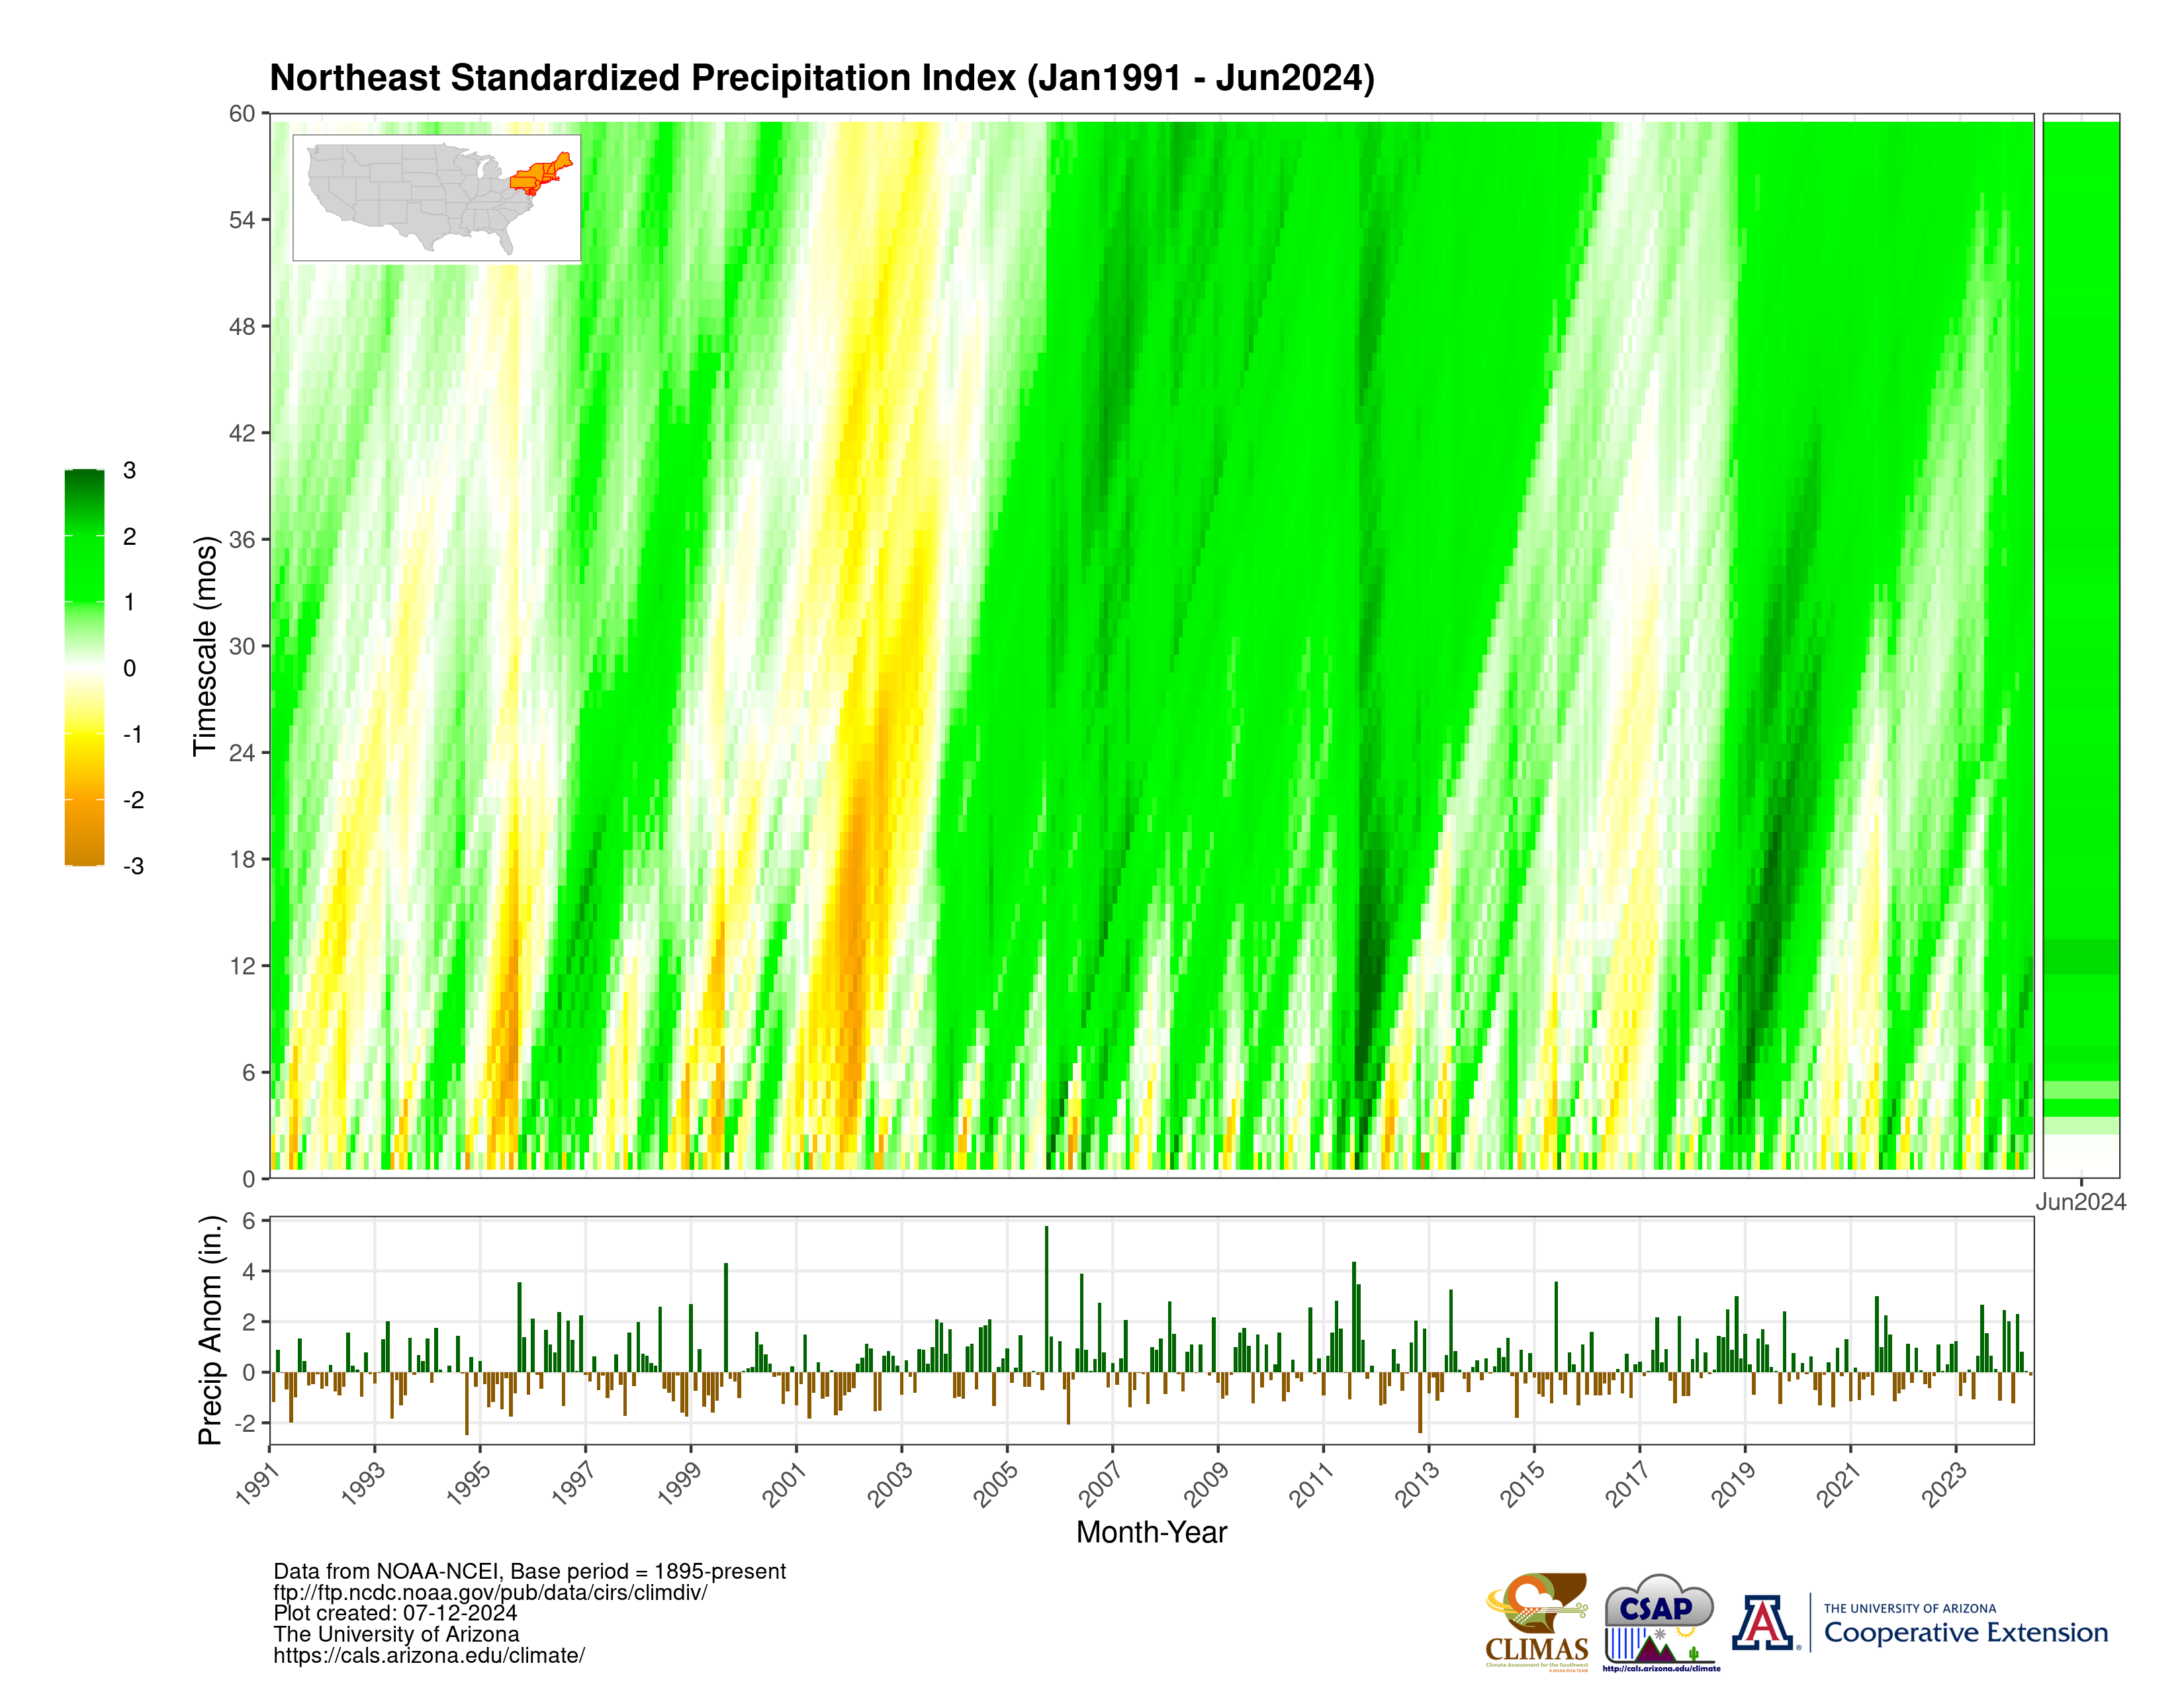
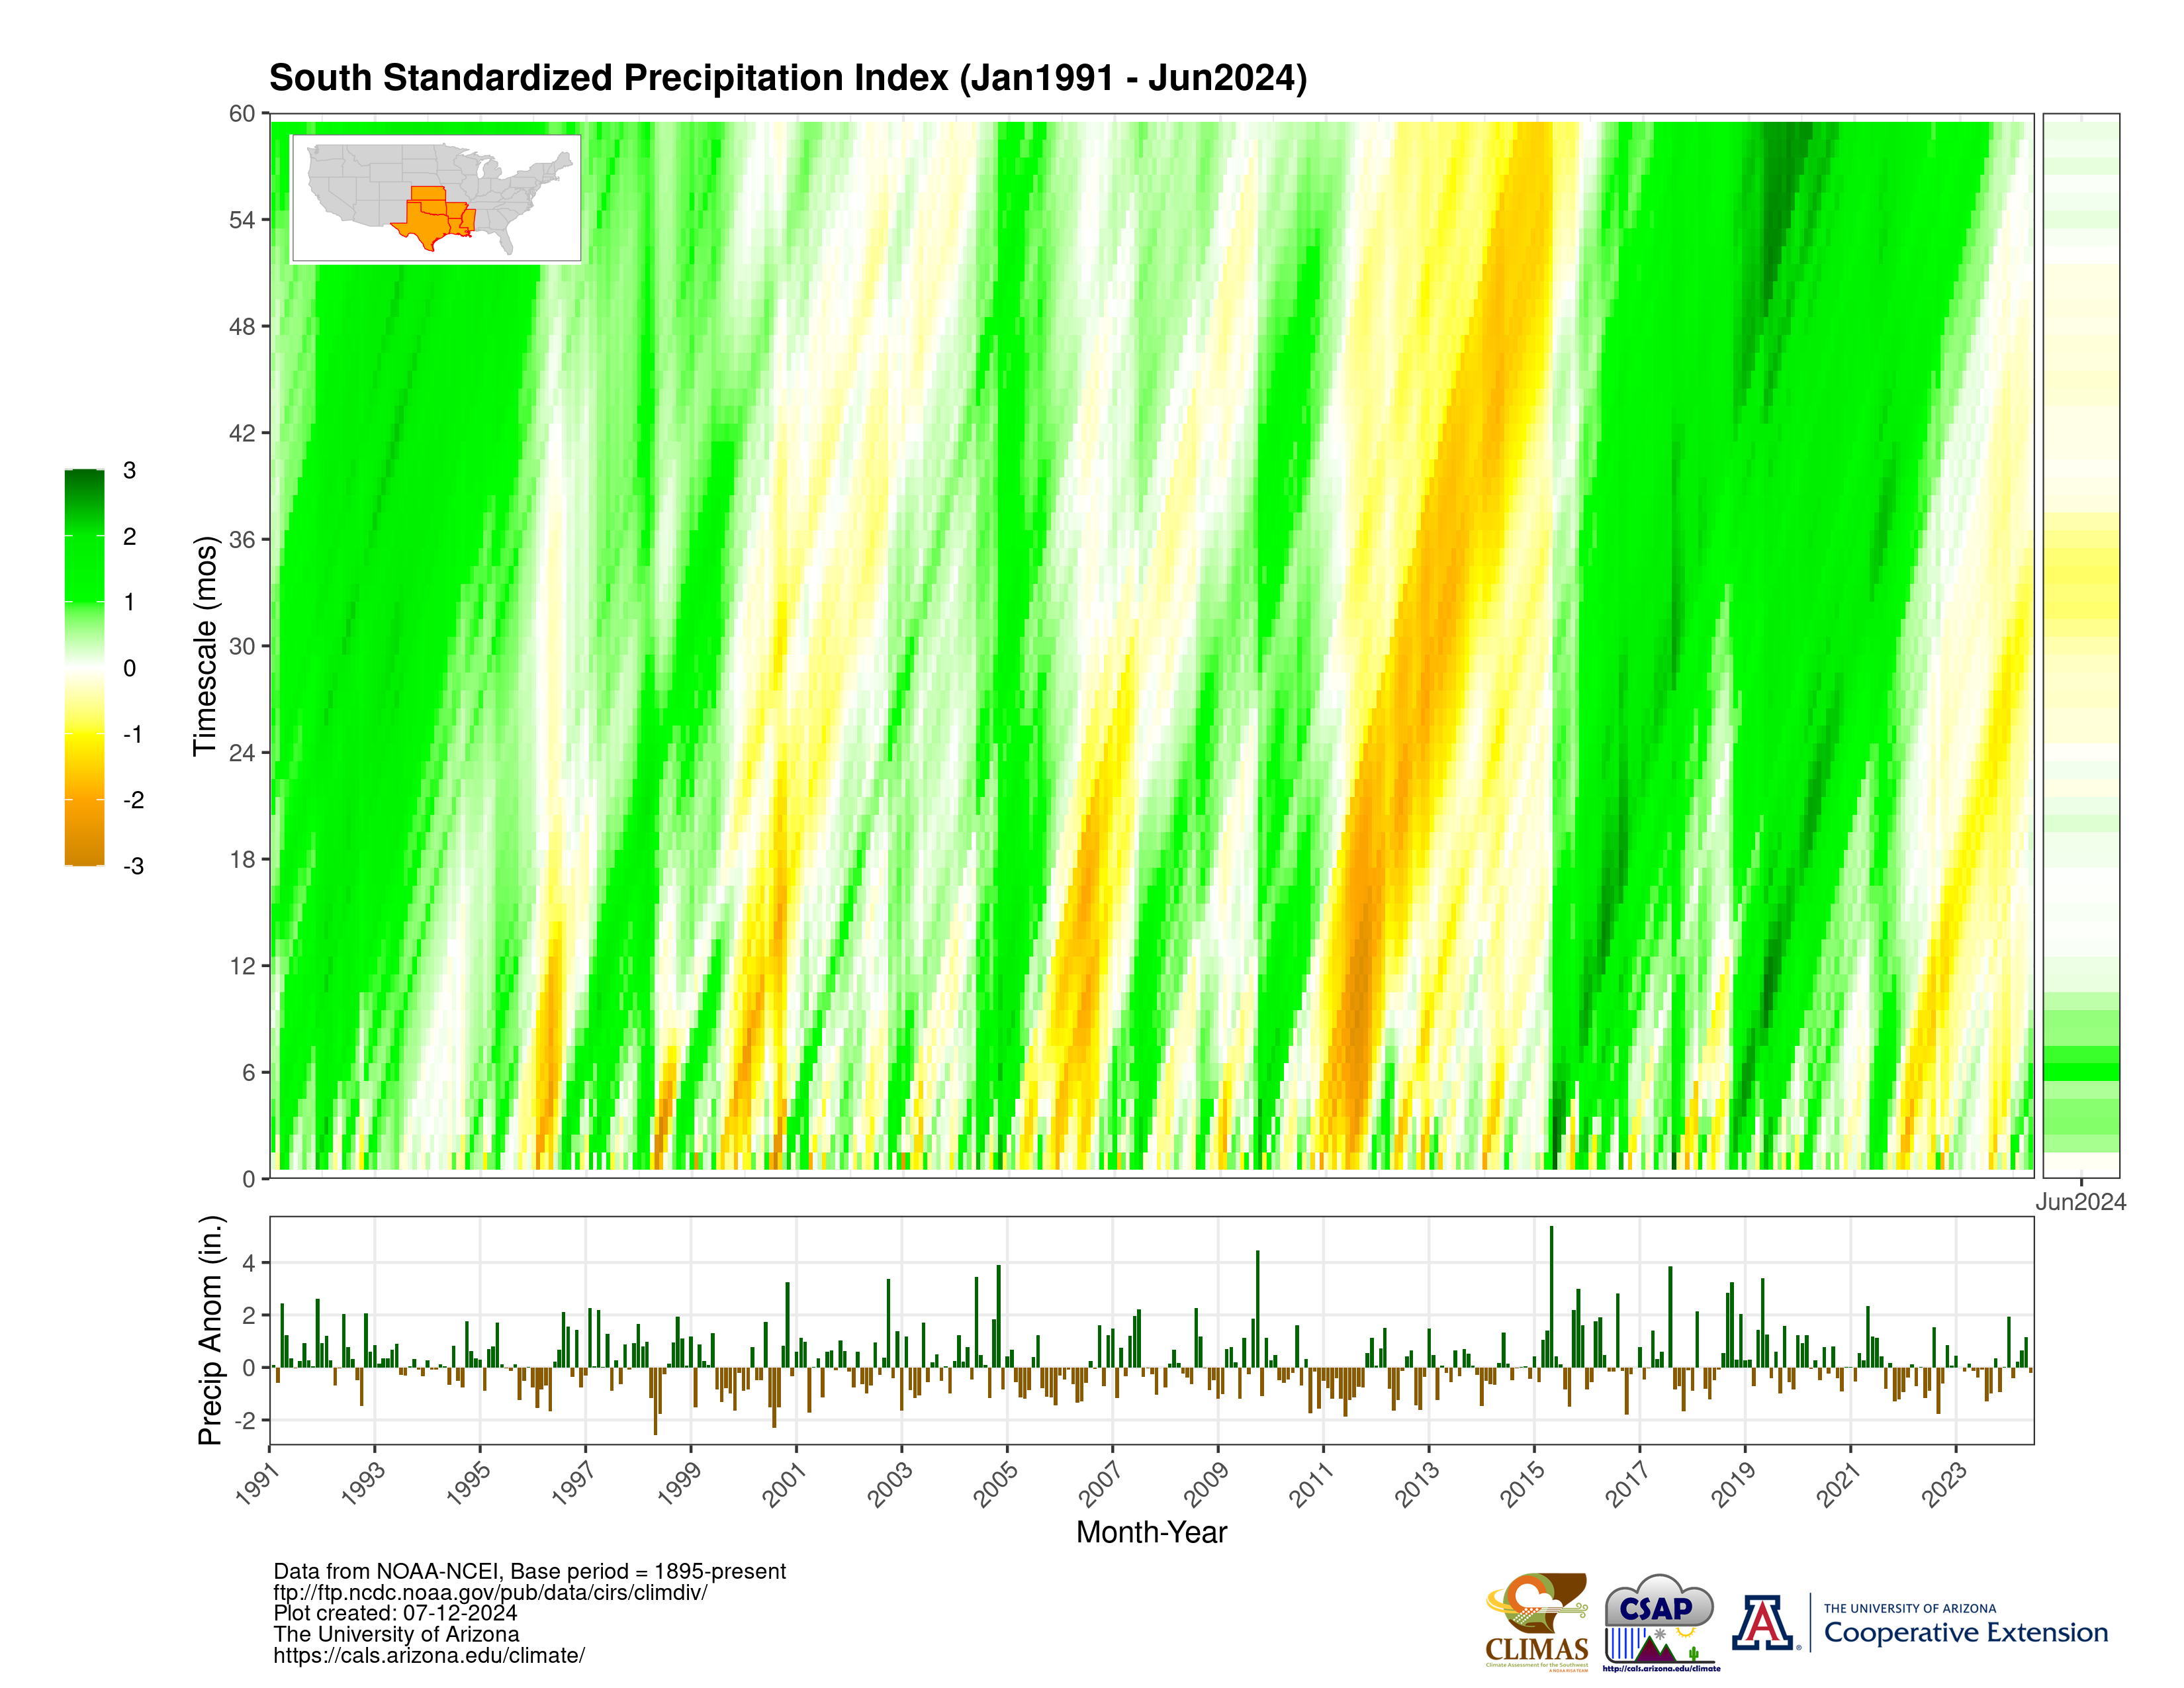
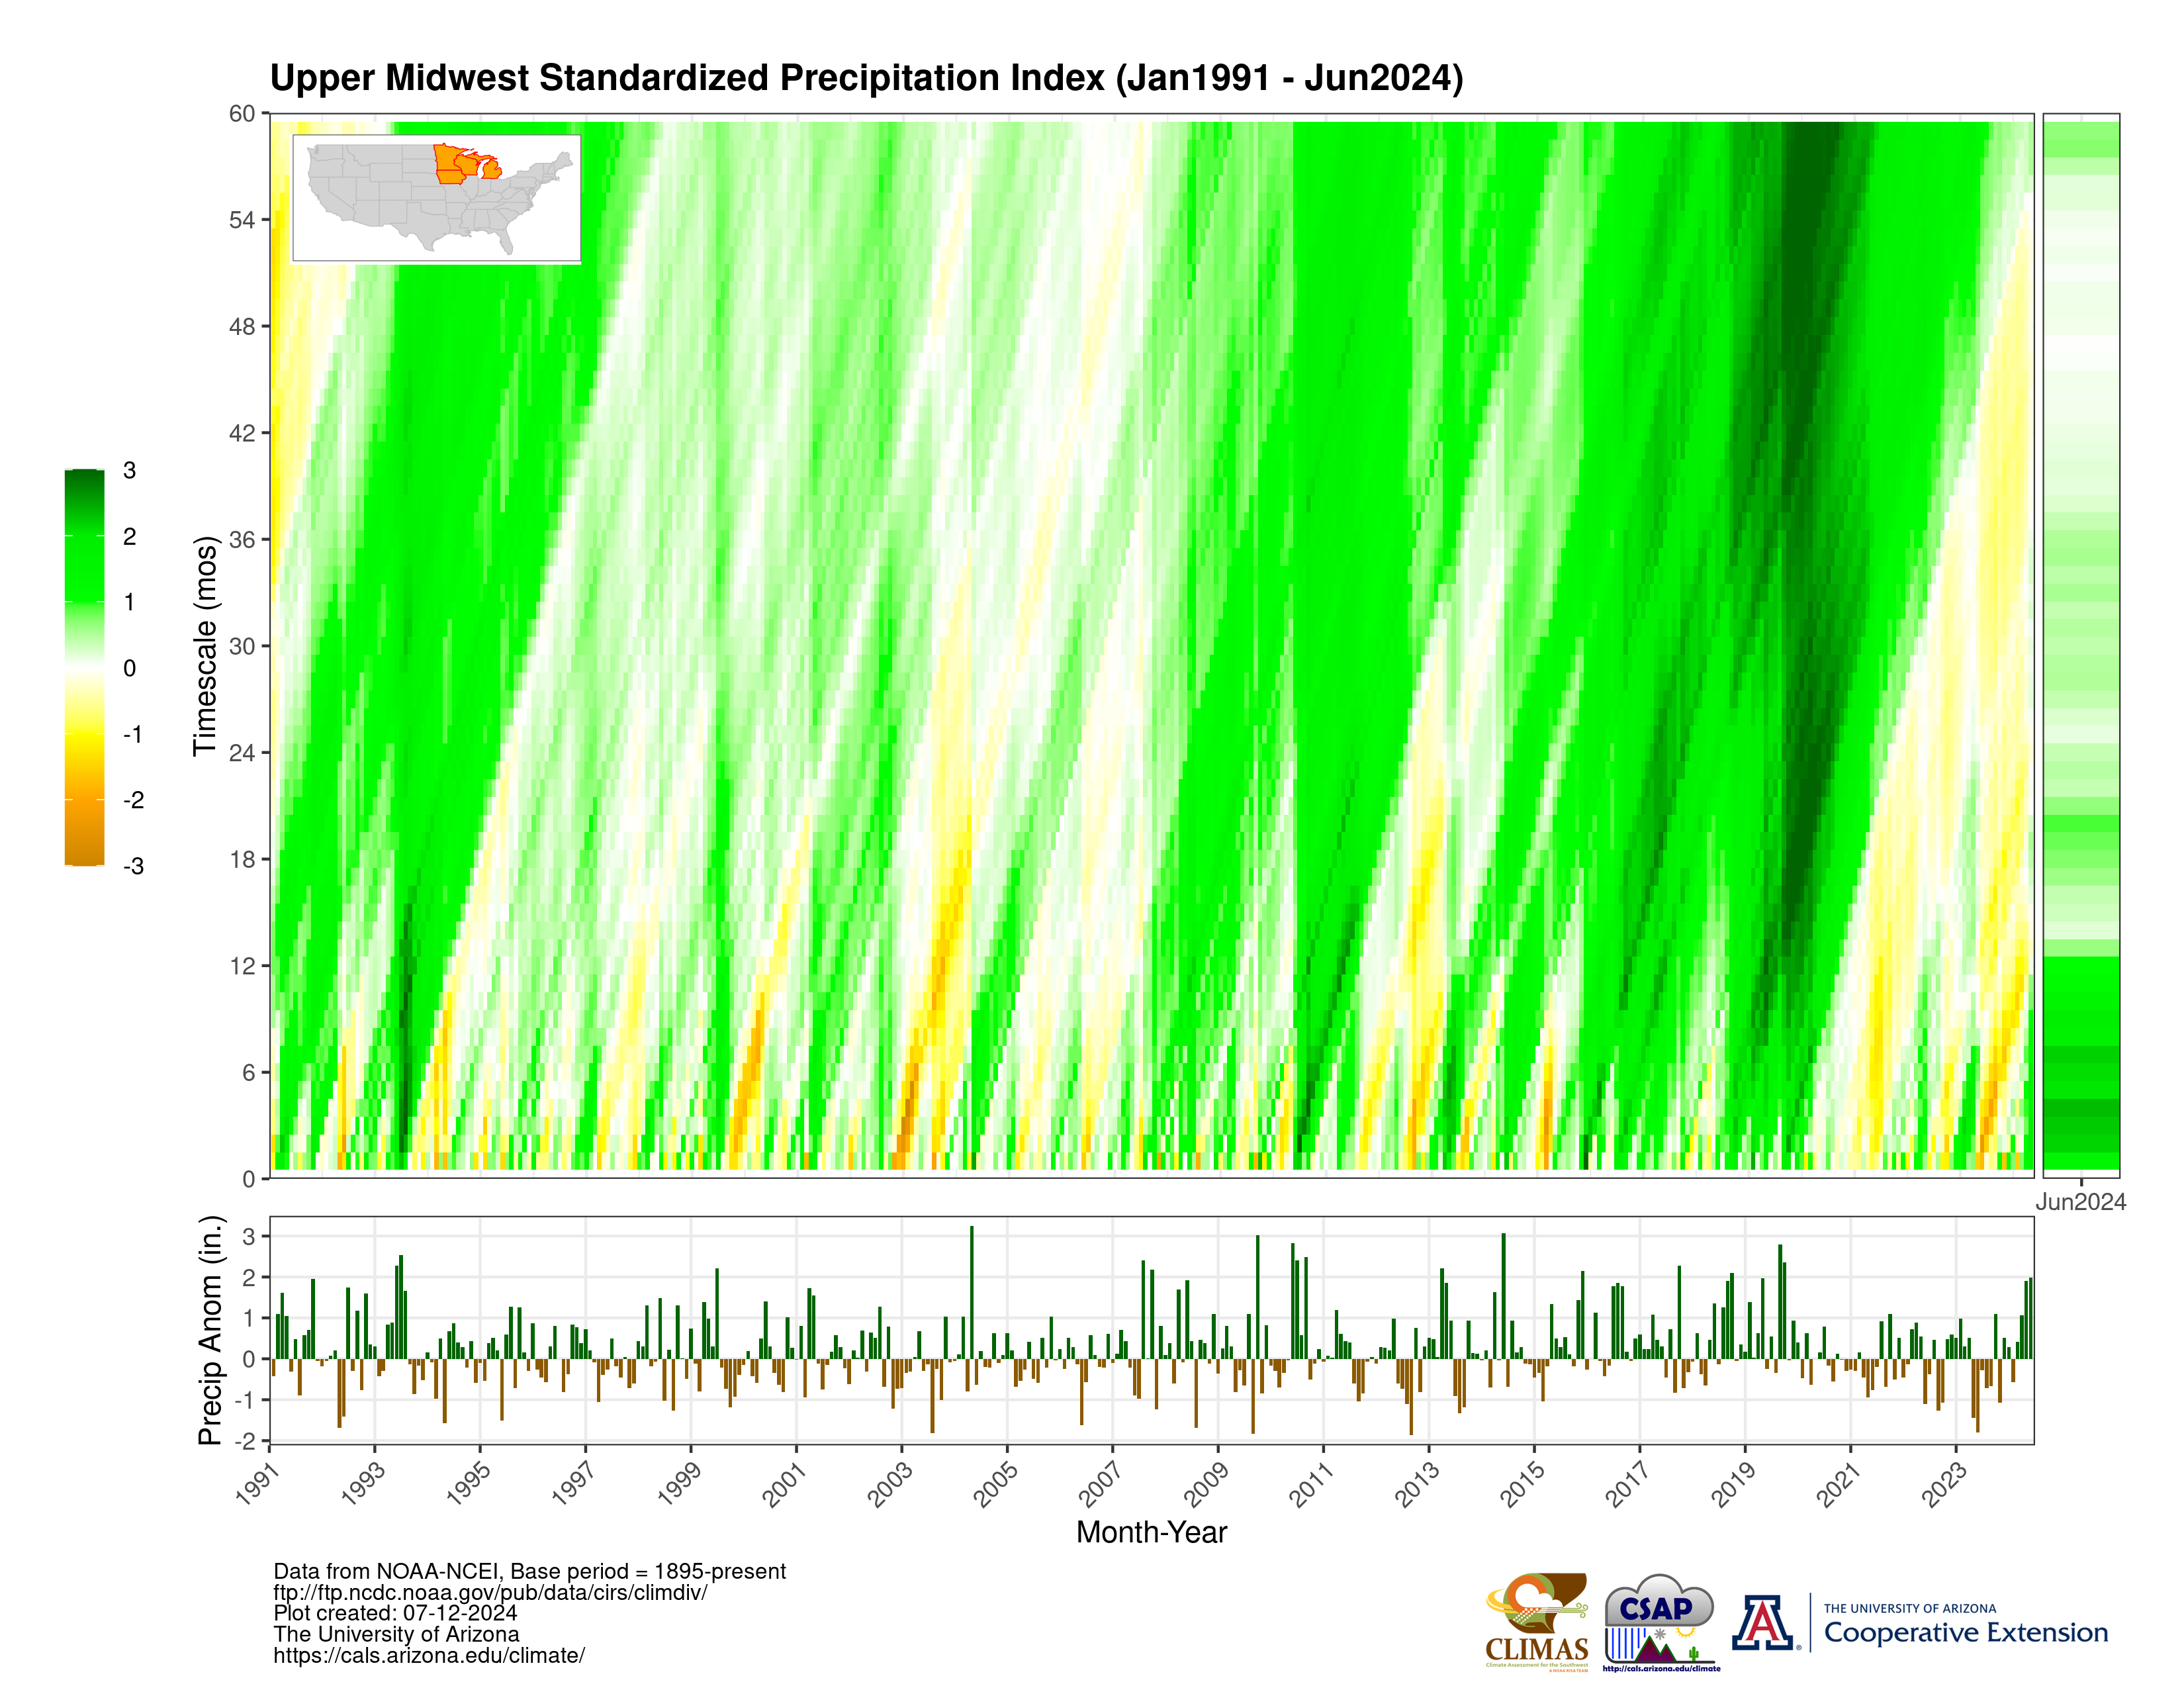
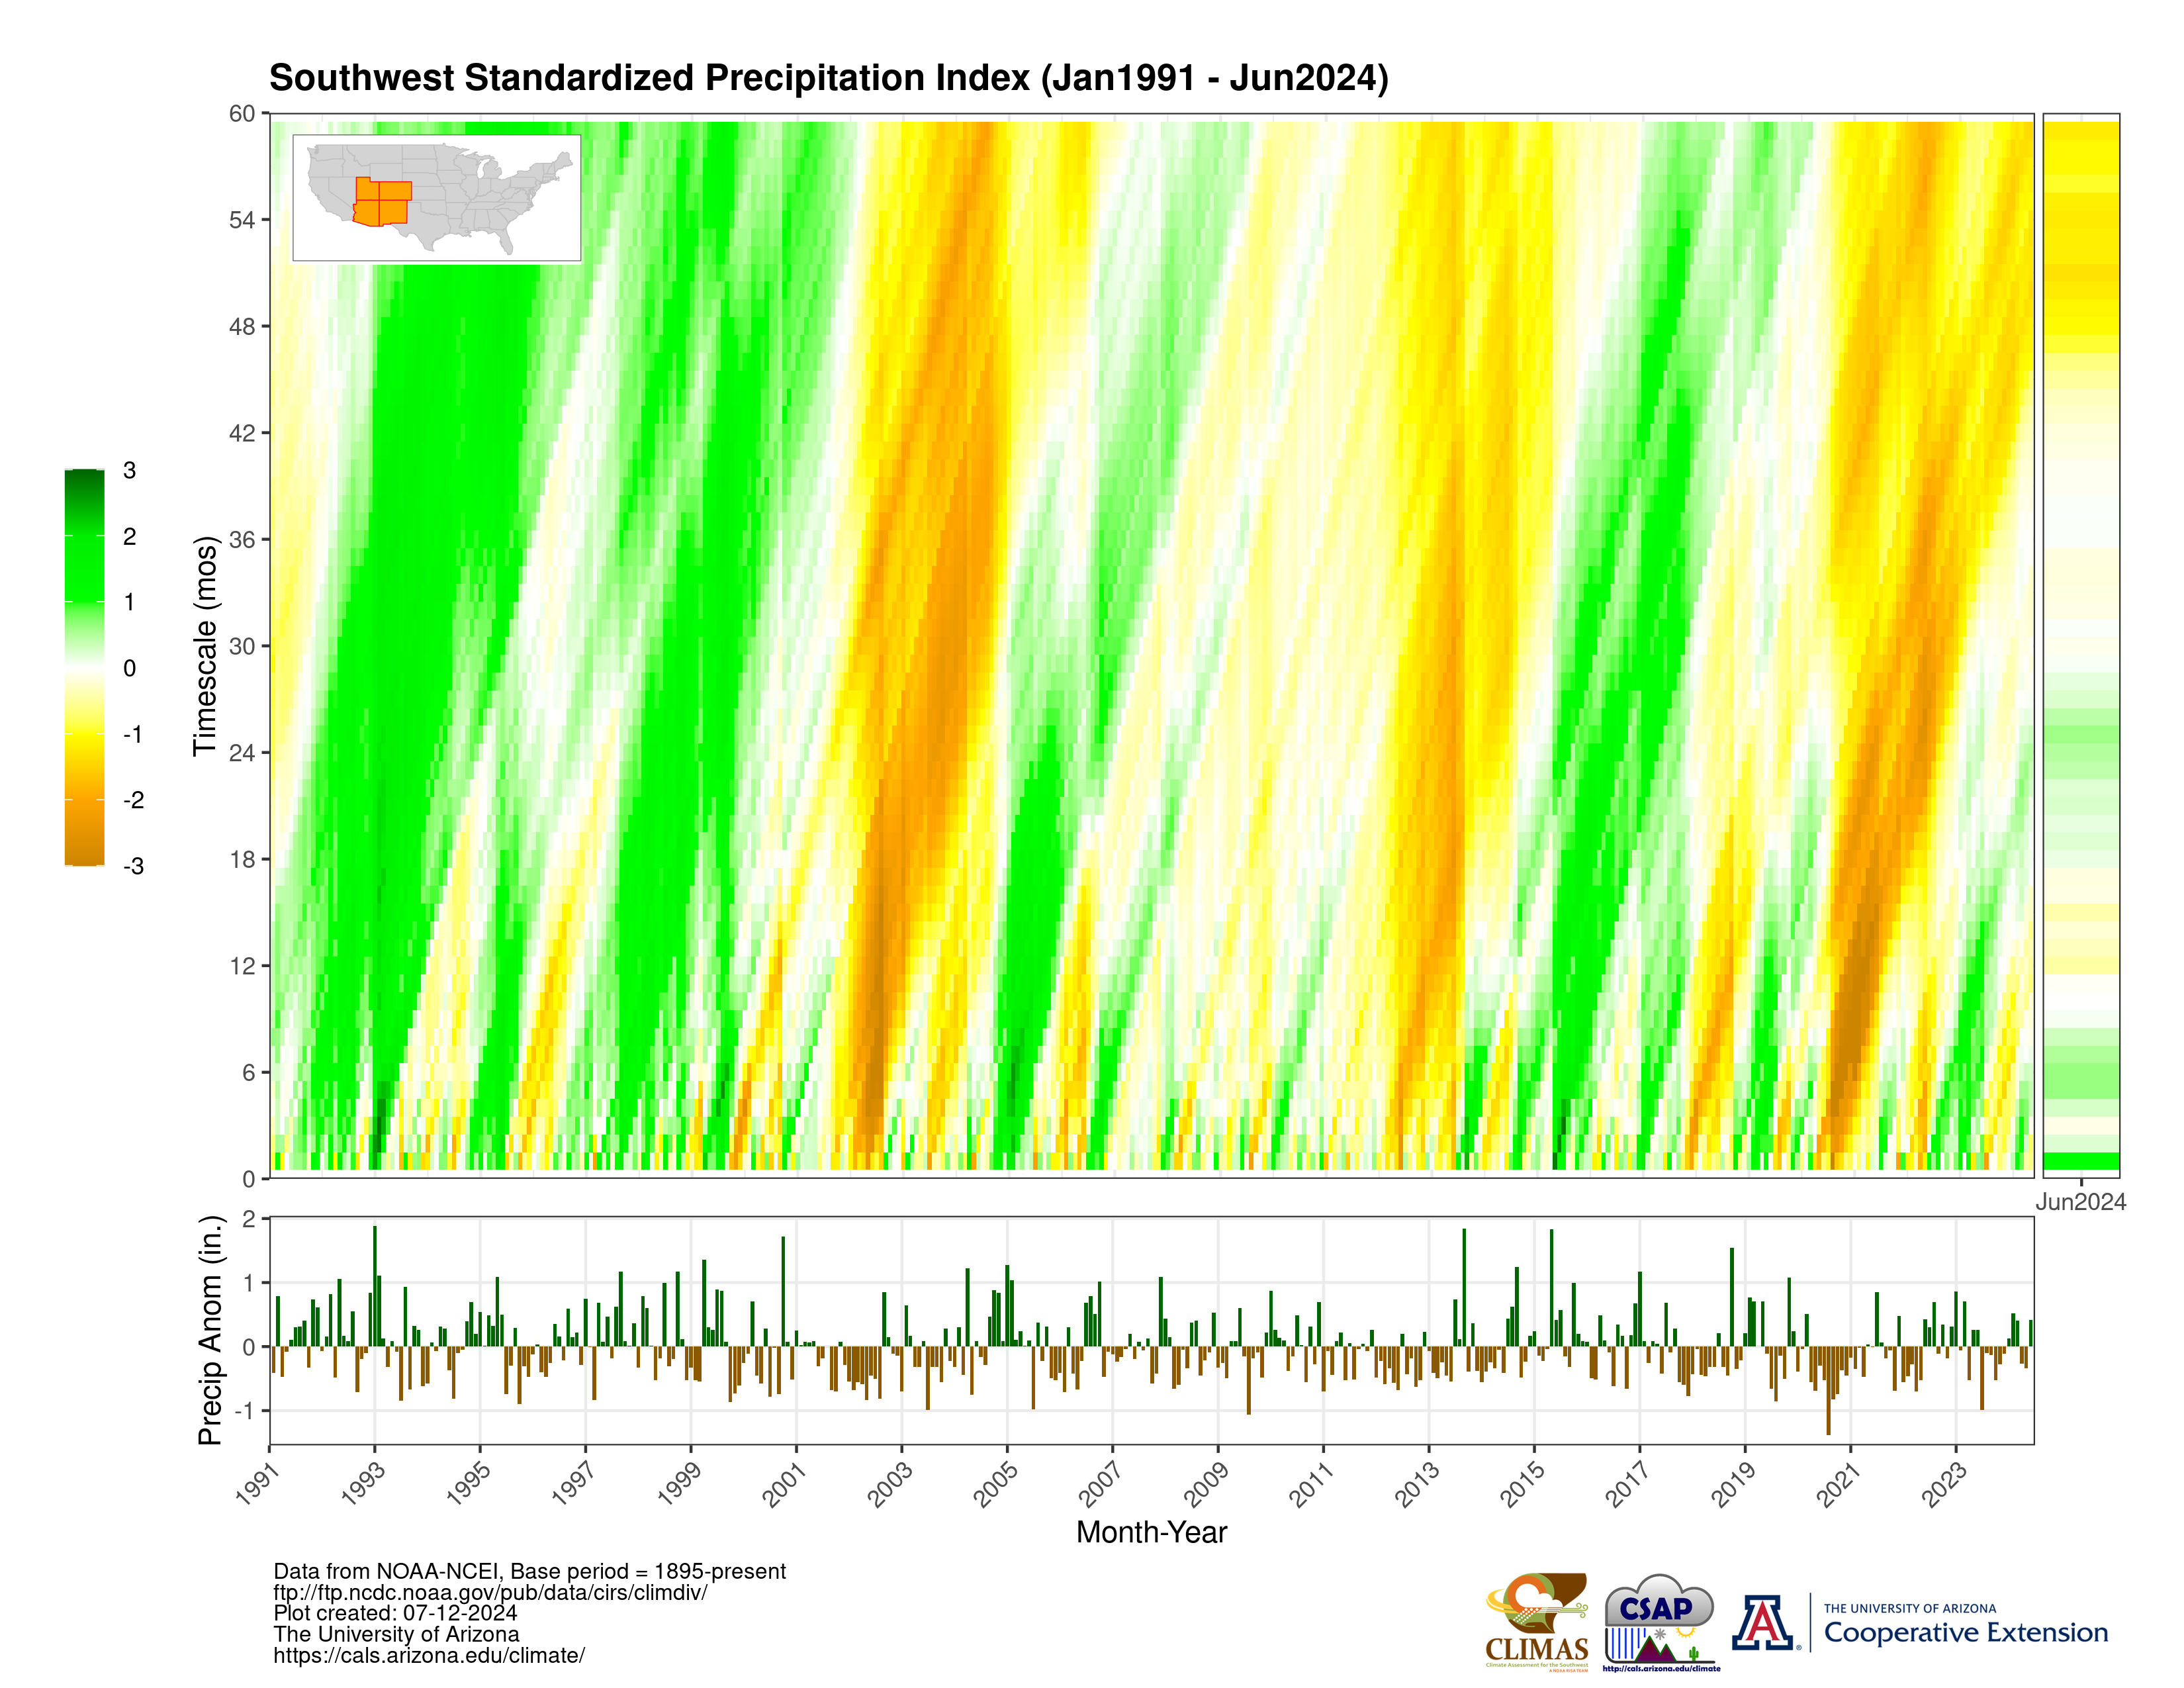
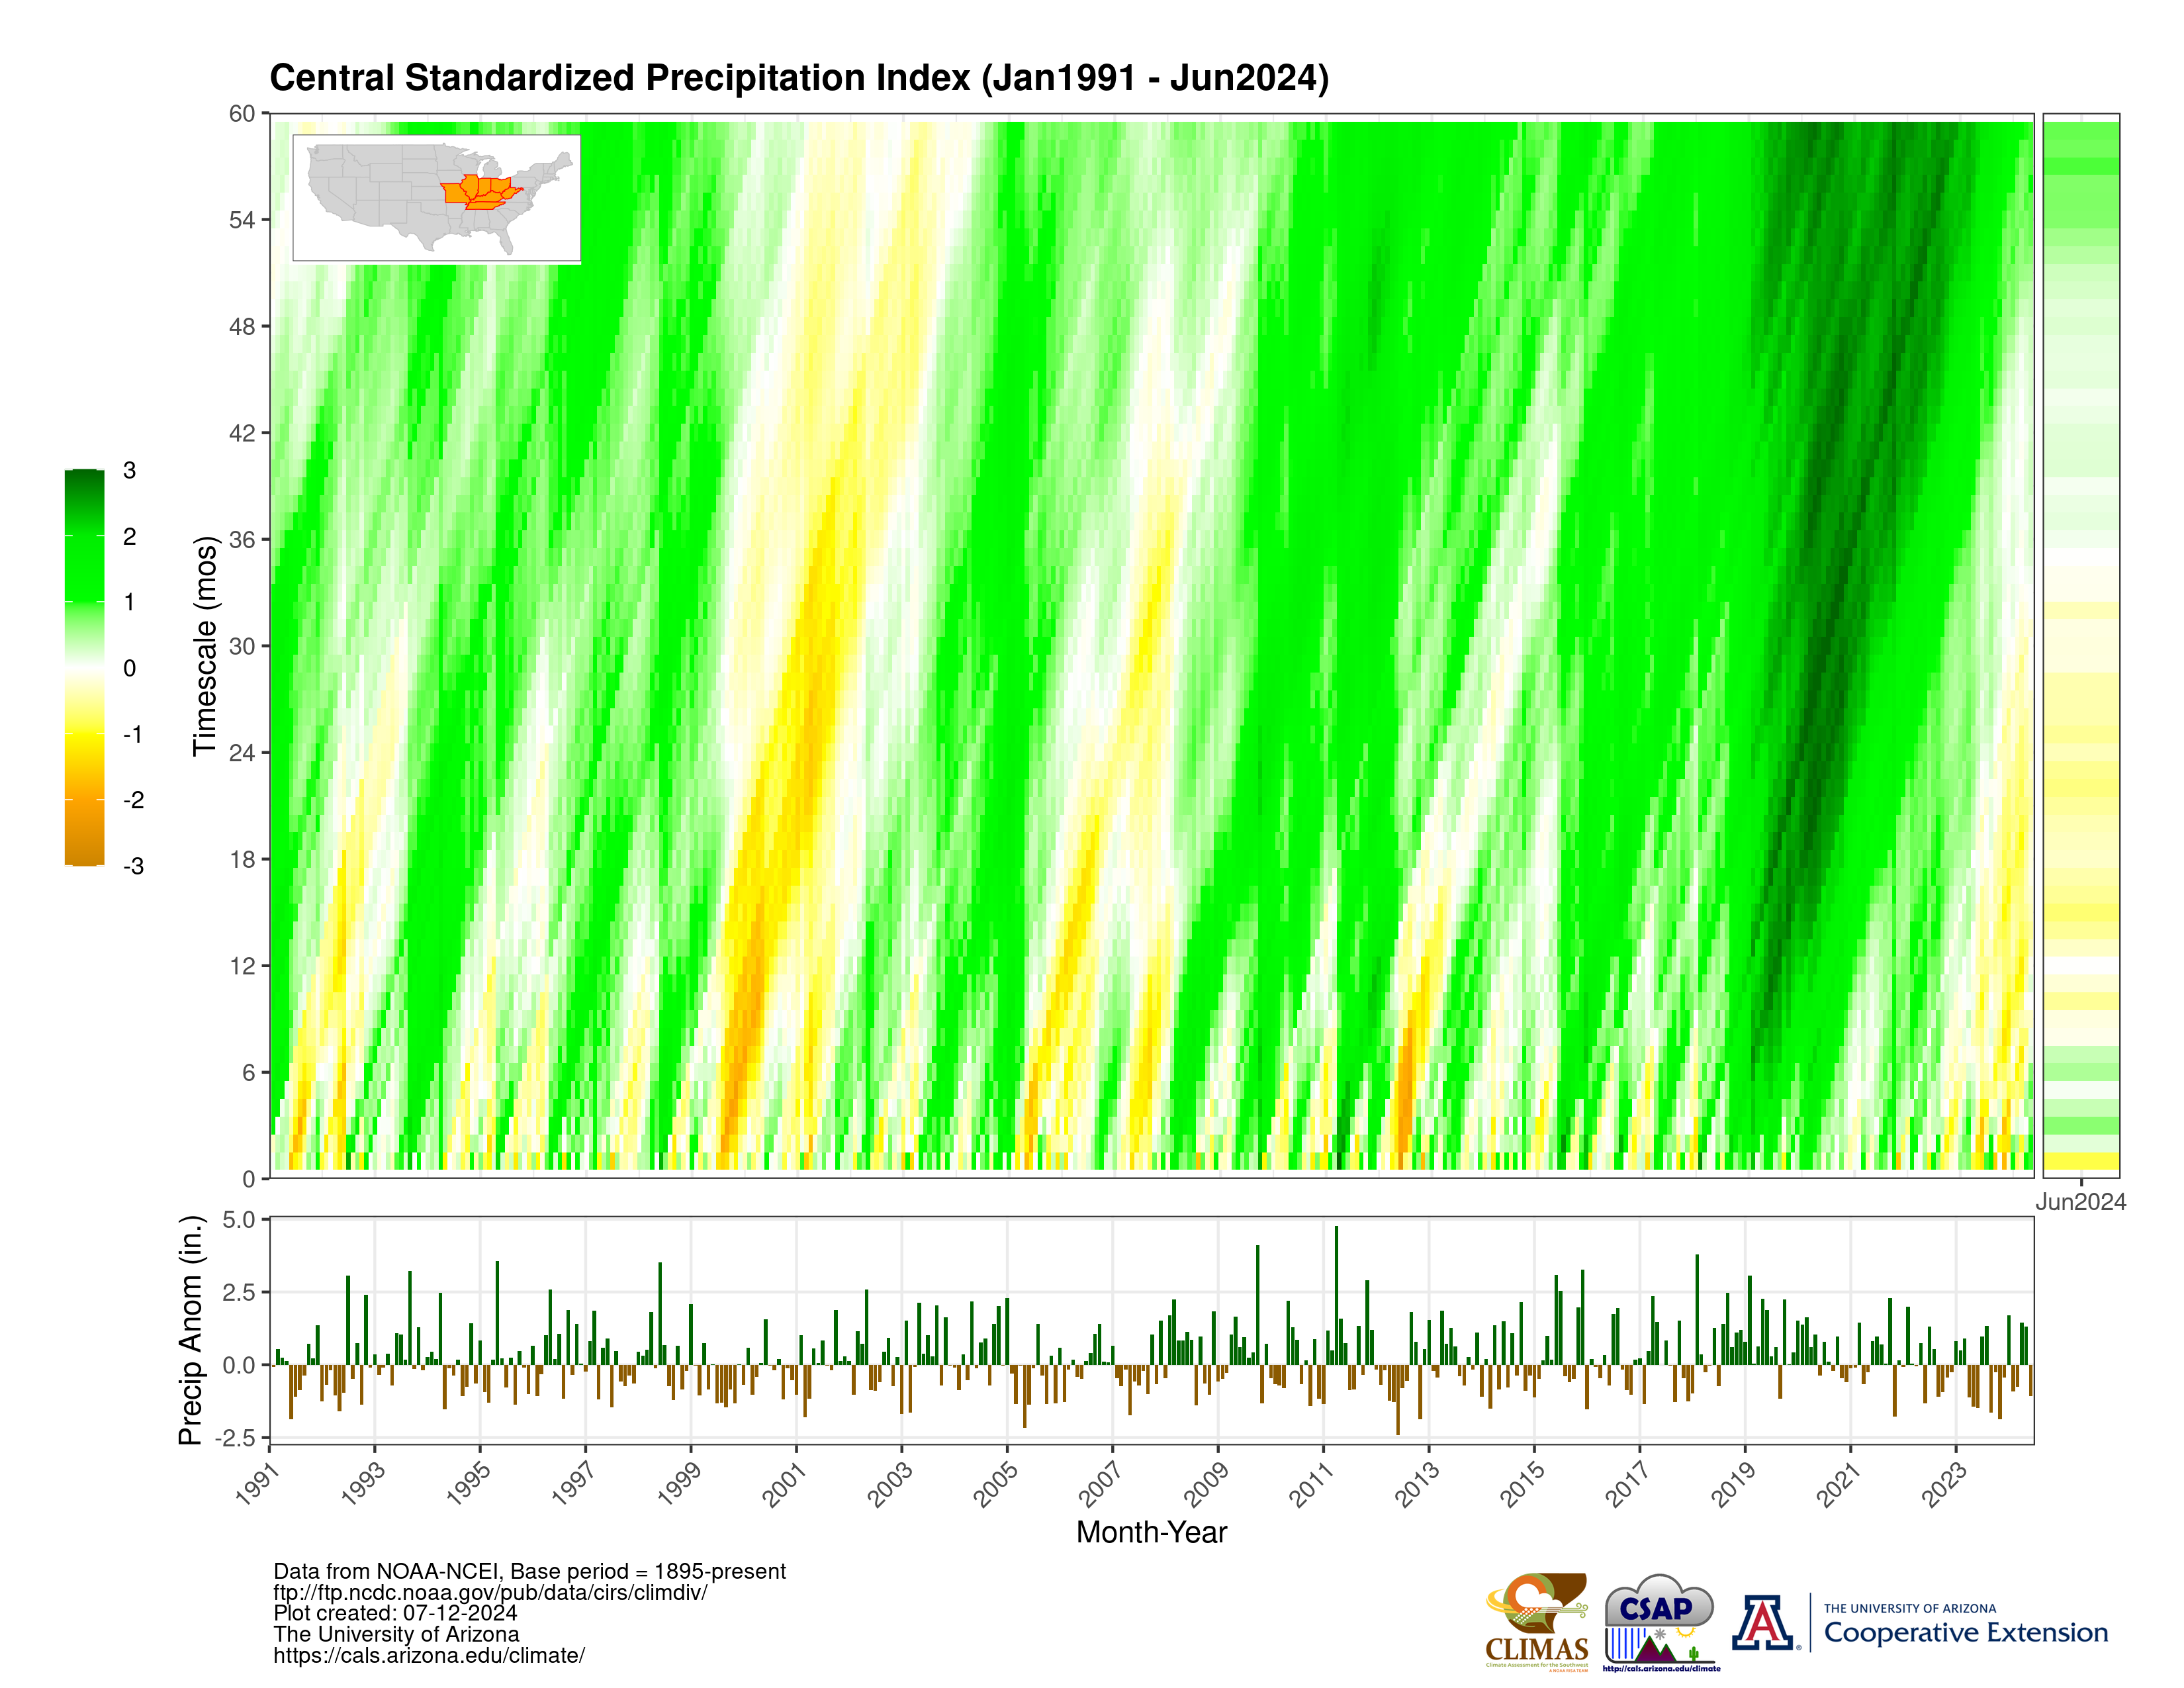
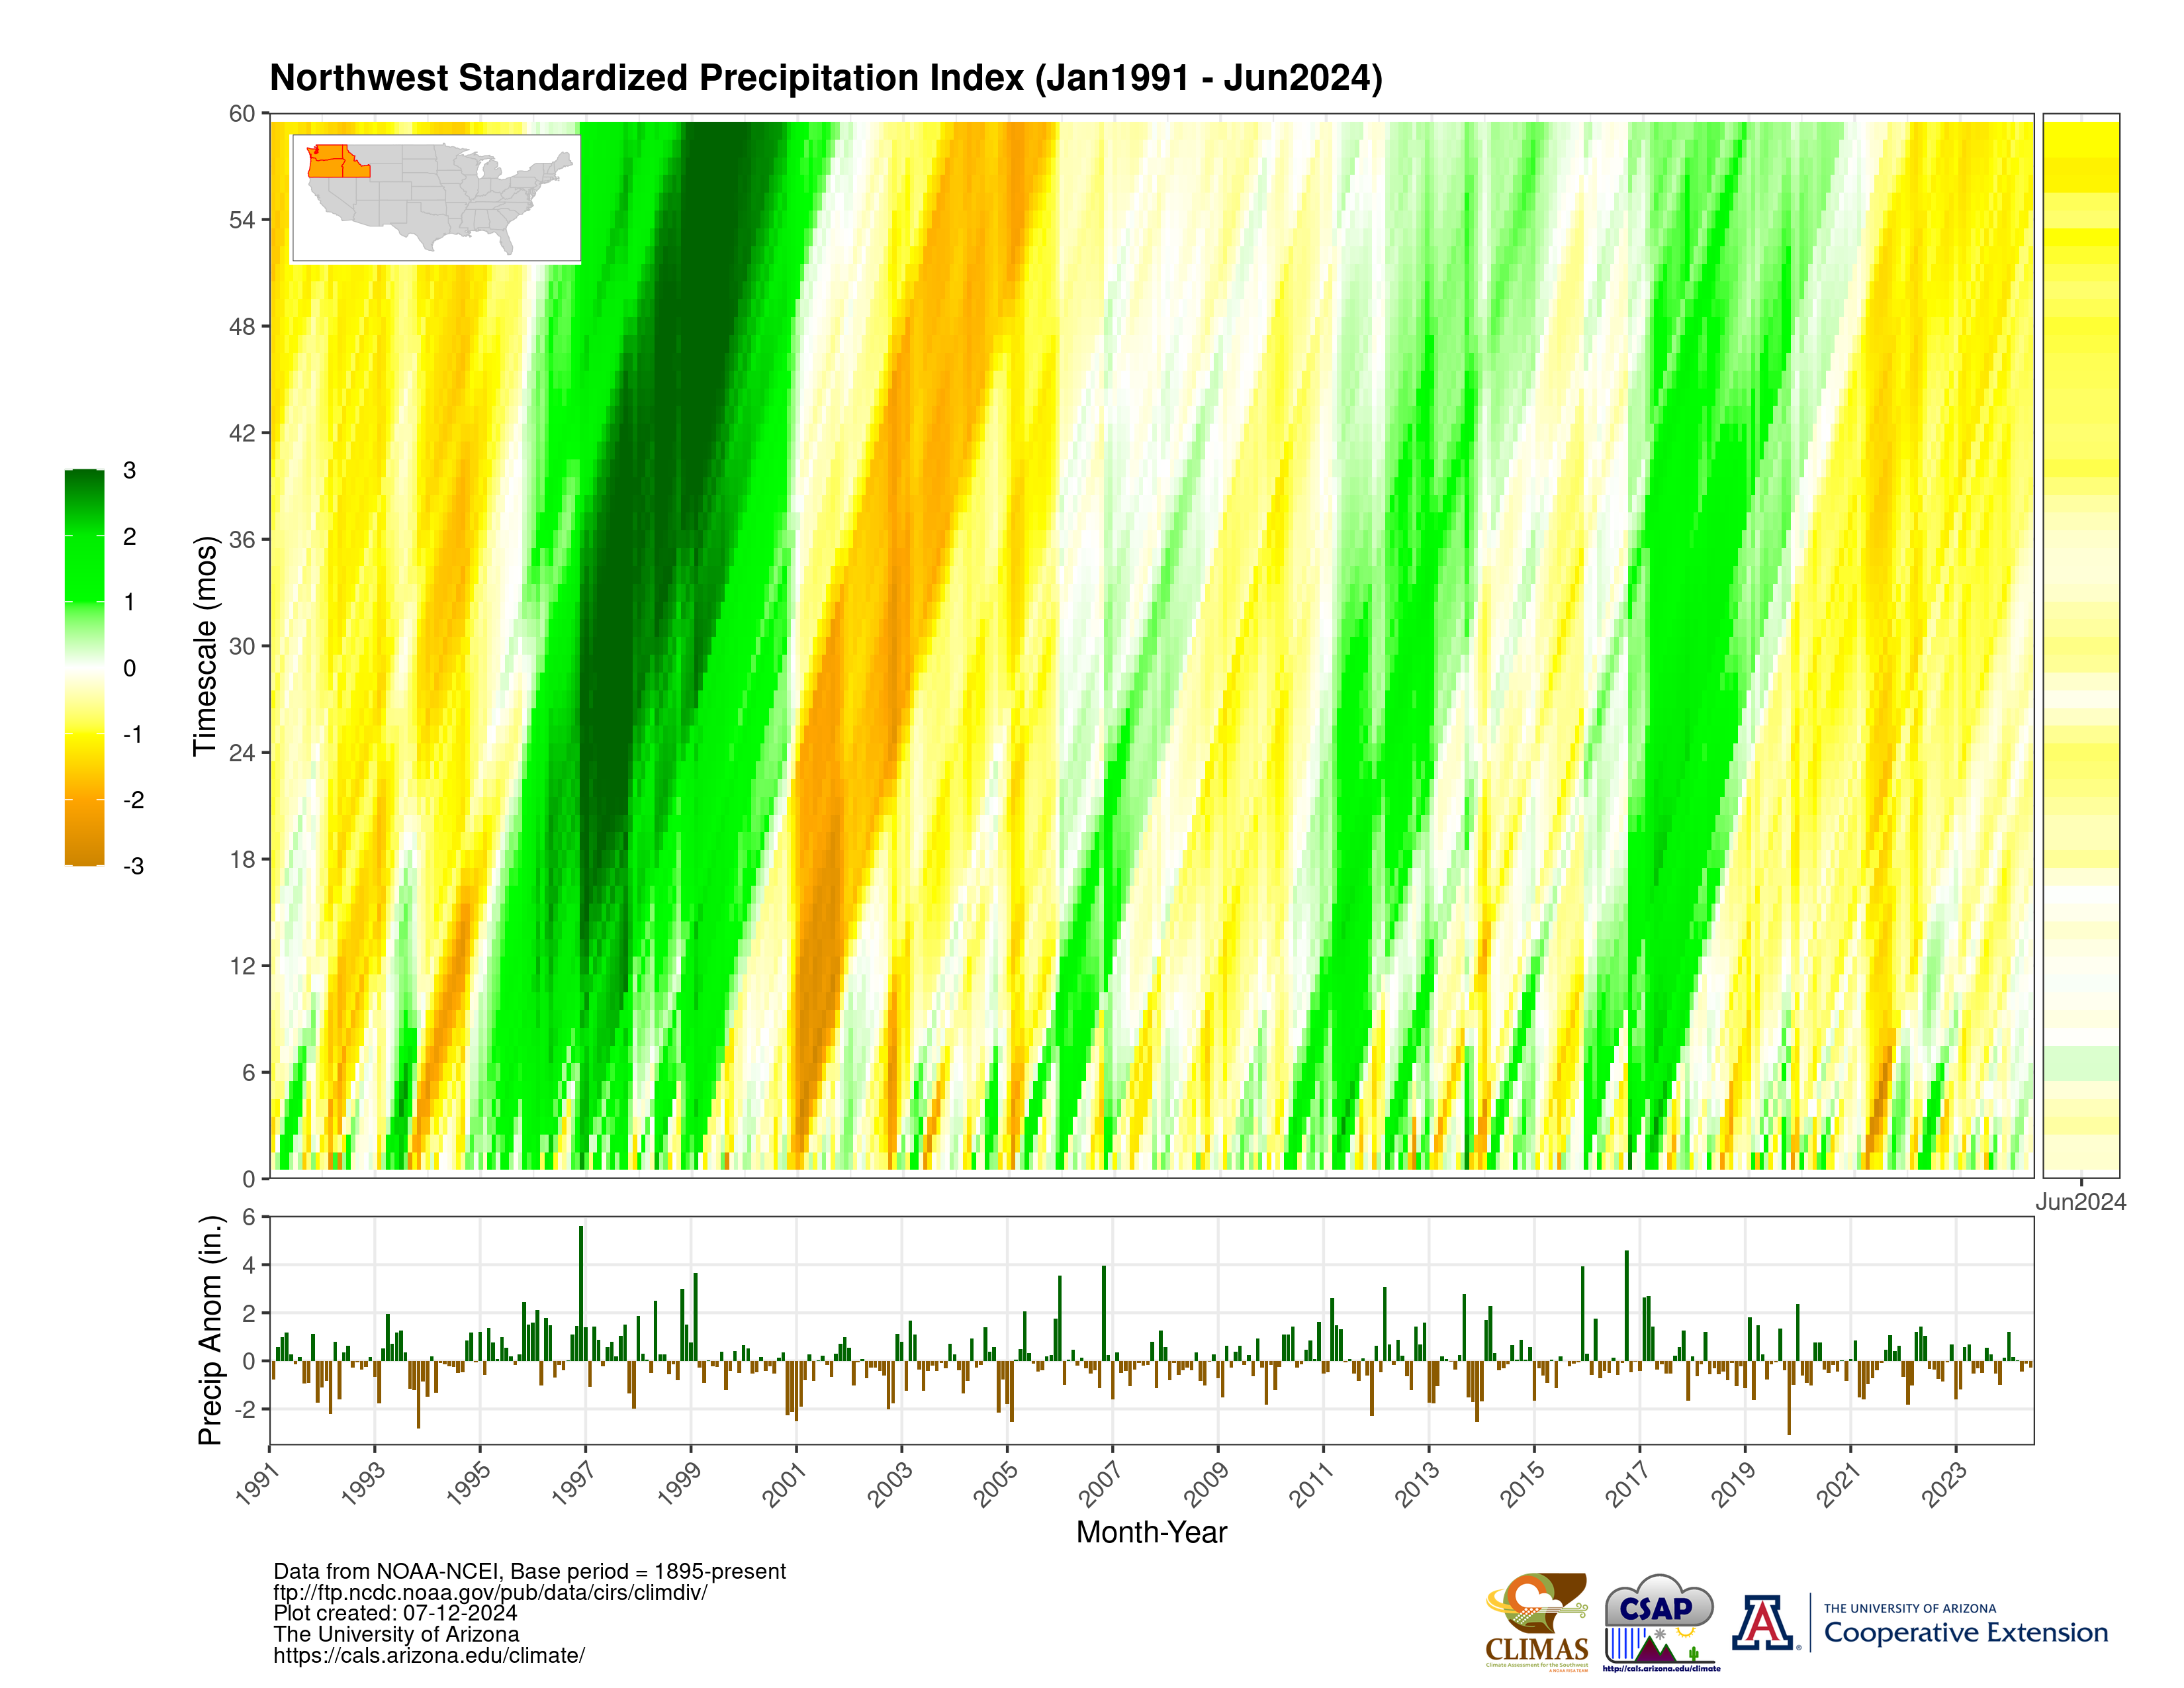
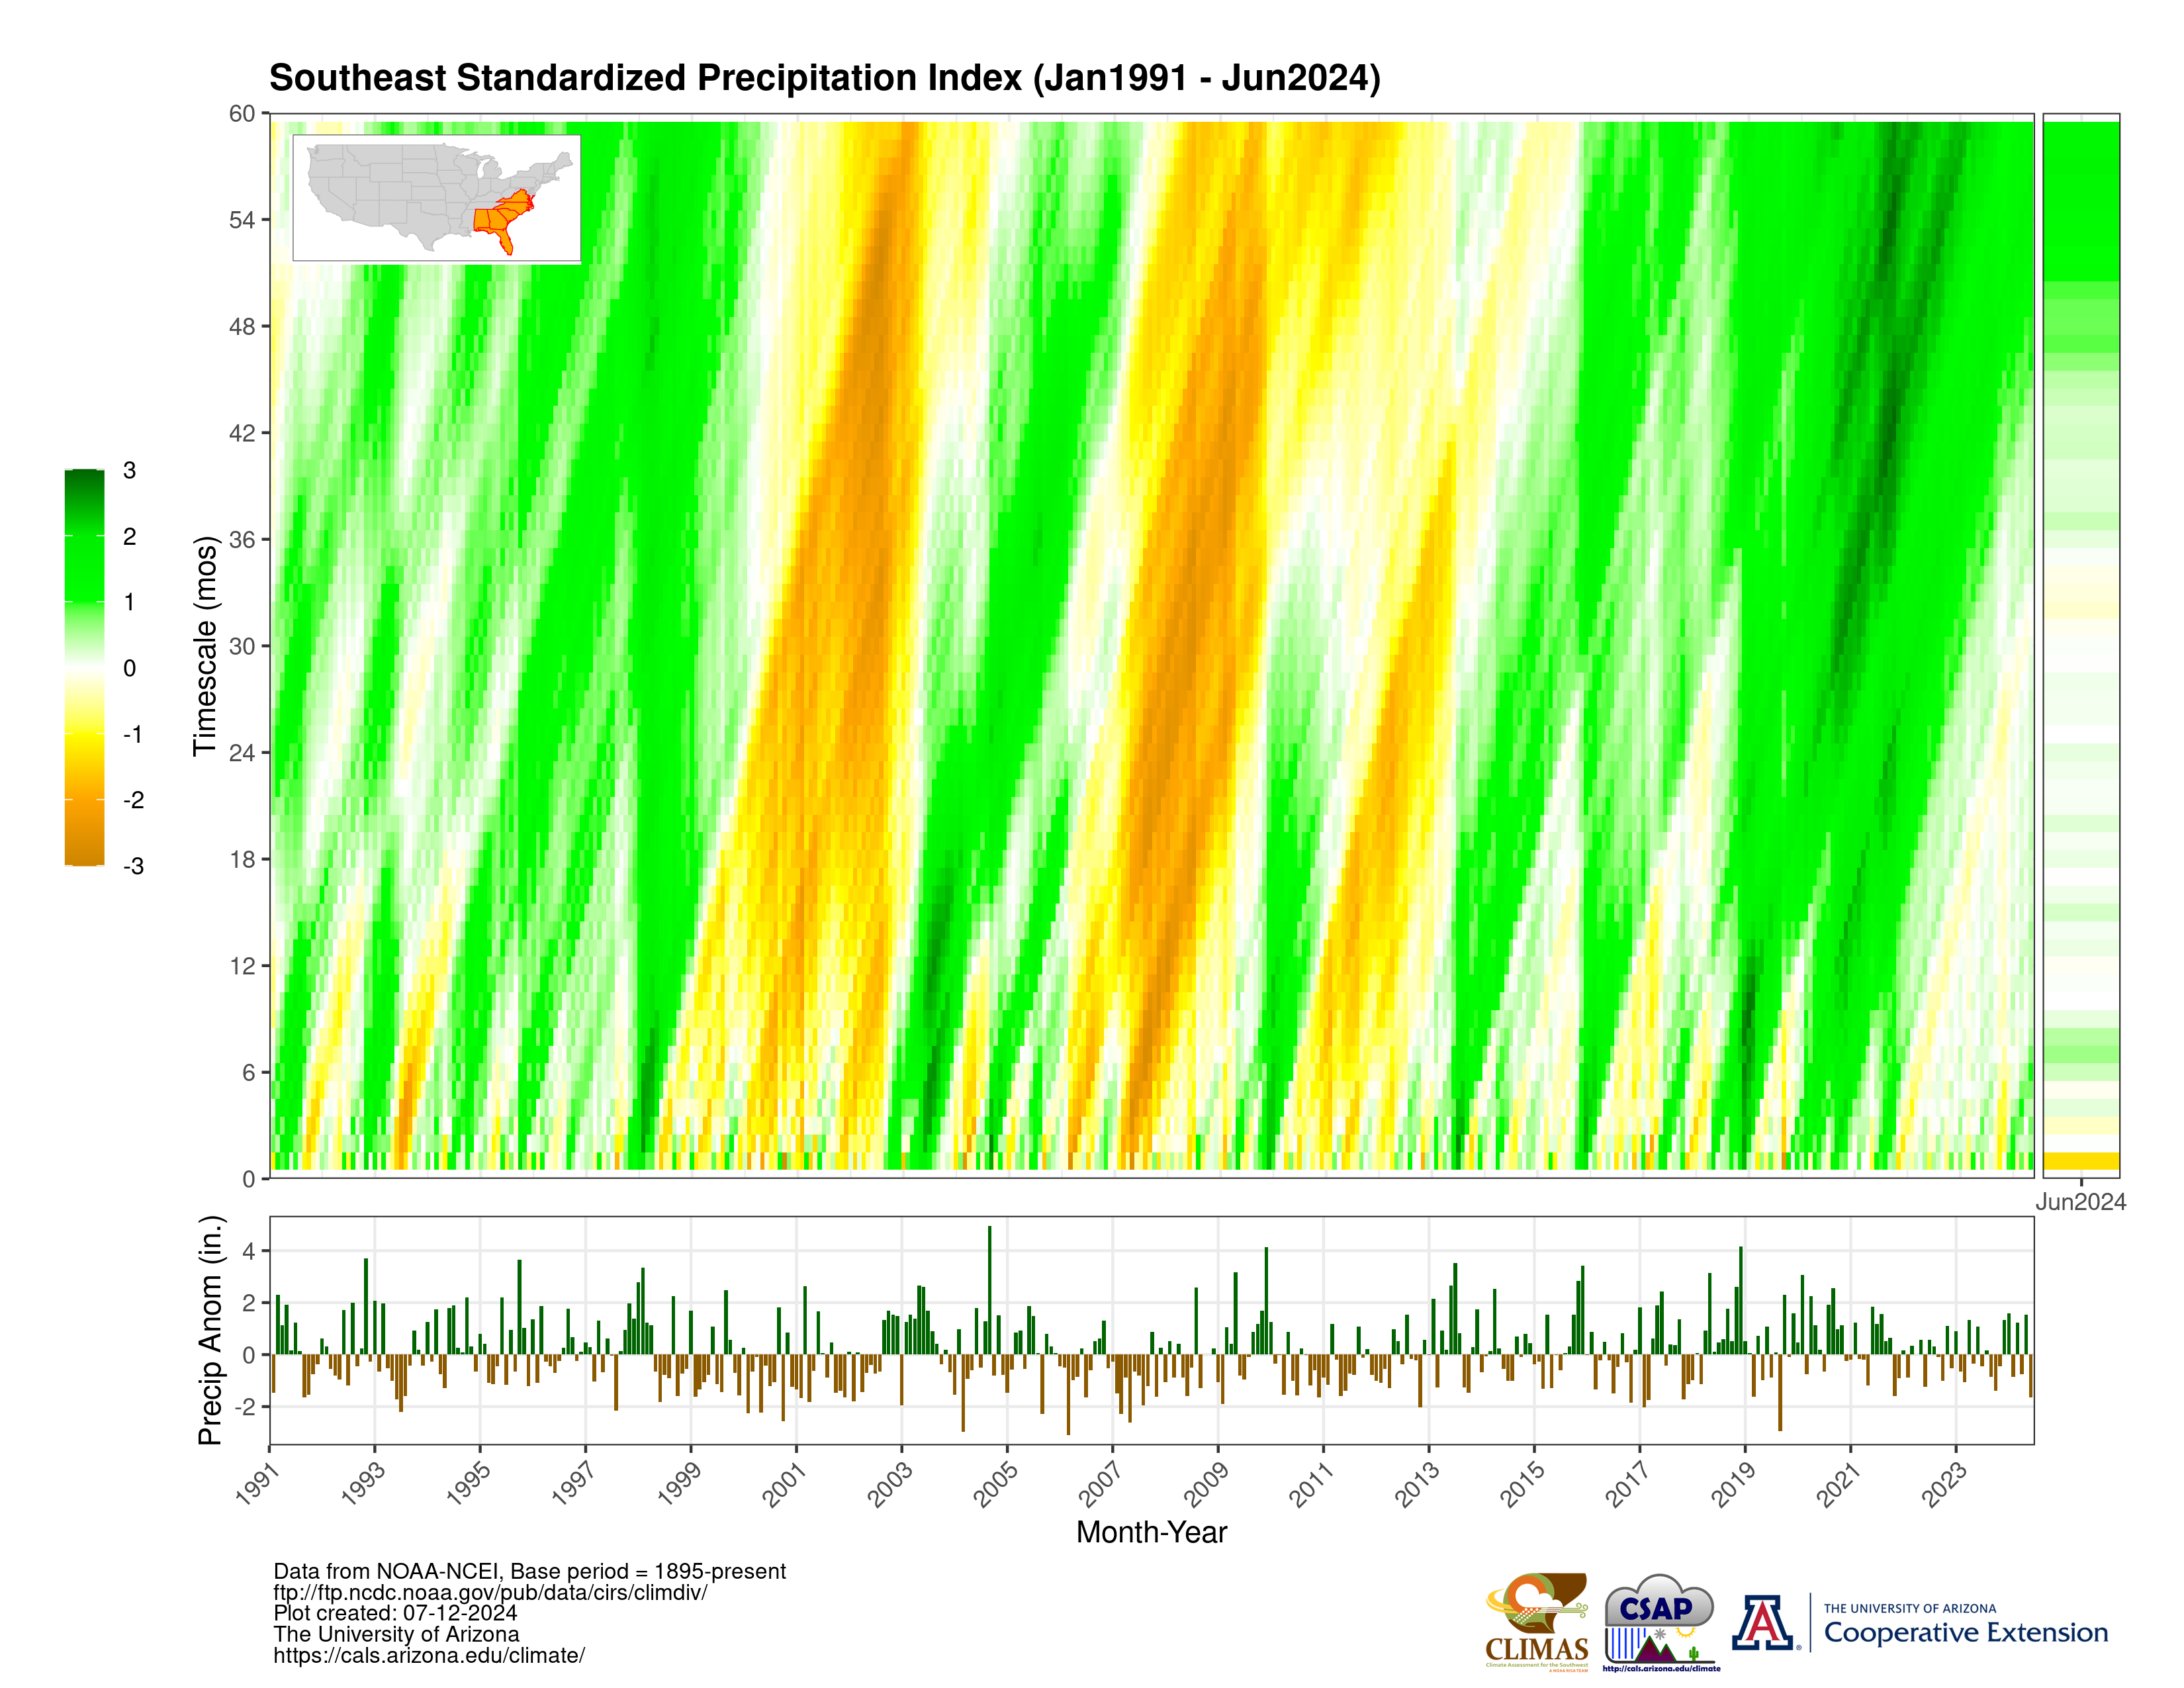
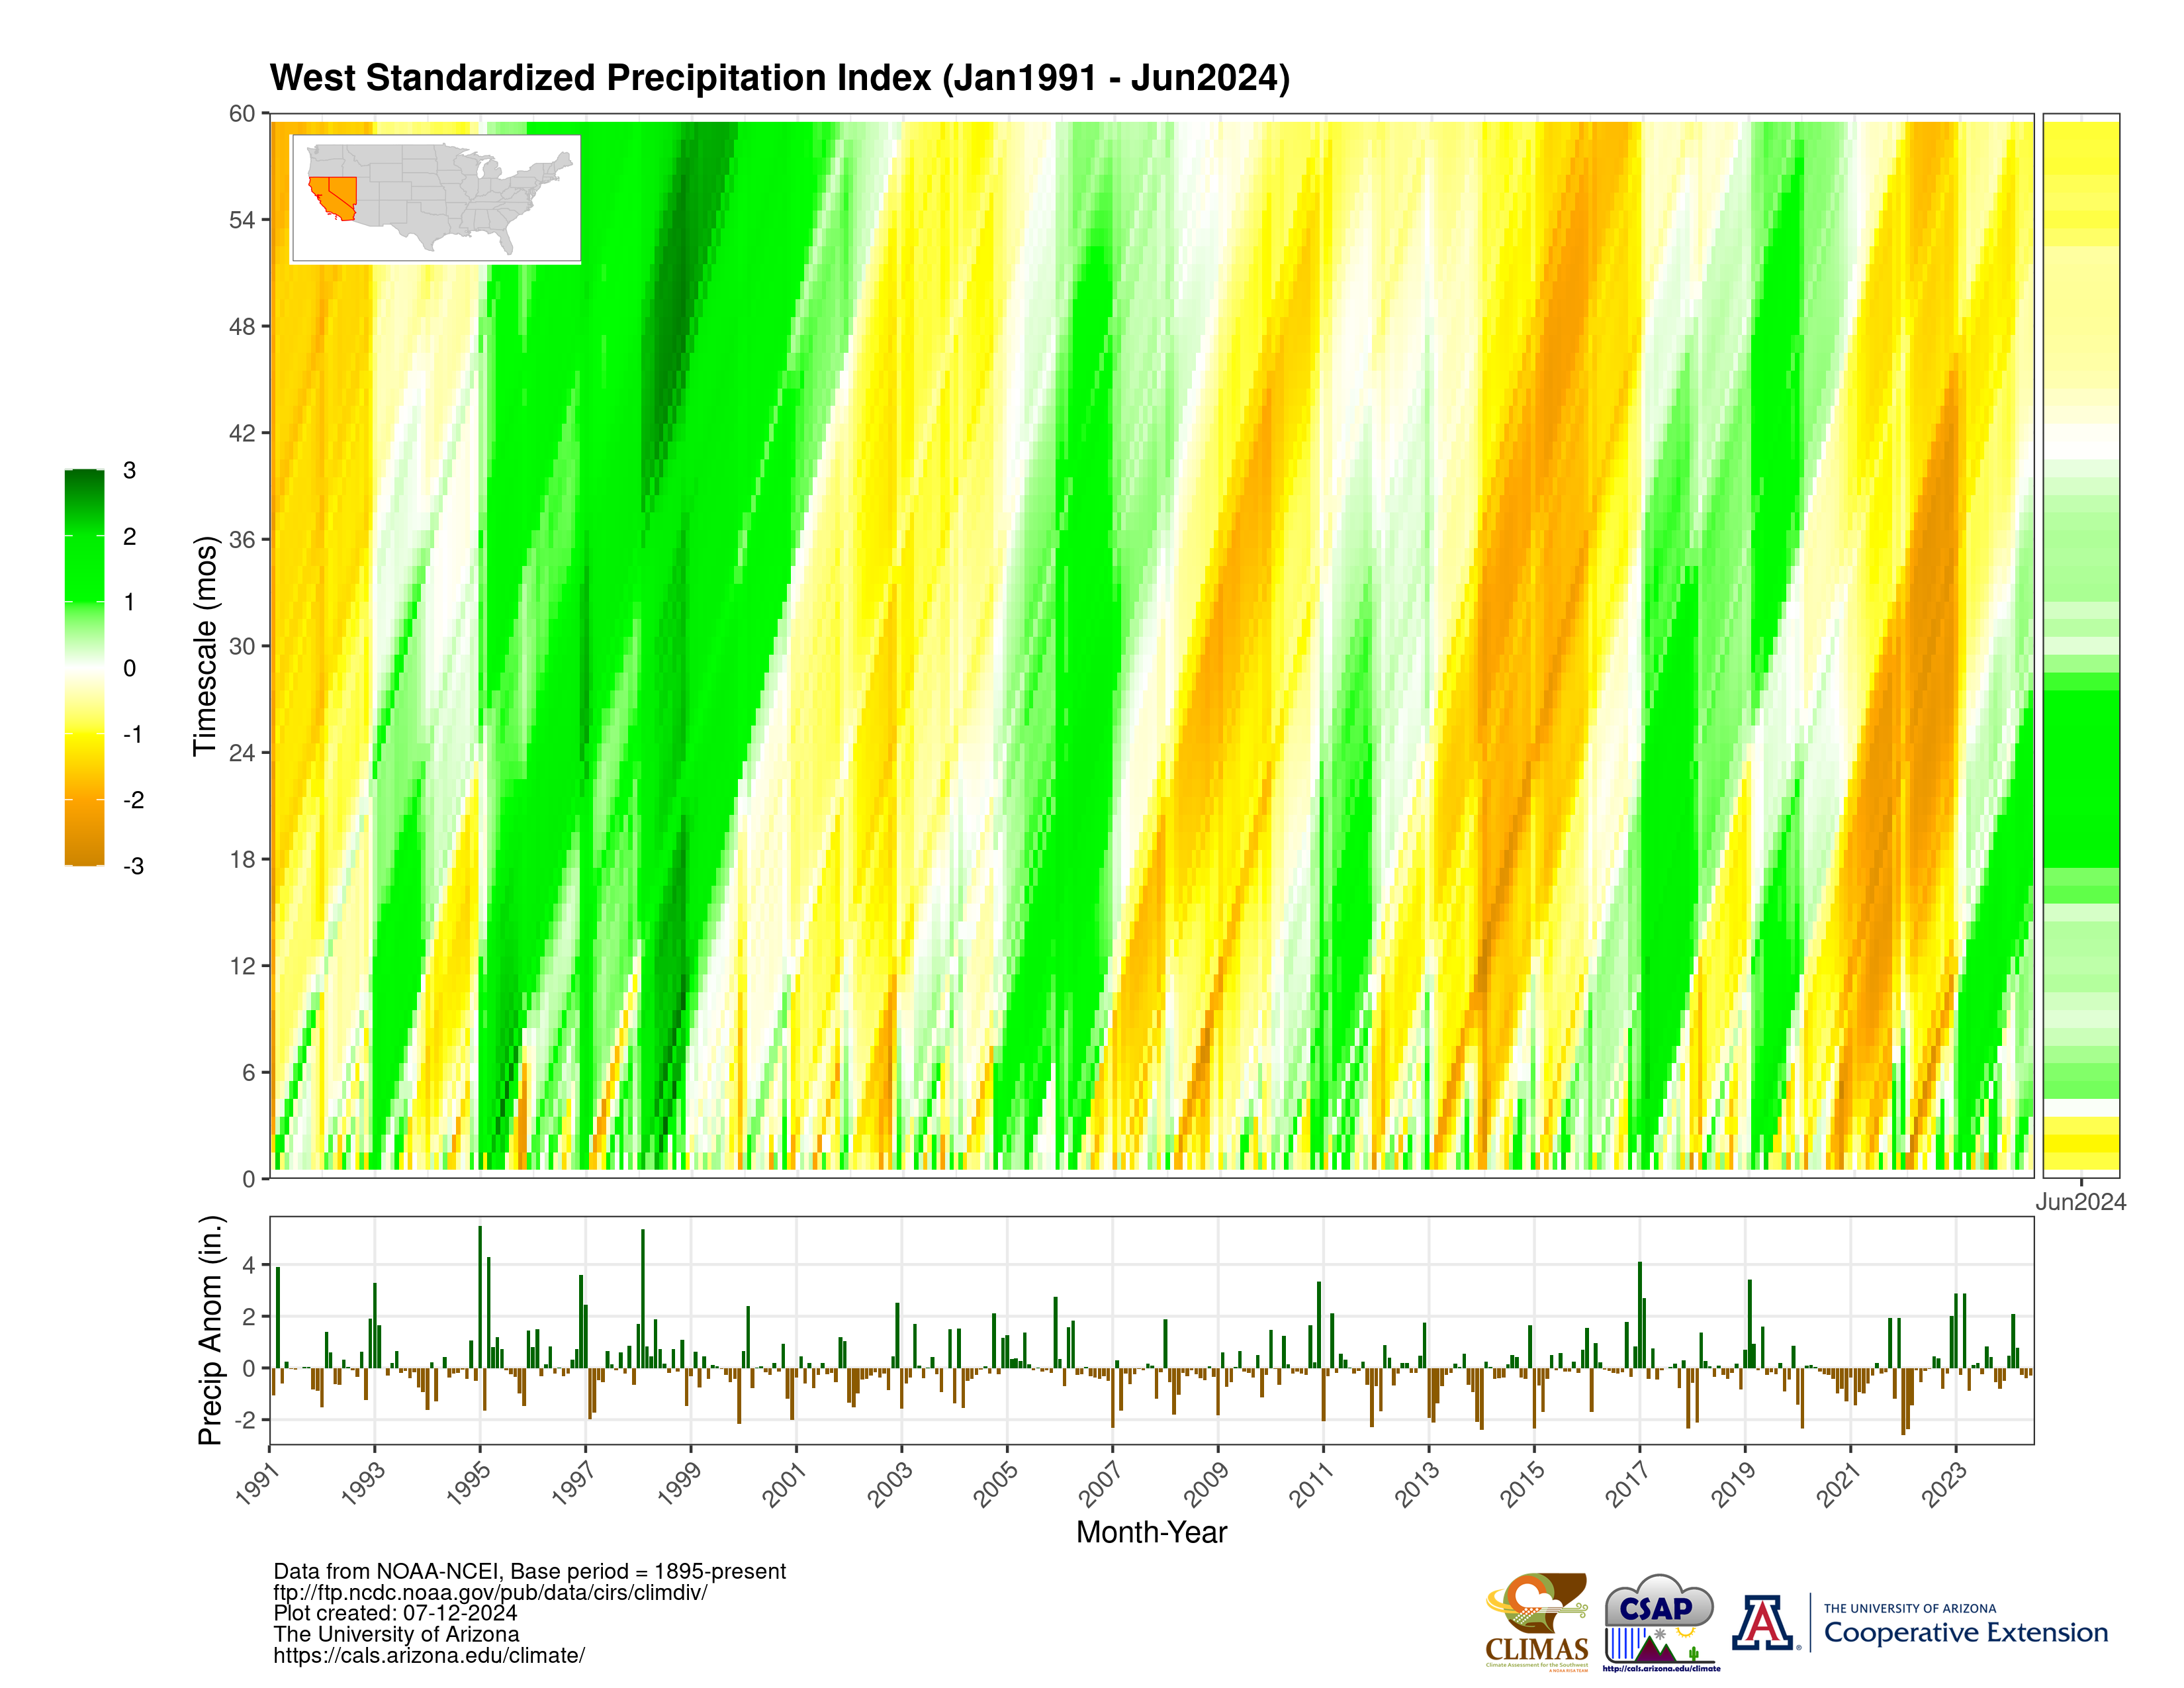
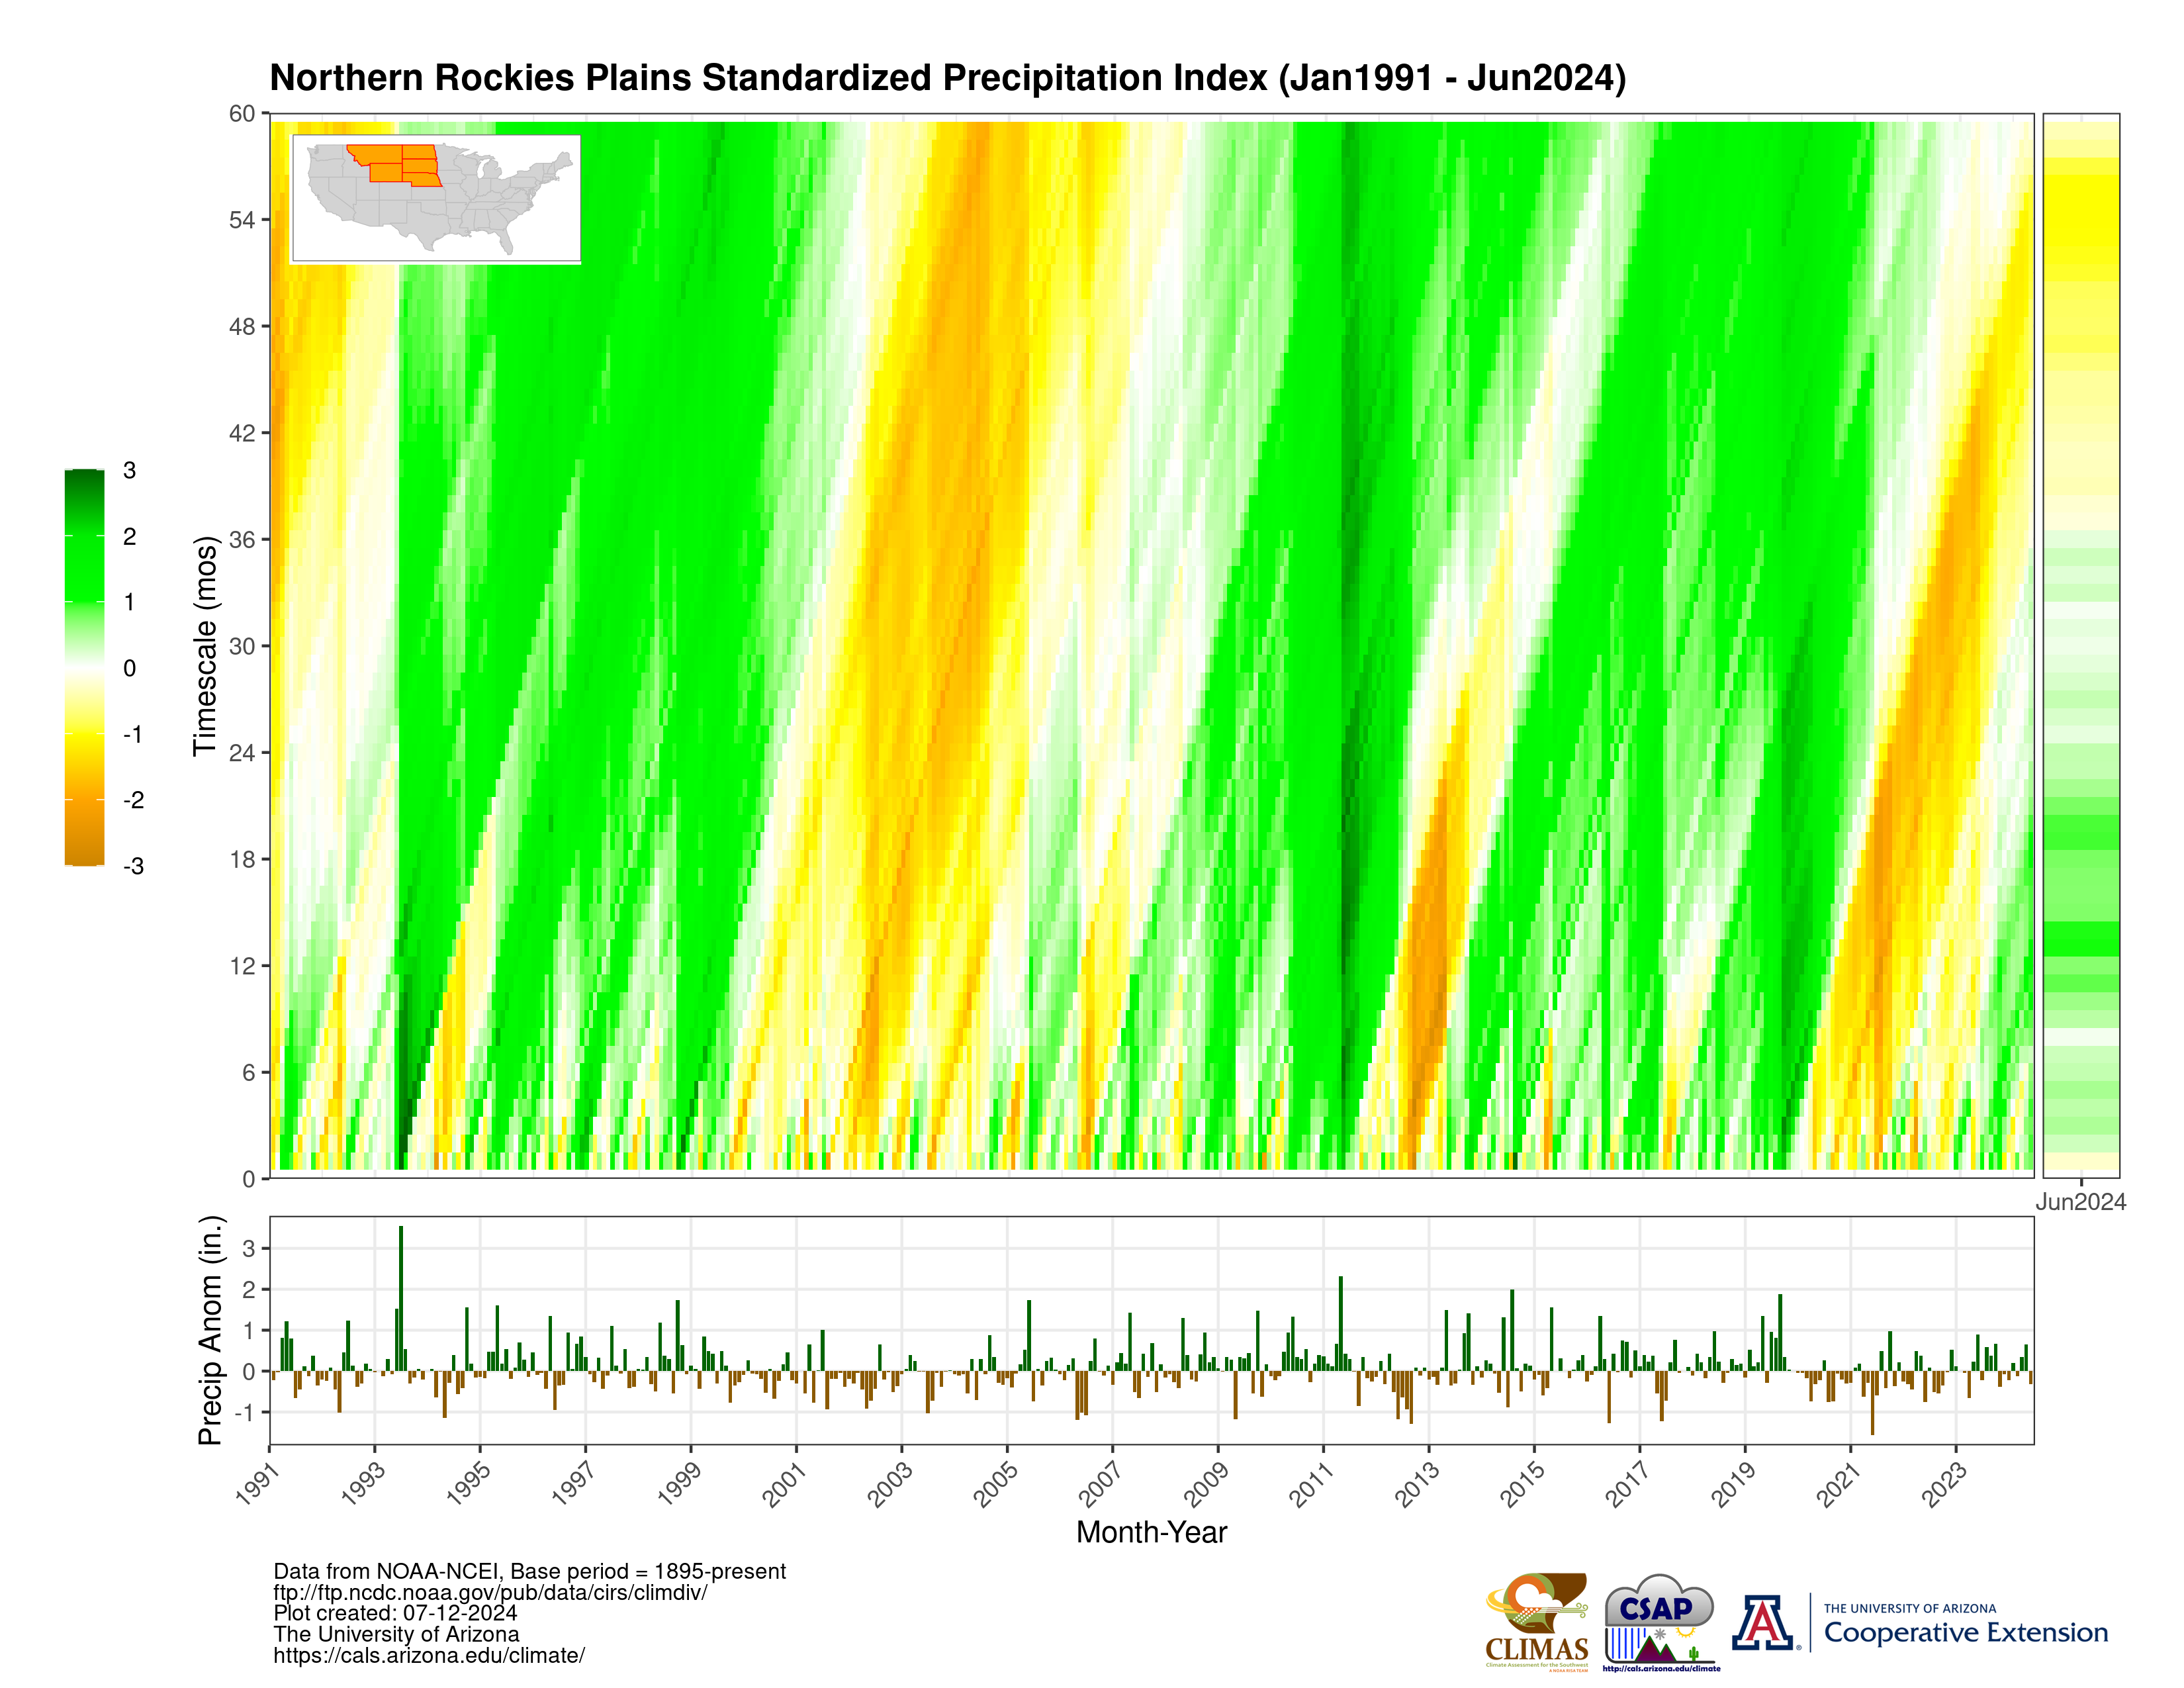
The Standardized Precipitation Index (SPI) is a useful tool for monitoring drought at multiple timescales. Short-term drought conditions can impact agricultural activities while long-term drought can impact water resources. Given these different timescales, varying intensities of drought and even lack of drought can exist at the same time. The plots below are created by calculating the SPI value at all timescales between one and sixty months for each month using National Climatic Data Center statewide average precipitation data. They are updated on the 12th of the month to incorporate the previous month's data.Click here for more information on how to interpret the plots. More SPI data plots can be found a the Western Regional Climate Center.
[Dataset information including region defintions can be found here; regions map]
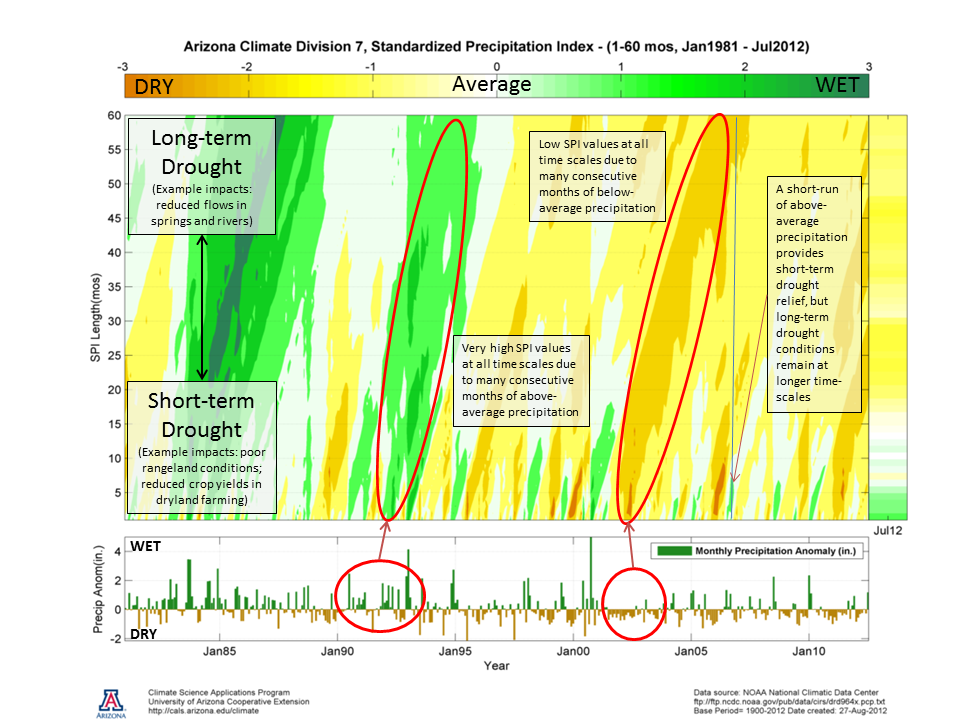
Guide to using plots
| Northeast Region | South Region | |
| Upper Midwest Region | Southwest Region | |
| Central Region | Northwest Region | |
| Southeast Region | West Region | |
| Northern Rockies and Plains |
Please contact Mike Crimmins with comments/questions
Last Updated: 01/05/22 © 2022 The Arizona Board of Regents. All contents copyrighted. All rights reserved.