

Cost-Benefit
Analysis
AREC 514 | ECON 514 | ARL 514
Spring
2008
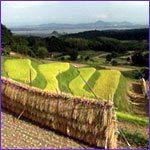
Rice
Production Project
|
Rice Production Project |
|
INTRODUCTION
Your task
is to develop an evaluation of a rice production project in the Philippines.
Traditional CB analysis often focuses on the difference between private
and social prices. Only a single input-output table is used in
the analysis; computations of private and social profits
typically utilize the same physical production coefficients.
The present exercise incorporates a second set of
input-output relationships. The original system is
unsustainable and uses a toxic pesticide. The second system
is sustainable, defined as one that does not interact
physically with other production systems and can be
maintained over the long run. The specification of a set of
physical production "standards" that meet sustainability
criteria eliminates market failures in the form of
externalities and unrecognized user costs. Evaluating the
second (sustainable) system at private and social prices and
comparing the results with the original (unsustainable)
system provides insights into the interaction of
agricultural and environmental policy.
Unsustainable
Production
The commodity is irrigated paddy. Currently, paddy is
produced with the help of a toxic pesticide. Because rice is
an aquatic plant, the pesticide finds its way into the
drainage water. The drainage water, after it leaves the
paddy fields, runs into fish ponds downstream where it is
lethal to the fish. It also enters the drinking water supply
of several nearby small towns, and questions have been
raised about the effect that high levels of certain toxic
elements have on human health. Farmers maintain that the
pesticide in question is one of the few substances that
effectively controls the rice stemborer. They assert that
there would be a substantial decline in yield if the
pesticide were banned. Seventy five percent of the grade
received in the course will be based on two midterm exams
and a final. Each exam will have an equal weight (25
percent) in the determination of the course grade.
The water table in the area is rising. Paddy has a high tolerance for standing water and drainage is a lesser problem than it would be for most other crops. Failure to drain, however, means that salts would accumulate in the soil. These ultimately will have a damaging effect on paddy yields. Although there are several levels to the drainage network, a substantial portion of the work required to keep the land fertile involves the maintenance of field drains. The work is done by hand using family or hired labor.
The failure to drain results in declines in yields. After approximately 20 years, the total decline will amount to 40 percent.
Sustainable
Production
"Sustainable" production differs from the
"unsustainable" production technology in two important
ways.
(1). The toxic pesticides that produce externalities in the unsustainable case are not used. No chemical pesticide has been found to replace the substance. Traditional methods of pest management have been improved upon by the use of biological agents, but yields are lower.
(2). The labor required to maintain the drains has been included explicitly as a cost that must be incurred year after year. If the labor is applied, the water table maintains a steady state and yields remain constant at a level consistent with a non-chemical pest management strategy. The new pest management scheme can reproduce outcomes over the long run since it utilizes delayed planting to destroy the natural host of the stemborer during the winter months.
Input output
relationships are described in Table
1.
LINKS TO
THEORY
A central concern in much of the environment and natural resource literature is to evaluate the implications of non-market benefits and costs for environmental and natural resource allocation. In contrast to other areas of economics, that emphasize the advantages of market allocations, market failure is commonplace when environment and natural resource allocations are addressed.
For analytical purposes, it is useful to divide non-market welfare impacts into two categories: external costs and user costs. External costs exist whenever some individual's (say A's) utility or production relationships include real variables, whose values are chosen by others (persons, corporations, governments) without particular attention to the effect on A's welfare. Failure to account for "third party" or external effects, such as the impact of toxic pesticides, results in the overuse of scarce environmental resources.
User cost results from failure to value properly future consumption. For such stock resources as water, fisheries, and soils, failure to account for the user cost component inherent in their use results in dynamic inefficiencies; long-run gains are sacrificed in the course of short-run decision making. A prominent example of user cost concerns in the agricultural sector is the concept of "sustainability". While short-run profits can be enhanced by ignoring soil and water conservation, the long-run viability of the arable land base may be jeopardized by such myopic decision making.
Both types of non-market impacts, external and user costs, are sources of concern for the optimal use of resources. Left unaccounted, either through market failure or the nonexistence of markets, scarce environmental and natural resources are likely to be over-exploited. In the "sustainable" system, externalities have been eliminated by removing toxic chemicals from the paddy growing technology, thereby breaking the physical link to the fish producing system and to the drinking water system.
By defining a steady state system, i.e., the water table must remain at a depth that will not affect paddy yields, user costs have also been taken into account. The "resource" in this case is the aquifer space in which water may accumulate without damage. The answer to the question of how much of the resource should be used in the present and how much should be saved for the future is answered by a decision rule that maintains environmental conditions, in this case the space in the aquifer, intact for future generations.
Although it is a solution, there is nothing to ensure that this is the optimal solution to the sustainability problem. Budget-based methods do not contain enough information to permit the policy analyst to incorporate optimality conditions. However, it does provide one answer to the question of what a sustainable agriculture would look like and what its private and social returns would be.
The sustainable evaluation reflects a "standards" approach to the question of how environmental policies can be evaluated. The pesticide has been eliminated, not because of an actual empirical estimate of marginal costs and benefits, but because of a judgment about these costs and benefits that is then imposed on the allocation of resources reflected in the input-output relationships.
The argument for basing policy on an environmental "standard," such as the parts per million of a certain chemical or depth to groundwater, is that data for the benefit side of these computations is virtually impossible to obtain. Budgeting methods that rely on costing different standards are thus a second-best approach to analyzing environmental problems.
Under a standards approach, the choice of criteria becomes a critical part of the discussion. Is the standard that the water table should not rise to within x feet the correct distance? Is it necessary to ban pesticide x because it has been shown in the laboratory to have a certain effect on rats? The sustainable input-output relationships say nothing about trade-offs. They simply allow the analyst to cost the alternatives embedded in the physical relationships claimed to be sustainable.
DYNAMIC ISSUES
The introduction noted that paddy, while an aquatic and relatively salt tolerant crop, cannot tolerate excessive salinity. Because of the amounts of water applied to paddy, there is a danger that, without adequate drainage, the water table will ultimately rise to the point where yields are affected. Once it reaches the point where a significant amount of capillary action is occurring and the saline water is evaporating from the soil surface, only a few salt-tolerant shrubs and grasses can grow.
Figure 1 describes a typical yield curve for a degrading resource. Initially, the decline is relatively modest. If the soil is deep, for example, no serious erosion effects may be felt for decades. Similarly, if the water table is well below the surface, irrigation may occur for many years before the ill effects of inadequate drainage are felt.
At some point, however, yields may fall precipitously. In the drainage case this occurs when the root zone of the plants become water-logged or salinity begins to rise to the surface. Ultimately, production may flatten out at same very low level, frequently below the level of profitability. Paddy will be replaced by coarse grasses and shrubs. These plants may be able to inhabit salt flats, but only a few families with marginal livestock can eke out an existence there.
Incorporating the effects of time-related environmental degradation in the budgeting framework requires two steps.
1. Instead of a single input-output table, a series of input-output tables must be created that describe the change in the physical environment over time.
2. Computation must be organized so that the stream of future costs and benefits is properly discounted to reflect the net present value (NPV) of alternative policy scenarios.
Multiple Year Input-Output Tables
It is feasible to create detailed multi-year input-output tables in which all physical coefficients change over time. However, in most cases, some simplification can be undertaken without biasing seriously the results. For example, it can be assumed that many of the cultural operations will continue to require approximately the same amount of labor regardless of the degree of salinity (harvesting and threshing would be an exception). The amount of machine hours, again with the exception of harvesting, may remain constant over a wide range of environmental conditions.
In this exercise, it is assumed that all declines in environmental quality of the unsustainable system are reflected in paddy yields. Moreover, it is assumed that the decline in yields is linear over time, as shown in Figure 2.
The sustainable physical relationships are assumed equally simple. Future yields are equal to present yields. There is, however, one important difference in the sustainable input-output table; a substantial amount of labor is required to dig and maintain an extensive surface drainage system. These deep field ditches collect water that is subsequently gathered in collector drains. Collector drains, in turn, dump their contents into a near-by river. (The externalities of releasing saline drainage water into a river that is ultimately the source of water supplies for downstream farmers are not considered.)
Table 2 is a yield degradation and enhancement table. By utilizing a "first" year decline or enhancement in conjunction with an annual rate of change, the table can be used to examine the effects of degradation or enhancement over time. The linear decline in yields, assumed in Figure 2, produces a linear decline in net revenues in the unsustainable case. The actual decline in yields under most degradation situations tends to be minimal for some time before changing rapidly as certain physical thresholds, such as water in the root zone, are reached.
ANALYSIS
Prepare a cost-benefit analysis of the rice production systems, using a 20 year time horizon (years 0 through 19). You will prepare one analysis based on the evaluation at private prices. A second analysis will be based on social prices. These are the prices that would prevail in the economy without the presence of distorting government policies. Price data are presented in Table 3 and Table 4.
Table 5 and Table 6 provide budget formats that you might find useful in developing your results. DO NOT PASS THESE IN. THEY ARE INTENDED ONLY TO ASSIST YOUR WORK AND CALCULATIONS. Whether or not you follow the formats of Table 5 and Table 6, you probably would find it helpful to develop the analysis in a computer spreadsheet; many of the calculations are repetitive, and it is easy to make errors with hand calculations.
Prepare a cost benefit evaluation, considering the 4 steps described below. Write a report to include and explain the meaning of your results. The time perspective is 20 years (years 0 through year 19). Use discrete forms of compounding and discounting in making your calculations of net present value (1/(1+r) t), or (easier) use the tables contained in books. The discount rate that you will use, for private and social evaluation, is 6 percent.
All necessary data is
contained in the above discussion, WITH ONE EXCEPTION. The
sustainable system requires an investment of 20,000
Pesos/hectare (in private and social values) in the initial
year of production. This investment is required to re-orient
the drainage system for the rice paddy. During this year
(year 0), NO production can take place.
Begin immediately on estimation of the baseline results. You
should use a spreadsheet to present estimates of benefits,
costs, and net benefits for each year of the project. You
then estimate the net present value. You do not need to
worry about the simulations. Just do the baseline
calculations. We will discuss the results at the fourth
lecture, in January. Interest rate tables are attached. (See
Discount Factor Table and Present Worth Table at sidebar or
under Handouts).
Your report focuses on the following issues:
1. Compute the net present value of the sustainable system and that of the unsustainable system, measured at private prices. Table 7 illustrates a format that you might find useful for presenting your results. Do farmers have the incentive to adopt the sustainable practices?
2. Do the same calculations, using social prices.
3. Sensitivity Analysis--Varying Degradation and Enhancement Rates
Show what happens to the results when the rate is increased to 3 percent per annum, and alternatively, when the degradation rate is reduced to 1 percent per annum.
Note: Enhancing the yields of the sustainable solution has exactly the opposite effect. If the degradation rate is set at 1 percent, show the effects of enhancing yields by 1 percent per annum Your results underscore the point that, in many cases, the rehabilitation of projects that seem to be deteriorating can provide exceptionally attractive investment opportunities.
4. Provide an analysis of
the incentives for farmers to adopt sustainable rice
production practices. The net benefits of sustainability in
the cost-benefit analysis are obtained by subtracting the
unsustainable budget from the sustainable budget. How do
your results of parts 1 and 2 compare? What are the
implications for policy, if government wants to encourage
sustainable practices?
Comments on
take-home assignment
The useful presentations involve clever ways to present the summary of results, so that the reader is not overwhelmed with numbers.
The key analytical results are that unsustainable systems are not interesting to farmers because they are less profitable, and they do not appear interesting in social terms. But this latter result may be because social evaluations do not include the full assessment of social costs and benefits. In particular, we do not have values to represent externality costs associated with environmental degradation and with affects on future generations. Sustainability evaluations thus are standards that the environment remains good for rice, forever. To make this interesting requires some subsidy particular to the sustainable systems. The land investment might be an attractive candidate (why?).
Last updated April 1, 2008
Document located at http://ag.arizona.edu/classes/arec514/riceproduction.html
website contact: arecweb@ag.arizona.edu