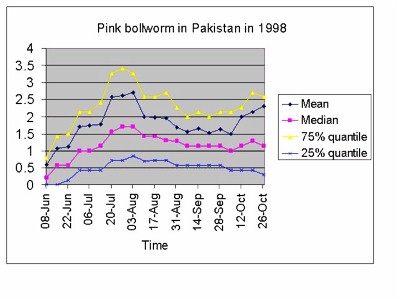
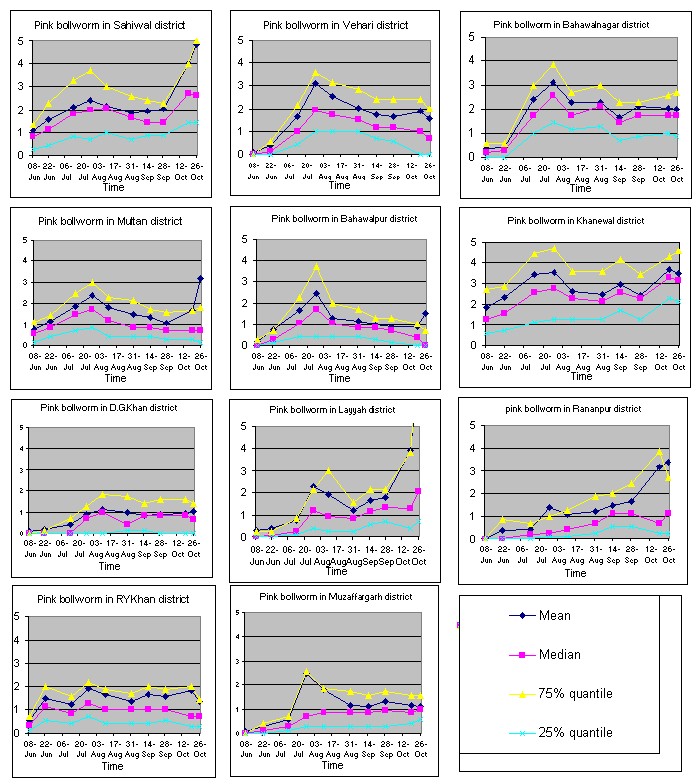
Summary statistics of the Pink Bollworm in the sampled districts: The figure shows the summary statistics of Pink Bollworm (PBW) data for the whole season. From the curve we can tell that as a whole PBW populations increase from the beginning of the season to between July 20 and Aug 3 when the PBW was most severe. After that, it declined. This proved to be the case in most individual districts. Based on the figure shown on the right, six sample dates were chosen for the indicator kriging to create the surface maps(see surface mapping). |
|
|
U of A Plant Pathology HOME | U of A Plant Pathology GIS Home | Central Cotton Research Institute Home |


